Heritage Tourism Market Size and Share
Market Overview
| Study Period | 2020 - 2031 |
|---|---|
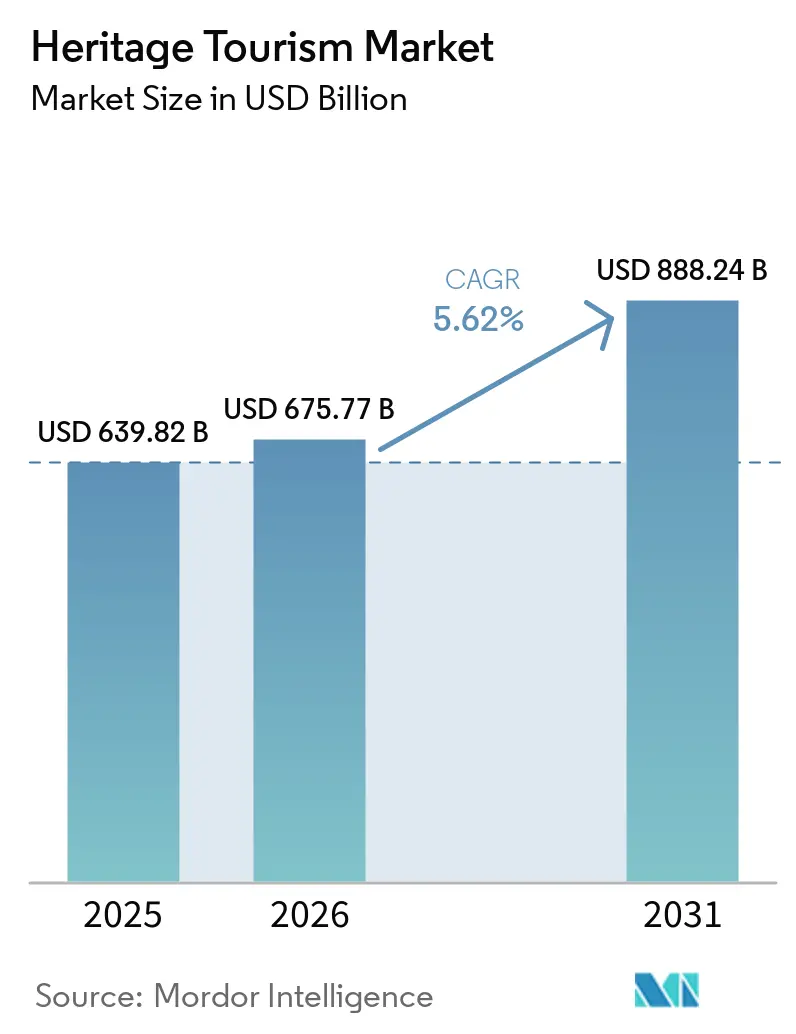
| Market Size (2026) | USD 675.77 Billion |
| Market Size (2031) | USD 888.24 Billion |
| Growth Rate (2026 - 2031) | 5.62% CAGR |
| Fastest Growing Market | Asia Pacific |
| Largest Market | Europe |
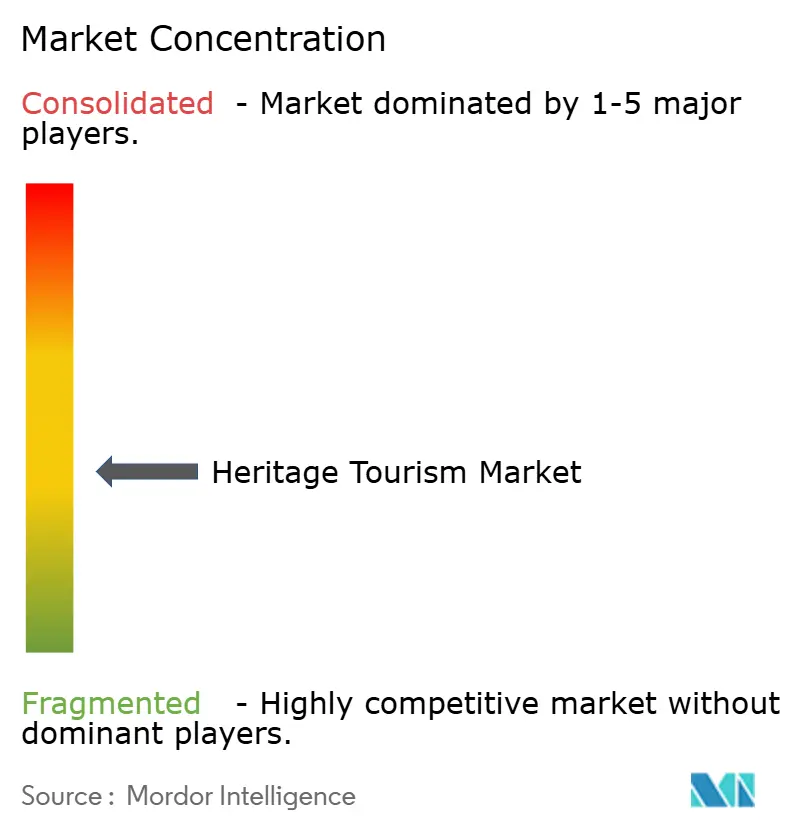
| Market Concentration | Medium |
Major Players *Disclaimer: Major Players sorted in no particular order Image © Mordor Intelligence. Reuse requires attribution under CC BY 4.0. | |
Heritage Tourism Market Analysis by Mordor Intelligence
The heritage tourism market size was valued at USD 639.82 billion in 2025 and estimated to grow from USD 675.77 billion in 2026 to reach USD 888.24 billion by 2031, at a CAGR of 5.62% during the forecast period (2026-2031). Rising demand for experience-centric travel, immersive storytelling, and authentic cultural encounters continues to redefine the heritage tourism market as visitors shift from passive sightseeing to participatory learning. Robust public-sector spending, including UNESCO’s USD 3 million World Heritage Fund allotment and Saudi Arabia’s USD 2 billion Vision 2030 heritage program, anchors preservation and infrastructure, while rapid advances in digital technology foster virtual previews, AI-driven trip curation, and on-site AR interpretation tools that extend engagement. At the same time, demographic realignment toward younger travelers with strong sustainability values is reshaping product design, forcing operators to integrate low-carbon mobility, community benefits, and transparent impact reporting into offerings. These converging trends not only propel revenue but also broaden participation, solidifying growth prospects for the heritage tourism market despite climate risks and overtourism regulations.
Key Report Takeaways
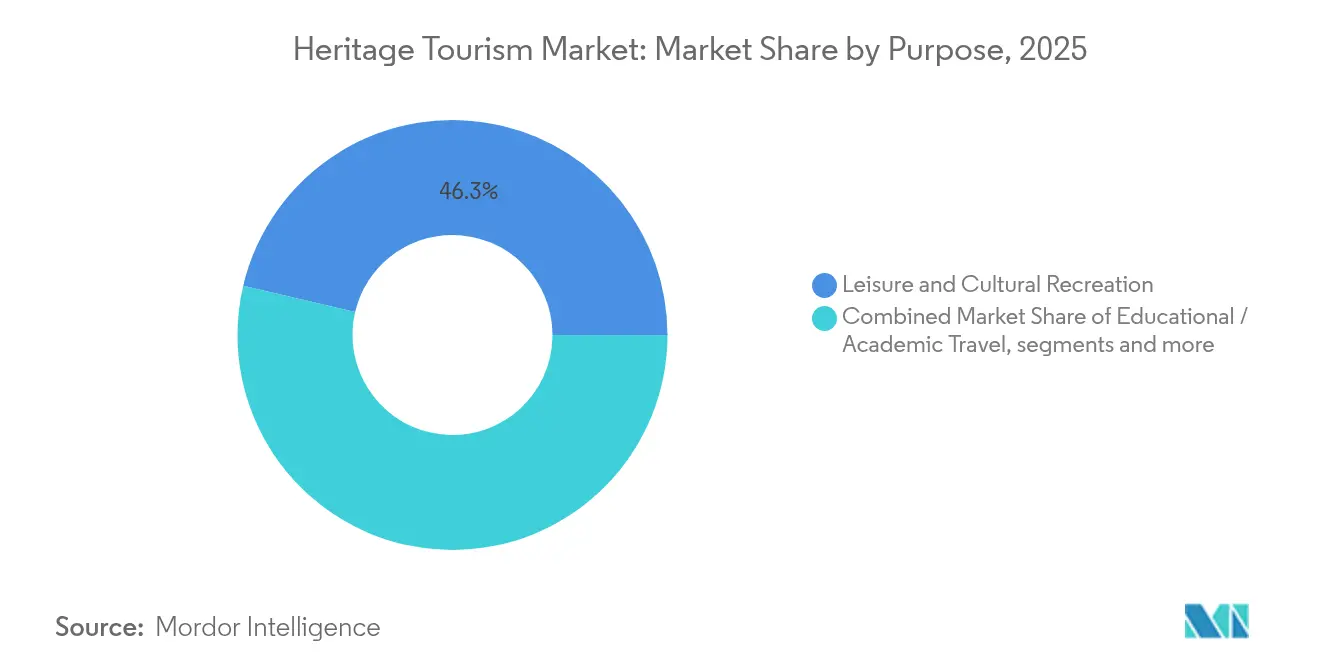
- By purpose, Leisure & Cultural Recreation led with 46.32% of heritage tourism market share in 2025, whereas Ancestral & Genealogy Travel is forecast to expand at 9.85% CAGR to 2031.
- By location type, Historical Monuments & Landmarks accounted for 36.20% of the heritage tourism market size in 2025, while Rural Heritage Villages are growing at a 9.15% CAGR through 2031.
- By booking channel, Online Travel Agencies controlled 45.10% of the heritage tourism market size in 2025 and will rise at 7.10% CAGR during the outlook period.
- By tourist demographics, Baby Boomers held 27.20% of the heritage tourism market share in 2025, but Generation Z records the fastest 7.95% CAGR through 2031.
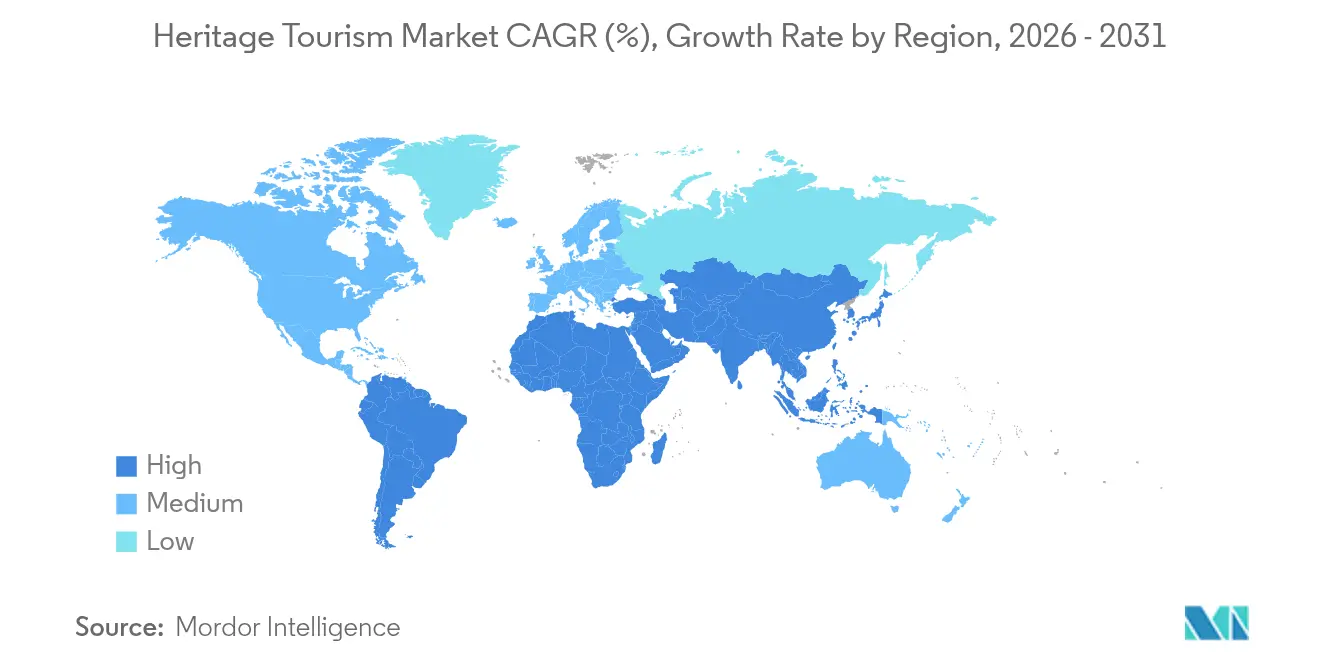
- By geography, Europe commanded 32.80% of the heritage tourism market share in 2025; Asia-Pacific posts the strongest 7.75% CAGR toward 2031.
Note: Market size and forecast figures in this report are generated using Mordor Intelligence’s proprietary estimation framework, updated with the latest available data and insights as of 2026.
Global Heritage Tourism Market Trends and Insights
Drivers Impact Analysis*
| Driver | (~) % Impact on CAGR Forecast | Geographic Relevance | Impact Timeline |
|---|---|---|---|
| Post-pandemic tourism rebound | +1.8% | Global, with the strongest recovery in Asia-Pacific and Europe | Short term (≤ 2 years) |
| Online booking & digital reach | +1.5% | Global, led by North America and Europe | Medium term (2-4 years) |
| Government heritage funding | +1.2% | Europe, Asia-Pacific, Middle East with Vision 2030 initiatives | Long term (≥ 4 years) |
| Genealogy-driven ancestry trips | +0.9% | North America, Europe, with diaspora connections globally | Medium term (2-4 years) |
| Secondary-city culture revival | +0.7% | Europe, Asia-Pacific, emerging in Latin America | Long term (≥ 4 years) |
| XR / AR-enabled site immersion | +0.6% | Developed markets initially, expanding to emerging economies | Long term (≥ 4 years) |
| Source: Mordor Intelligence | |||
Online booking & digital reach
Digital transformation now permeates discovery, planning, booking, and post-visit sharing, making it the single most pervasive growth catalyst for the heritage tourism market. Online Travel Agencies function as heritage matchmakers, using AI to align DNA-based ancestry data and personal interests with site recommendations, a capability underpinning their 45.84% channel share. VR walk-throughs and 360-degree livestreams let travelers “test-drive” monuments or rural villages before purchase, lifting conversion and lengthening the dreaming stage. Smart-ticketing, contact-free entry, and adaptive audio guides extend the curated experience on-site, while crowd-flow dashboards smooth capacity management for operators and municipalities. Together, these tools democratize marketing for lesser-known locations, disperse visitor loads, and deepen engagement time, reinforcing revenue and visitor satisfaction [1]MDPI, “Smart Glasses for Cultural Heritage: A Survey,” mdpi.com.
Government heritage funding
Long-horizon public investment underwrites structural stability across the heritage tourism market. UNESCO’s World Heritage Fund may disperse just USD 3 million annually, yet each grant historically mobilizes tenfold private and bilateral co-financing, validating the catalytic power of targeted spending. High-profile national schemes—such as Saudi Arabia’s USD 2 billion pledge under Vision 2030—blend archaeological conservation, transport upgrades, and capacity-building programs capable of creating tens of thousands of jobs while broadening regional tourism footprints. Emerging grant criteria now bundle climate resilience with culture, evident in the Climate Heritage Network’s USD 1.25 million Mellon award that funds adaptation projects for vulnerable communities in Africa and North America. By aligning preservation, community development, and climate action, public finance magnifies market capacity, extends visitor seasons, and ensures the longevity of heritage-led economic ecosystems.
Genealogy-driven ancestry trips
Affordable DNA testing has turned family history from a niche pastime into a mainstream travel trigger, injecting new momentum into the heritage tourism market. Roots tourism expanded 500% between 2014 and 2019 and maintains double-digit growth as platforms translate genetic matches into route suggestions. Italy’s USD 20 million Italea.com portal showcases a national strategy to lure 80 million diaspora descendants via hometown stays, archival record access, and local cooking workshops, thereby revitalizing depopulated regions while easing pressure on marquee cities. Countries from Ghana to Scotland replicate this diaspora-centric model, bundling citizenship services, cultural festivals, and ancestry tours that elevate emotional value and extend average length of stay. High personal connection translates into premium expenditure on bespoke guides, multi-generational travel, and keepsake purchases, amplifying per-capita revenue for destinations.
Secondary-city culture revival
As iconic European hubs impose cruise bans, per-day caps, and tax surcharges to tame overtourism, demand spills over to smaller towns rich in vernacular architecture, living crafts, and culinary heritage. UNWTO’s Best Tourism Villages initiative provides branding, technical guidance, and peer learning that allow rural or post-industrial settlements to professionalize visitor services without sacrificing authenticity. Cooperatives like Vivi Calascio in Italy demonstrate how resident-owned lodging, storytelling walks, and farm-to-table menus capture value locally, reversing out-migration and channeling profits into maintenance of churches, mills, and trails. Digital campaigns leveraging drone footage and influencer partnerships narrow the visibility gap with capital cities, while improved rail and e-bike connectivity addresses last-mile friction. This distributed model broadens geographic equity, supports resilience against climate-induced seasonality shifts, and positions the heritage tourism market for balanced growth.
Restraints Impact Analysis*
| Restraint | (~) % Impact on CAGR Forecast | Geographic Relevance | Impact Timeline |
|---|---|---|---|
| Overtourism visitation caps | -1.1% | Europe (Spain, Italy), selected UNESCO hotspots | Short term (≤ 2 years) |
| Geopolitical conflicts & risk | -0.8% | Middle East, Eastern Europe, with spillover effects globally | Medium term (2-4 years) |
| Climate-driven site degradation | -0.6% | Mediterranean, coastal & mountain heritage zones | Long term (≥ 4 years) |
| Skilled artisan shortage | -0.3% | Global, most acute in developing regions | Long term (≥ 4 years) |
| Source: Mordor Intelligence | |||
Overtourism visitation caps
Municipalities and heritage authorities increasingly deploy timed ticketing, daily quotas, and cruise-ship exclusions to safeguard local life and fragile structures, but these measures also constrain short-run volume growth for the heritage tourism market. Barcelona’s curb on new hotel licenses and Venice’s vessel rerouting reflect a paradigm shift toward quality-over-quantity visitor strategies, yet they compress ticket yields for operators reliant on scale. To sustain revenues, sites adopt premium positioning—after-hours tours, limited-capacity concerts, and scholarly lectures—that target high-spend niches rather than mass arrivals. Redistribution policies further encourage travelers toward shoulder seasons or inland itineraries, yet such shifts demand upgraded transit links and marketing budgets for emerging areas. Over the medium term, strict caps reduce congestion and enhance visitor experience, but in the near term, they shave aggregate growth by lowering throughput [2]CNBC, “Protests Will Spread if European Cities Don’t Address Overtourism,” cnbc.com.
Climate-driven site degradation
Sea-level rise, storm surges, wildfire, and accelerated stone decay already compromise structural integrity, authenticity, and year-round access at many iconic locations, curbing the potential output of the heritage tourism market. UNESCO notes 73% of World Heritage properties face high water-related risk, while Spain forecasts that three cultural sites could sit underwater under high-emission scenarios. Rising insurance premiums and mounting restoration costs strain operator budgets, sometimes pushing admissions beyond price elasticity thresholds for budget travelers. To mitigate loss, management bodies erect flood barriers, install micro-climate monitoring, and trial digital twins for remote visitation—each initiative valuable but capital-intensive. Without aggressive adaptation and emission reduction, climate stress threatens to shorten visiting windows, displace itineraries, and erode destination competitiveness over the long term.
*Our forecasts treat driver/restraint impacts as directional, not additive. The impact forecasts reflect baseline growth, mix effects, and variable interactions.
Segment Analysis
By Purpose: Ancestry Travel Transforms Heritage Motivations
Ancestral & Genealogy Travel, supported by DNA diagnostics, micro-archive digitization, and diaspora outreach, leads all-purpose segments with a 9.85% CAGR through 2031. Country-level campaigns such as Ghana’s Beyond the Return, Scotland’s homecoming festivals, and India’s Pravasi Bharatiya initiatives configure tailored content around temple visits, village homestays, and community service, expanding the heritage tourism market size derived from roots travel. Leisure & Cultural Recreation continues to command 46.32% heritage tourism market share but is itself evolving; standard day trips now incorporate artisan workshops, night-time illuminations, or pop-up food fairs that enhance stay length and spend. Educational & Academic Travel gains traction among universities embedding field archaeology, vernacular architecture studios, and language immersion into curricula, contributing to year-round revenue stability. Pilgrimage routes such as the Camino de Santiago recorded nearly 500,000 pilgrims in 2024, half motivated by cultural exploration, illustrating the convergence between spirituality and secular learning.
Heightened personalization reinforces expenditure: ancestry tourists often spend 30% more on genealogists, translators, and bespoke transportation than leisure cohorts, driving incremental gains in the heritage tourism market. Governments exploit this premium by offering visa fast-tracks and tax incentives for building heritage-themed accommodation in ancestral towns. Festival & Event-Led Travel, the smallest category, provides spikes that stabilize low seasons, with intangible heritage showcases—dance rituals, storytelling marathons, or harvest feasts—enhancing community pride and visitor differentiation. By intertwining emotion, authenticity, and education, each purpose segment elevates not only its own trajectory but also the collective perception of heritage value.


By Location Type: Rural Heritage Villages Drive Authentic Experiences
Rural Heritage Villages post the fastest 9.15% CAGR as travelers seek uncrowded, open-air settings that deliver cultural immersion and environmental relief from densely touristed capitals. UNWTO’s Best Tourism Villages label mitigates risk perceptions and signals quality, helping destinations secure grants, digital marketing tools, and peer-to-peer training. Historical Monuments & Landmarks still control 36.20% of the heritage tourism market size, yet many now impose hourly visitor caps and differentiated pricing that tilt revenue models toward higher-margin curated experiences. Museums & Cultural Centers harness AR holograms and VR walk-throughs of extinct structures, engaging Generation Z and Millennials via interactive content. Cultural Routes & Trails, from Saudi Arabia’s Darb Zubaydah to Japan’s Kumano Kodo, offer multi-site packages that disperse footfall, lengthen stays, and promote regional handicrafts, strengthening resilience across the heritage tourism market.
Integrated agritourism accelerates village appeal—Romania’s Bucovina region saw tourist accommodations grow more than 200% between 2014 and 2023 as monasteries, weaving ateliers, and farm inns formed bundled itineraries. Hybrid funding, including EU LEADER grants and crowdsourced heritage bonds, secures stone cottage renovations and craft apprenticeships, ensuring preservation and job creation. Such models align with climate adaptation by spreading visitor pressure, adopting low-carbon transport (e-bikes, electric minibuses), and promoting local food chains. Collectively, location diversification anchors long-term sustainability and amplifies the overall heritage tourism market share captured by non-urban assets.
By Tourist Demographics: Generation Z Drives Sustainable Heritage Preferences
Generation Z exhibits the steepest 7.95% CAGR, validating forecasts that ethics-minded, tech-fluent youth will shape future heritage consumption. Surveys reveal 70% of Gen Z travelers are willing to pay surcharges for carbon-neutral transportation, prompting operators to integrate rail bundles, e-bike rentals, and biodegradable packaging. Their enthusiasm for metaverse previews propels museums, castles, and open-air sites to create digital twins that monetize remote audiences while funneling interest toward physical visits. Baby Boomers sustain a 27.20% heritage tourism market share, dominating river-cruise and long-stay itineraries that offer comfort and curated learning. Millennials crave social-media-ready artisan experiences (pottery, dance, culinary classes) linked to home-stay models, while Generation X often travels as multi-generational groups, prioritizing safety and moderate activity levels.
This demographic cocktail accelerates supply diversification: youth hostels retrofit into carbon-neutral “eco-pods,” heritage hotels add co-working lounges, and rural villages deploy podcasts to guide self-driving tourists along craft trails. The heritage tourism market thus responds with tiered offerings, from budget backpacker passes to luxury curated residencies, ensuring inclusivity and future-proof growth.

By Booking Channel: Digital Platforms Reshape Heritage Discovery
Online Travel Agencies, responsible for 45.10% of the heritage tourism market size, pivot from lodging-first engines to experience-centric hubs that bundle skip-the-line passes, genealogy consultations, and live-stream concierge chats. AI chatbots instantly translate archival references, propose thematically linked sites, and generate interactive maps, driving a 7.10% CAGR for the channel. Direct-to-Site portals prosper for marquee attractions with strong branding, while Specialist Tour Operators target affluent hobbyists—birdwatchers at colonial estates, battlefield reenactment fans, or architectural historians. Offline agencies, though shrinking, retain relevance for complex multi-country pilgrim circuits or senior groups requiring end-to-end assistance.
Tech advancements democratize market entry: community-run platforms allow rural villages to push inventory, monitor sentiment, and adjust pricing in real time. VR previews educate visitors about dress codes, fragile mosaics, or climate protocols, enhancing compliance and experience quality. Blockchain ticketing emerges to verify authenticity and reduce secondary-market fraud, a rising issue for popular night-time light shows at UNESCO sites. Digitalization, therefore, is not only a driver of convenience but a structural enhancer of resilience within the heritage tourism market.
Geography Analysis
Europe retains 32.80% of heritage tourism market share on the strength of dense UNESCO listings, reliable rail grids, and decades-old brand equity. Cities such as Venice impose EUR 10 day-trip fees and redirect cruise liners, nudging volume away from fragile canals toward inland Palladian villas, thereby protecting assets while preserving revenue streams. Climate adaptation funding channels EUR 2 billion into fortifying sea walls, raising walkways, and installing sensor-based preservation systems at heritage hotspots, reflecting how European stakeholders merge conservation with visitor safety. Italy’s roots-tourism push exemplifies proactive diversification, sending diaspora travelers to small towns where museum-quality churches, medieval alleys, and farm-stay kitchens stand ready to host immersive weeks.
Asia-Pacific projects the fastest 7.75% CAGR as China, India, and Southeast Asian nations formalize cultural corridors, lift aviation caps, and streamline e-visa platforms. China’s “Shared Vision” initiative supports restoration across Asia, while tax rebates lure private investors into adaptive-reuse hotels within hutongs and heritage shophouses . UNESCO-backed programs in Malaysia, Indonesia, and the Philippines train local guides in story craft, waste management, and digital marketing, elevating professionalism. Upgraded highways and high-speed trains shorten travel times from hubs to rural temples or colonial forts, multiplying multi-stop itineraries and boosting stay length. North America benefits from affluent diaspora leisure, robust road infrastructure, and premium educational travel, although long-haul cost inflation moderates growth rates. In the Middle East & Africa, Saudi Arabia’s AlUla model demonstrates how desert archaeology and rock-art tours can draw 250,000 visitors, one-third international, validating heritage as diversification beyond oil. African communities innovate with community-run bead markets, homestead museums, and living-culture safaris, leveraging heritage to empower women and youth. South American Andean nations bundle UNESCO-listed Inca trail extensions with indigenous weaving workshops, securing year-round flows that hedge against climate-related landslide closures on principal routes, rounding out geographic expansion within the heritage tourism market.

Competitive Landscape
The heritage tourism market is moderately fragmented, with legacy operators, specialist boutiques, and tech platforms vying for distinct niches. G Adventures and Intrepid Travel combine small-group formats with local partnerships, rolling out carbon-measured itineraries that resonate with eco-aware guests. Airbnb Experiences and Viator provide frictionless mobile purchasing and peer-review validation, capturing spontaneous bookers and long-tail offerings that traditional agencies often overlook. Scholarship-based providers such as Context Travel or National Trust Tours curate deep-dive seminars led by PhD historians, commanding premium margins among intellectually driven travelers.
Hospitality-conservation alliances gain momentum: Accor’s three-year partnership with the World Monuments Fund covers 5,700 hotel locations, funding conservation of the Chapel of the Sorbonne, parts of the Qhapaq Ñan, and other Watch-list sites while embedding guest-facing educational content. Technology remains a decisive differentiator: AR-enhanced city walks, cloud-hosted genealogy platforms, and blockchain-verified certificates of visit enrich authenticity and guard against counterfeiting. White-space opportunities surface in climate-resilient itinerary design, artisan capacity-building for scale, and diaspora concierge services that meld digital archival access with bespoke travel logistics. Competitive intensity grows, yet the diversity of segments and geographies ensures room for innovation and partnership, sustaining healthy churn within the heritage tourism market.
Heritage Tourism Industry Leaders
G Adventures
Intrepid Travel
Abercrombie & Kent
TUI Group
Airbnb Experiences
- *Disclaimer: Major Players sorted in no particular order

Recent Industry Developments
- May 2025: Accor and World Monuments Fund unveiled joint preservation projects at four Watch-list sites, promising new conservation models that merge hospitality reach with cultural stewardship.
- February 2025: Italy invested USD 20 million in Italea.com to attract 80 million diaspora descendants, strengthening the genealogy travel pipeline.
- January 2025: UNESCO issued a landmark report showing nearly two-thirds of Mediterranean World Heritage cities face combined heat and flood hazards, spotlighting climate-risk urgency for the heritage tourism market.
- October 2024: WTTC projected Indigenous tourism to contribute USD 67 billion to the global economy by 2034, expanding the interpretation of heritage beyond monuments to living traditions.
- September 2024: Climate Heritage Network secured USD 1.25 million for culture-based climate action targeting marginalized communities in Africa and North America.


Global Heritage Tourism Market Report Scope
| Leisure & Cultural Recreation |
| Educational / Academic Travel |
| Pilgrimage & Religious Travel |
| Ancestral & Genealogy Travel |
| Festival & Event-Led Travel |
| Historical Monuments & Landmarks |
| Museums & Cultural Centers |
| Rural Heritage Villages |
| Cultural Routes & Trails |
| Online Travel Agencies (OTAs) |
| Direct to Site / Attraction |
| Specialist Tour Operators |
| Offline Travel Agencies |
| Baby Boomers |
| Generation X |
| Millennials |
| Generation Z |
| North America | United States |
| Canada | |
| Mexico | |
| South America | Brazil |
| Argentina | |
| Chile | |
| Colombia | |
| Rest of South America | |
| Europe | United Kingdom |
| Germany | |
| France | |
| Spain | |
| Italy | |
| Benelux (Belgium, Netherlands, and Luxembourg) | |
| Nordics (Sweden, Norway, Denmark, Finland, and Iceland) | |
| Rest of Europe | |
| Asia-Pacific | China |
| India | |
| Japan | |
| South Korea | |
| Australia | |
| South-East Asia (Singapore, Indonesia, Malaysia, Thailand, Vietnam, and Philippines) | |
| Rest of Asia-Pacific | |
| Middle East and Africa | United Arab Emirates |
| Saudi Arabia | |
| South Africa | |
| Nigeria | |
| Rest of Middle East and Africa |
| By Purpose | Leisure & Cultural Recreation | |
| Educational / Academic Travel | ||
| Pilgrimage & Religious Travel | ||
| Ancestral & Genealogy Travel | ||
| Festival & Event-Led Travel | ||
| By Location Type | Historical Monuments & Landmarks | |
| Museums & Cultural Centers | ||
| Rural Heritage Villages | ||
| Cultural Routes & Trails | ||
| By Booking Channel | Online Travel Agencies (OTAs) | |
| Direct to Site / Attraction | ||
| Specialist Tour Operators | ||
| Offline Travel Agencies | ||
| By Tourist Demographics | Baby Boomers | |
| Generation X | ||
| Millennials | ||
| Generation Z | ||
| By Region | North America | United States |
| Canada | ||
| Mexico | ||
| South America | Brazil | |
| Argentina | ||
| Chile | ||
| Colombia | ||
| Rest of South America | ||
| Europe | United Kingdom | |
| Germany | ||
| France | ||
| Spain | ||
| Italy | ||
| Benelux (Belgium, Netherlands, and Luxembourg) | ||
| Nordics (Sweden, Norway, Denmark, Finland, and Iceland) | ||
| Rest of Europe | ||
| Asia-Pacific | China | |
| India | ||
| Japan | ||
| South Korea | ||
| Australia | ||
| South-East Asia (Singapore, Indonesia, Malaysia, Thailand, Vietnam, and Philippines) | ||
| Rest of Asia-Pacific | ||
| Middle East and Africa | United Arab Emirates | |
| Saudi Arabia | ||
| South Africa | ||
| Nigeria | ||
| Rest of Middle East and Africa | ||


Key Questions Answered in the Report
What revenue is expected for the heritage tourism market in 2031?
USD 888.24 billion
Which purpose segment is expanding fastest?
Ancestral & Genealogy Travel, with 9.85% CAGR.
Which region shows the highest growth rate through 2031?
Asia-Pacific, at 7.75% CAGR.
How dominant are online booking platforms?
They capture 45.10% of the heritage tourism market size and grow 7.10% CAGR.
Why are rural heritage villages popular?
They deliver authentic, community-based experiences and record a 9.15% CAGR under UNWTO’s Best Tourism Villages push.
What climate threats affect heritage assets?
UNESCO reports that 73% of World Heritage sites face high water-related hazards, demanding urgent adaptation.
Page last updated on:


