
Hematocrit Test Devices Market Size and Share
Market Overview
| Study Period | 2020 - 2031 |
|---|---|
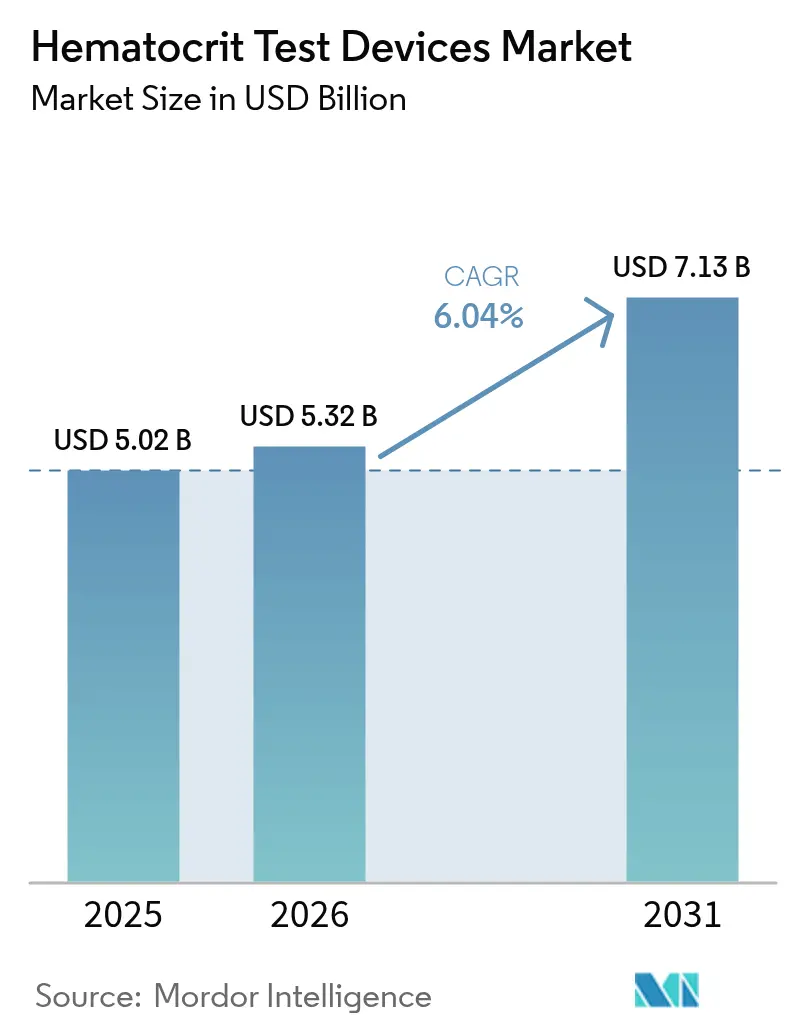
| Market Size (2026) | USD 5.32 Billion |
| Market Size (2031) | USD 7.13 Billion |
| Growth Rate (2026 - 2031) | 6.04 % |
| Fastest Growing Market | Asia-Pacific |
| Largest Market | North America |
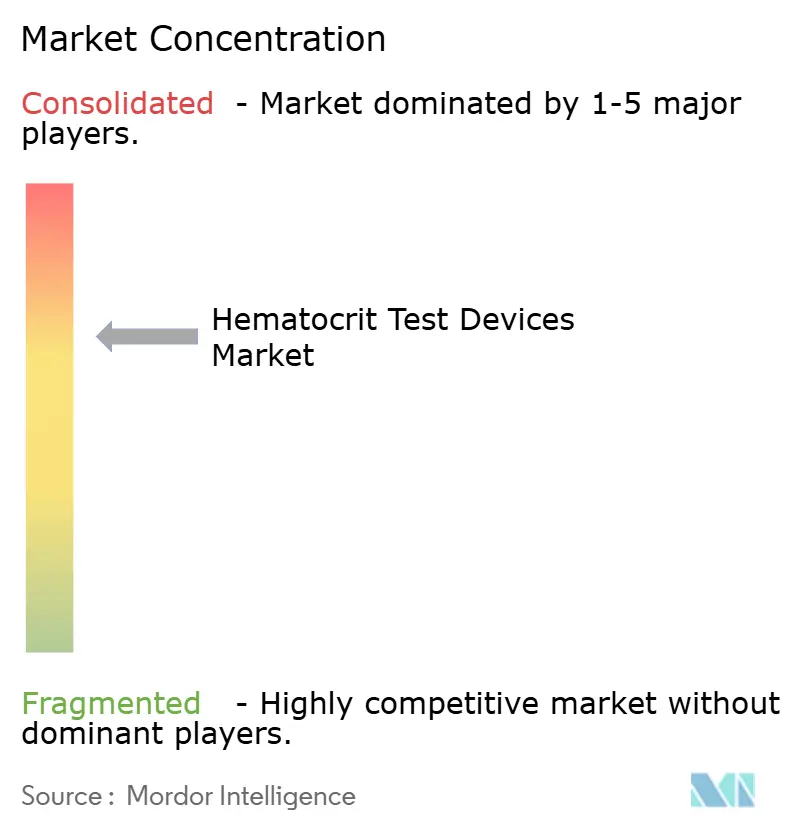
| Market Concentration | Medium |
Major Players *Disclaimer: Major Players sorted in no particular order Image © Mordor Intelligence. Reuse requires attribution under CC BY 4.0. | |
Hematocrit Test Devices Market Analysis by Mordor Intelligence
The hematocrit test devices market size was valued at USD 5.02 billion in 2025 and estimated to grow from USD 5.32 billion in 2026 to reach USD 7.13 billion by 2031, at a CAGR of 6.04% during the forecast period (2026-2031). Expanding diagnostic demand created by the global anemia burden, rapid migration toward automated 5-part differential analyzers, and integration of artificial intelligence into point-of-care (POC) platforms are the primary growth catalysts. Hospitals continue to upgrade to high-throughput systems that cut manual workload, while militaries and emergency services drive adoption of ultra-portable microfluidic meters that deliver hematocrit (Hct) results within seconds. Regulatory tightening, such as the 2024 CLIA rule that cut allowable Hct error margins by one-third, is simultaneously raising performance expectations and spurring innovation. Competitive intensity is moderate; incumbents leverage global installed bases and reagent lock-in models, yet handheld and smartphone-based entrants are reshaping customer expectations around convenience and cost.
Key Report Takeaways
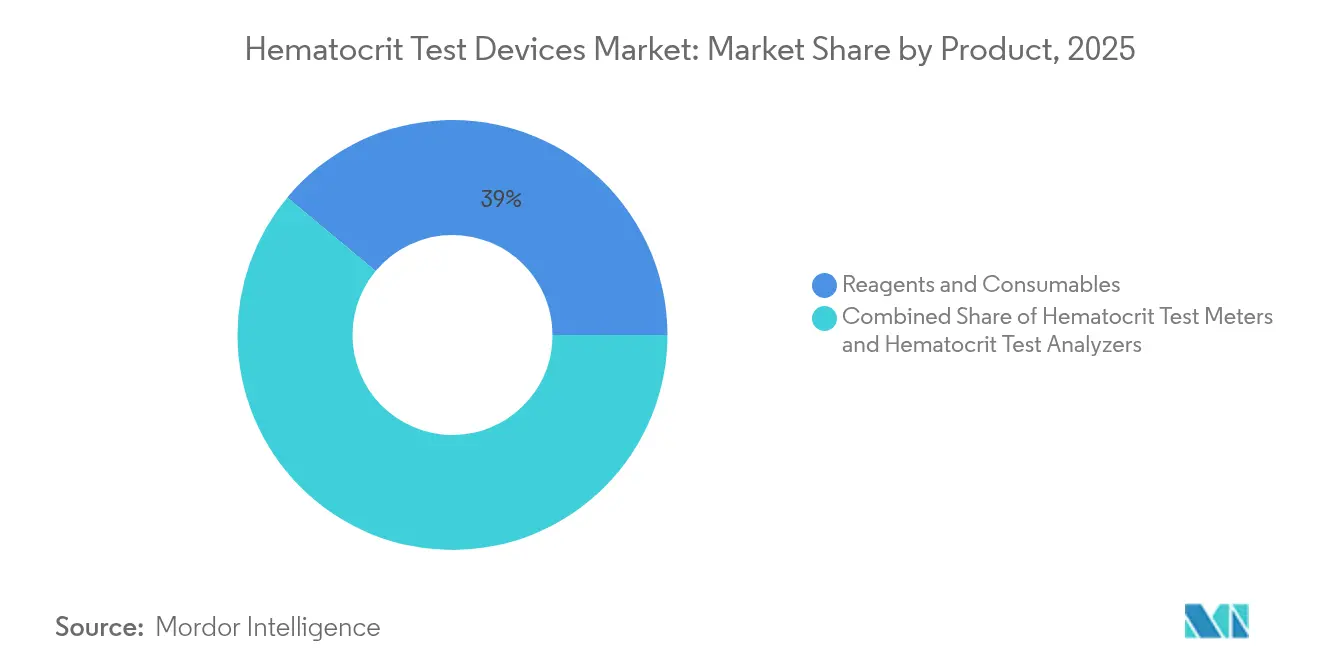
- By product category, reagents and consumables led with 38.95% revenue share in 2025, while hematocrit test analyzers are forecast to expand at a 11.92% CAGR to 2031.
- By technology, electrical impedance held 38.10% of hematocrit test devices market share in 2025, whereas microfluidic platforms are projected to grow at 13.2% CAGR through 2031.
- By application, anemia diagnosis and monitoring accounted for a 59.55% share of the hematocrit test devices market size in 2025; dialysis and renal care is advancing at a 12.95% CAGR to 2031.
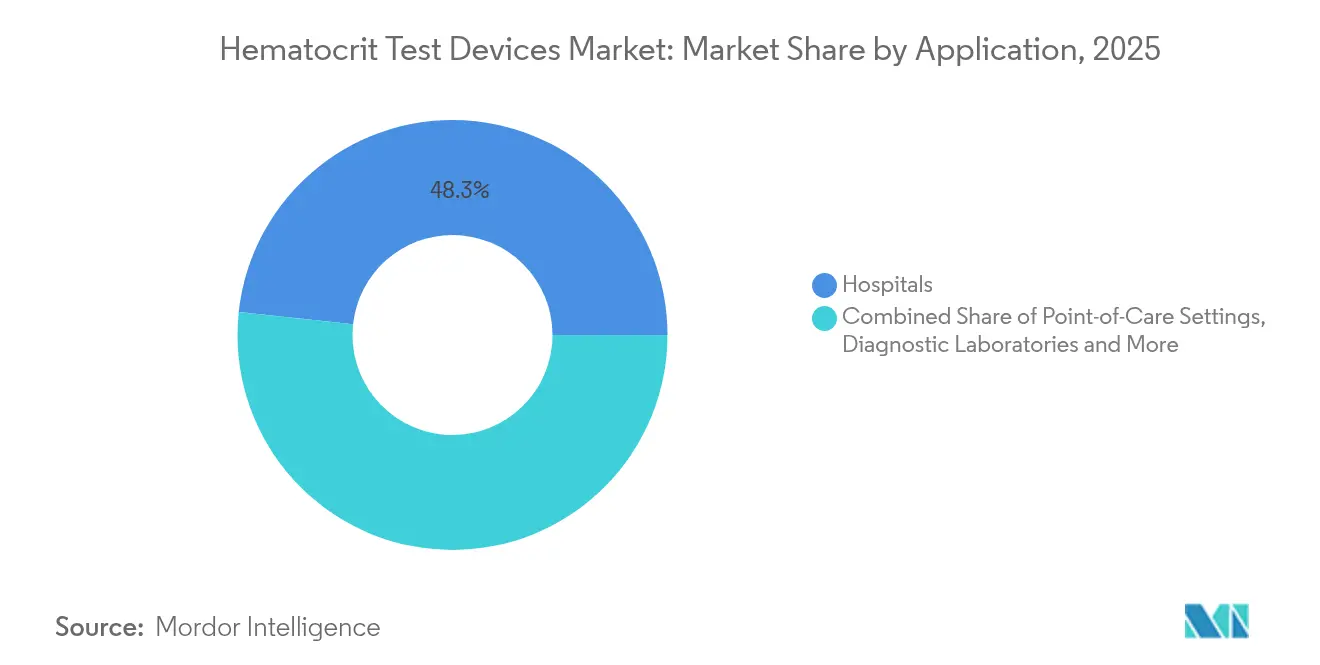
- By end user, hospitals captured 48.30% revenue share in 2025, yet point-of-care settings show the highest 13.95% CAGR through 2031.
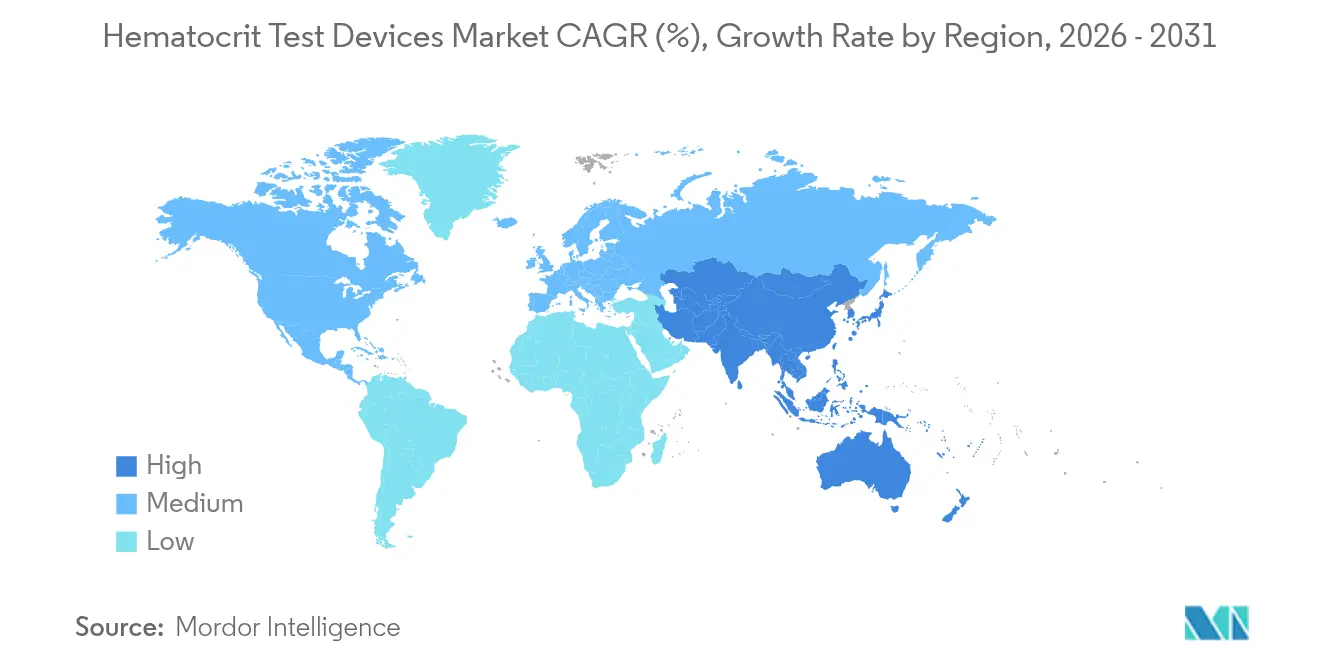
- By geography, North America commanded 39.20% revenue in 2025, while Asia-Pacific is expanding at 13.05% CAGR to 2031.
Note: Market size and forecast figures in this report are generated using Mordor Intelligence’s proprietary estimation framework, updated with the latest available data and insights as of 2026.
Global Hematocrit Test Devices Market Trends and Insights
Drivers Impact Analysis*
| Driver | (~) % Impact on CAGR Forecast | Geographic Relevance | Impact Timeline |
|---|---|---|---|
| Rising prevalence of anemia worldwide | +1.8% | Global, highest in Sub-Saharan Africa and South Asia | Long term (≥ 4 years) |
| Rapid adoption of fully automated 5-part analyzers | +1.2% | North America & EU, rising in Asia-Pacific | Medium term (2-4 years) |
| Growing geriatric population with blood disorders | +1.5% | Asia-Pacific, North America, Europe | Long term (≥ 4 years) |
| Shift to intra-operative Hct monitoring to cut transfusion costs | +0.9% | Global, earliest in developed markets | Medium term (2-4 years) |
| Military demand for ultra-portable microfluidic meters | +0.4% | North America, Europe, select Asia-Pacific | Short term (≤ 2 years) |
| Integration of AI-enabled self-testing apps for chronic care | +0.8% | Global, fastest in tech-forward regions | Medium term (2-4 years) |
| Source: Mordor Intelligence | |||
Rising Prevalence of Anemia Worldwide
Anemia affects nearly 2 billion people and 39.8% of children under five, driving continuous demand for reliable hematocrit testing devices[1]World Health Organization, “Anaemia,” who.int. Updated 2024 WHO hemoglobin cutoffs tightened diagnostic thresholds, compelling providers to deploy more precise instruments in both clinics and resource-limited outreach settings. Regions with high iron-deficiency rates, notably South Asia, are funding mobile screening programs that rely on battery-operated Hct meters. These initiatives reinforce long-term uptake of the hematocrit test devices market, particularly for consumables that accompany each field test. Preventing disease progression through early Hct screening also lowers treatment costs and improves maternal and child health outcomes.
Rapid Adoption of Fully Automated 5-Part Analyzers
Clinical laboratories confront staff shortages and mounting sample volumes, prompting a shift toward automated 5-part differential systems capable of handling thousands of complete blood counts per hour. Sysmex recorded 2,977 million CBCs in fiscal 2023, reflecting its 54.6% share of the automated hematology field[2]Sysmex Corporation, “Sustainability Data Book 2024,” sysmex.co.jp. New platforms embed digital cell morphology and AI algorithms that now identify arterial oxygen saturation patterns with 96% accuracy during hemodialysis. Partnerships such as Siemens Healthineers-Scopio Labs shorten turnaround times by 60%, raising clinical throughput.
Growing Geriatric Population With Blood Disorders
People over 75 increasingly present with complex anemia linked to chronic kidney disease, inflammation, and nutritional deficits, especially across aging Asian economies. Mendelian randomization links eosinophil and lymphocyte counts to biological aging, reinforcing the value of routine Hct monitoring for precision geriatric care. Health systems respond with age-specific reference intervals, spurring demand for easy-to-use analyzers adaptable to outpatient, long-term care, and home settings.
Shift to Intra-Operative Hct Monitoring
Hospitals invest in real-time Hct sensors during surgery to cut transfusion costs and reduce postoperative complications. In cardiac bypass, Quantum Perfusion achieved deviation of only 0.2 percentage points compared with standard blood-gas systems. Such accuracy supports closed-loop fluid management protocols and aligns with tighter CLIA limits, boosting demand for integrated blood-management consoles.
Restraints Impact Analysis*
| Restraint | (~) % Impact on CAGR Forecast | Geographic Relevance | Impact Timeline |
|---|---|---|---|
| Stringent FDA & CE approval timelines | -0.7% | North America & Europe | Medium term (2-4 years) |
| Limited awareness & training in low-income regions | -0.5% | Sub-Saharan Africa, South Asia, parts of Latin America | Long term (≥ 4 years) |
| Microfluidic cartridge supply-chain fragility | -0.3% | Global, high Asia-Pacific concentration | Short term (≤ 2 years) |
| Accuracy concerns in non-invasive optical Hct wearables | -0.4% | Global | Medium term (2-4 years) |
| Source: Mordor Intelligence | |||
Stringent FDA & CE Approval Timelines
The FDA now requires manufacturers to flag supply-chain disruptions and submit broader clinical datasets, stretching approval cycles for innovative Hct platforms[3]U.S. Food and Drug Administration, “Medical Device Supply Chain Vulnerabilities,” fda.gov. Class II designation for coagulation devices illustrates the agency’s tighter stance, which raises entry barriers for start-ups. In Europe, MDR compliance adds cost and paperwork, delaying commercialization of novel microfluidic cartridges and AI software.
Accuracy Concerns in Non-Invasive Optical Wearables
Optical devices appeal to consumers but still show bias up to 0.75 g/dL versus reference methods, limiting their use as stand-alone clinical tools. Ambient light, tissue variability, and hydration status can distort readings, so clinicians treat them as trend monitors rather than absolute measures. Ongoing calibration research aims to improve precision, but the restraint will curb near-term adoption rates.
*Our forecasts treat driver/restraint impacts as directional, not additive. The impact forecasts reflect baseline growth, mix effects, and variable interactions.
Segment Analysis
By Product: Consumables Sustain Recurring Revenue
Reagents and consumables held 38.95% of 2025 revenue, a testament to the installed-base model that locks in repeat purchases of cuvettes, cartridges, and quality-control reagents for every test run. Each new analyzer installation amplifies this annuity stream across hospitals, diagnostics labs, and field units, making the category a profit anchor for suppliers. Hematocrit test analyzers, the fastest-growing product group at 11.92% CAGR, reflect laboratories’ migration to fully automated 5- or 6-part systems that integrate CBC, ESR, and blood-gas functions in one console.
Handheld meters are carving out niches in emergency medical services and rural clinics by offering six-second turnaround using capillary blood, while veterinary practices adopt mobile analyzers validated for canine hematology applications. This broadening user mix keeps the hematocrit test devices market expanding on both capital equipment and disposable fronts. In dollar terms, the hematocrit test devices market size for reagents is projected to widen in tandem with global analyzer placements, reinforcing suppliers’ focus on supply-chain resilience and predictable pricing contracts.



By Technology: Microfluidics Reshapes Diagnostics
Electrical impedance retained 38.10% hematocrit test devices market share in 2025 due to decades of trust among lab directors. Yet microfluidic and lab-on-chip platforms are outpacing legacy methods at 13.2% CAGR because they require only microliters of blood and function with gravity-driven flow, slashing pump costs. Researchers now fabricate polymer channels with femtosecond lasers at one-eighth of traditional cost, accelerating commercialization.
Optical spectrometry remains valuable for non-invasive monitoring, though precision still lags invasive assays. Conductivity and acoustofluidic techniques add options for niche applications such as platelet-free plasma preparation and red-cell deformability studies. As microfluidic production scales, vendors bundle cloud analytics and AI algorithms, redefining value beyond simple cell counting. The hematocrit test devices market size for microfluidic systems is on track to command a growing revenue slice as buyers prioritize portability without sacrificing laboratory-grade accuracy.
By Application: Dialysis Drives New Volume
Anemia diagnosis and monitoring accounted for 59.55% of 2025 revenue, mirroring clinicians’ everyday reliance on Hct values to guide iron therapy and nutritional interventions. Dialysis and renal care, however, posts the fastest 12.95% CAGR, because real-time Hct monitoring optimizes fluid removal and limits intradialytic hypotension. Relative blood-volume sensors embedded in dialysis machines correlate with lower hospitalization, encouraging clinics to standardize on integrated Hct modules.
Cardiac surgery, critical care, and oncology supportive care collectively add incremental demand, leveraging closed-loop systems that maintain precise oxygen-carrying capacity during complex procedures. In hemodynamics research, online Hct sensors now inform perfusion decisions every few seconds, creating data streams for algorithm-driven fluid therapy. The result is a broader clinical mandate that keeps the hematocrit test devices market growing across acute and chronic care pathways.
By End User: Point-of-Care Takes Off
Hospitals remained the largest buyers with 48.30% of 2025 spend, supported by centralized laboratories and OR integration. Yet point-of-care environments, spanning physician offices, ambulances, and retail clinics, register the quickest 13.95% CAGR. Capillary collection technologies like BD MiniDraw enable trained staff to obtain high-quality samples without traditional venipuncture, lowering both patient anxiety and infrastructure barriers.
Diagnostic laboratories still manage mass screening and reference testing, while blood banks depend on rapid Hct checks to safeguard donors. Military and disaster-response units prefer battery-operated analyzers that withstand harsh climates, and home-health models are emerging through AI-enabled apps that link personal devices to cloud dashboards. Together these trends expand the hematocrit test devices market size beyond hospital walls and closer to the patient.
Geography Analysis
North America held 39.20% of global revenue in 2025, underpinned by sophisticated hospital networks, favorable reimbursement, and rapid uptake of integrated hematology workstations. Defense funding for blood substitutes and the FDA’s active supply-chain surveillance further shape demand by ensuring product continuity and elevating quality benchmarks. Canada and Mexico contribute through public-sector modernization programs that broaden access to automated CBC testing.
Asia-Pacific is the fastest-growing region at a 13.05% CAGR as China, India, Japan, South Korea, and Southeast Asian nations overhaul infrastructure and address aging demographics. Government tenders in China now favor mid- and low-end analyzers, pressuring pricing yet lifting unit volumes. India’s smartphone-based anemia screening exemplifies leapfrog adoption in areas with limited laboratory capacity. Japan’s elderly population, where up to 50% of males exceed normal hemoglobin thresholds, fuels sustained analyzer demand tailored to geriatric reference ranges. Europe remains a key revenue pillar thanks to strict quality protocols and broad insurance coverage. Germany, the United Kingdom, and France lead high-end analyzer deployments, while Southern European markets scale POC meters to manage chronic-disease clinics. Middle East and Africa witness rising procurement backed by anemia prevalence that tops 60% among children in parts of the continent. South America follows, with Brazil and Argentina investing in public lab upgrades to combat nutritional anemia and renal disease. Collectively, these regional dynamics ensure the hematocrit test devices market continues its steady global expansion.

Competitive Landscape
Market concentration is moderate, with global leaders capturing scale benefits while nimble entrants disrupt selected niches. Sysmex sustains a commanding 54.6% share of the automated hematology segment and processed nearly 3 billion CBC tests in 2023, illustrating the moat created by installed bases and reagent contracts. Siemens Healthineers deepened its portfolio through a global OEM pact with Sysmex for hemostasis devices and a distribution deal with Scopio Labs for digital cell morphology, positioning itself as a full workflow provider.
Beckman Coulter focuses on compliance leadership, releasing DxH-520 for low-volume labs aligned with the 2024 CLIA precision mandate. HORIBA blends CBC and ESR into compact analyzers that address small hospital budgets, while Nova Biomedical targets emergency services with six-second Hct meters. In dialysis, Fresenius integrates Crit-Line sensors to cut patient admissions, illustrating how vertical specialists create sticky platforms.
Disruptors challenge incumbents through handheld and AI-powered solutions. CytoChip secured FDA clearance and a CLIA waiver for its palm-sized CBC analyzer, signalling regulatory confidence in miniaturized hematology. Sanguina’s Ruby app estimates iron status from fingernail photos, pointing to consumer-centric business models. Supply-chain fragility in microfluidic cartridges motivates partnerships with contract manufacturers outside Asia and investments in additive manufacturing, potentially reshaping cost structures. As performance standards climb, only firms able to balance accuracy, usability, and logistics will sustain share in the hematocrit test devices market.
Hematocrit Test Devices Industry Leaders
Abbott Laboratories
Nova Biomedical
Sysmex Corporation
EKF Diagnostics Holdings plc
Danaher Corporation (Beckman Coulter)
- *Disclaimer: Major Players sorted in no particular order

Market Opportunities and Future Outlook
Opportunities are clustering around point-of-care CBC platforms and portable workflows that fit hematocrit testing into low-infrastructure settings while meeting regulatory-grade performance expectations. CytoChip’s March 2025 FDA 510(k) clearance and CLIA waiver for a handheld CBC analyzer that includes hematocrit is a clear commercialization signal for decentralized testing in clinics and near-patient environments. In parallel, Algocyte launched its UKCA-certified Proxima Mobile Health Station in July 2026 in the United Kingdom, supporting non-specialist users to obtain hematocrit and hemoglobin readouts in minutes.
The next whitespace is forming around connected, minimally invasive sampling with microfluidic cartridges that can support longitudinal anemia and renal-care pathways. This also brings attention to known weak points that device makers will need to manage, including cartridge supply stability and validation across jurisdictions (UKCA versus FDA). Patent activity continues to back these directions, including Medtronic Monitoring’s US12262991B2 (granted April 2025) on non-invasive hematocrit monitoring approaches, and Daxor’s June 2026 U.S. patent covering remote blood volume monitoring technology that integrates hematocrit-linked analytics. Together, these developments suggest product roadmaps that go beyond single-parameter measurement toward integrated blood-management and chronic-care monitoring solutions, especially for dialysis and perioperative use cases where continuous or frequent hematocrit tracking supports protocol execution.
Recent Industry Developments
- July 2026: Algocyte launched the Algocyte Proxima Mobile Health Station in the United Kingdom following UKCA certification. The portable, AI-driven CBC system includes hematocrit and hemoglobin readouts with a short time-to-result, targeting use by non-specialized providers. The launch reinforces competitive momentum toward compact, software-forward hematology platforms in point-of-care and outreach settings.
- August 2025: Abbott Point of Care issued an updated Instructions for Use for i-STAT CG8+, EG7+, and EG6+ cartridges following U.S. FDA 510(k) clearance for the i-STAT CG8+ cartridge. The update aligns cartridge use and performance claims with the cleared configuration, supporting standardized deployment across installed i-STAT systems. It also highlights how cartridge-based ecosystems drive recurring utilization and ongoing compliance upkeep in near-patient testing.
- June 2025: Sysmex announced U.S. FDA 510(k) clearance for its XR-Series automated hematology analyzers (including XR-10 and XR-20). The clearances expand Sysmex's regulated analyzer lineup for clinical laboratories seeking automated workflows and consistent precision. This strengthens Sysmex's installed-base strategy where analyzer placements support follow-on demand for reagents, controls, and service.


Research Methodology Framework and Report Scope
Market Definition and Coverage
For this methodology, the hematocrit test devices market covers revenues generated from devices and consumables used to measure hematocrit levels in blood, across clinical and near-patient settings where the test result is used for screening, diagnosis, and monitoring.
Scope exclusions: We exclude general clinical chemistry equipment that does not perform hematocrit measurement and services-only revenues that are not tied to device or consumable sales.
Segmentation Overview
- By Product
- Hematocrit Test Meters
- Hand-held POC Meters
- Benchtop Meters
- Hematocrit Test Analyzers
- Automated 3-part Differential
- Automated 5/6-part Differential
- Integrated Blood-gas & Hct Platforms
- Veterinary-specific Analyzers
- Reagents & Consumables
- Hct Cuvettes & Micro-tubes
- Calibration & QC Reagents
- Test Cartridges/Strips
- Hematocrit Test Meters
- By Technology
- Electrical Impedance
- Optical / Photometric
- Conductivity-based
- Microfluidic & Lab-on-Chip
- Non-invasive Spectroscopy
- By Application
- Anemia Diagnosis & Monitoring
- Polycythemia Vera Management
- Congenital Heart Disease
- Surgery & Critical-Care Blood Management
- Dialysis & Renal Care
- Oncology Supportive Care
- By End User
- Hospitals
- Diagnostic Laboratories
- Blood Banks & Transfusion Centers
- Point-of-Care Settings
- Others
- Geography
- North America
- United States
- Canada
- Mexico
- Europe
- Germany
- United Kingdom
- France
- Italy
- Spain
- Rest of Europe
- Asia-Pacific
- China
- Japan
- India
- South Korea
- Australia
- Rest of Asia-Pacific
- Middle East and Africa
- GCC
- South Africa
- Rest of Middle East and Africa
- South America
- Brazil
- Argentina
- Rest of South America
- North America
Data Sources, Market Sizing, and Validation
Desk Research
Desk work starts with building a clean view of the testing ecosystem and the disease and care settings that drive hematocrit demand. We typically refer to public sources such as CDC anemia-related publications, WHO anemia and nutrition statistics, World Bank population and health expenditure series, FDA device databases and safety communications, and OECD health indicators to understand testing intensity and utilization directionally.
After that, the model inputs are grounded using issuer information such as annual reports, financial statements, investor presentations, and product brochures, alongside hospital laboratory guidelines and peer-reviewed hematology journals that describe hematocrit use in complete blood count workflows. Where available, we also use paid subscriptions for company financials and intelligence, patent databases, and an import and export shipment-level database to cross-check category activity by geography. These sources are illustrative only, and many other public and paid references are used to collect, validate, and clarify data points during the research.
Primary Interviews and Surveys
Primary work is used to confirm how hematocrit testing is actually purchased and used, especially the split between instruments and recurring consumables, and the pace of pricing changes in different care settings. We speak with a balanced mix of manufacturers, distributors, lab decision-makers, and clinical users across major regions so that adoption drivers, replacement cycles, and point-of-care versus lab workflows can be checked before finalizing assumptions.
Distribution of primary research fieldwork respondents
| Company type | Respondent position | Region |
|---|---|---|
| Top tier: 37% | CXOs: 19% | APAC: 50% |
| Mid tier: 43% | Functional/Unit leaders: 26% | EMEA: 31% |
| Smaller Players: 20% | Managers: 55% | Americas: 19% |
Market-Sizing & Forecasting
The market is sized using a top-down build that starts from hematology and complete blood count testing activity and then reconstructs the hematocrit-specific demand pool by setting, geography, and product mix. To keep it practical, results are then corroborated with selective bottom-up approximations, such as supplier revenue splits where disclosed, sampled instrument placements, and a price times volume check for key consumables, followed by adjustments when the two views do not align.
Inputs used in the model include anemia and related condition prevalence signals, test volumes by care setting (hospital labs, diagnostic centers, and near-patient sites), installed base and replacement cycle expectations for analyzers and meters, the instruments versus consumables revenue mix, and average selling price movement by geography and procurement channel. For forecasting, we lean on scenario analysis supported by expert consensus on utilization growth, tender intensity, and expected pricing direction, and then we apply the scenarios to the variable set to produce a realistic range before selecting the base case. Where bottom-up gaps exist due to limited disclosure, the missing pieces are filled using proxy ratios that are validated through interviews and are kept consistent with observed country-level health spending and testing access.
Data Validation & Update Cycle
Outputs are checked against independent signals like published health statistics, trade flow directionality for relevant consumables, and company-level revenue commentary to catch outliers early. If a country total or product mix looks unusual, the assumptions are reworked and, when needed, follow-up calls are triggered to confirm whether the variance is real or driven by a modeling input.
Before sign-off, the model and write-up go through multi-step analyst reviews that focus on year-to-year continuity, currency consistency, and logic checks across related hematology device categories. Reports are refreshed annually, and interim updates are made when material events occur, such as major regulatory changes, product recalls, or sharp pricing shifts. Right before delivery, an analyst performs a final pass so clients receive the latest updated view.
Mordor Intelligence's Hematocrit Test Devices Market Estimate Compared With Other Published Estimates
It is common to see different market sizes for hematocrit test devices, even when everyone is talking about the same general healthcare use case. The gaps usually come from what is counted as a device versus a broader hematology diagnostic bundle, which year is treated as the current estimate, and how prices are converted and trended across regions.
The biggest swing factors here are refresh cadence and currency timing, followed by how average selling prices are modeled for instruments versus recurring consumables and how point-of-care volumes are validated against lab-based testing. By keeping exchange-rate timing consistent and re-checking ASP movement during the update cycle, Mordor Intelligence reduces drift from short-term price shocks and avoids overstating growth when mix shifts are doing most of the work.
Benchmark comparison
| Source | Market Size | Gaps in Research Methodology |
|---|---|---|
| Mordor Intelligence | USD 5.32 B (2026) | |
| Industry Publisher A | USD 4.05 B (2025) | Uses a different base year and a longer forecast window, and the scope appears to emphasize device categories that can undercount recurring consumables in routine CBC workflows, which pulls the value down versus a fuller device-plus-consumables view. |
| Market Publisher B | USD 4.36 B (2024) | Anchors on an earlier currency-year snapshot and applies a lower near-term growth profile, which can miss recent ASP adjustments and testing utilization changes that were observed in more recent procurement and channel discussions. |
Overall, the spread is mainly explained by timing and pricing treatment, rather than a disagreement that hematocrit testing is growing steadily. When scope is kept tight to hematocrit-related instruments and consumables, and when ASPs and currency are updated in a repeatable way, the resulting market value stays easier to track and reconcile year over year.


Key Questions Answered in the Report
What is the current value of the hematocrit test devices market?
The market was valued at USD 5.32 billion in 2026 and is forecast to reach USD 7.13 billion by 2031 at a 6.04% CAGR.
Which product category generates the highest revenue?
Reagents and consumables lead with 38.95% of 2025 sales, driven by recurring demand across installed analyzers.
Why are microfluidic technologies gaining traction?
They enable laboratory-grade accuracy from microliter blood volumes, lower per-test costs, and support portable devices, fuelling a 13.2% CAGR.
Which region is expanding fastest?
Asia-Pacific is growing at 13.05% CAGR through 2031, supported by healthcare modernization and mobile diagnostics adoption.
How do regulatory changes affect market growth?
Tightened CLIA precision rules and extended FDA evaluation timelines raise compliance costs, delaying product launches but improving device reliability.
What role do AI-enabled smartphone apps play?
They provide non-invasive hemoglobin estimation, expanding screening into communities with limited laboratory access and boosting POC segment momentum.
Page last updated on:


 Your data is secure and never sold or shared.


