
Hardware Wallet Market Size and Share
Market Overview
| Study Period | 2020 - 2031 |
|---|---|
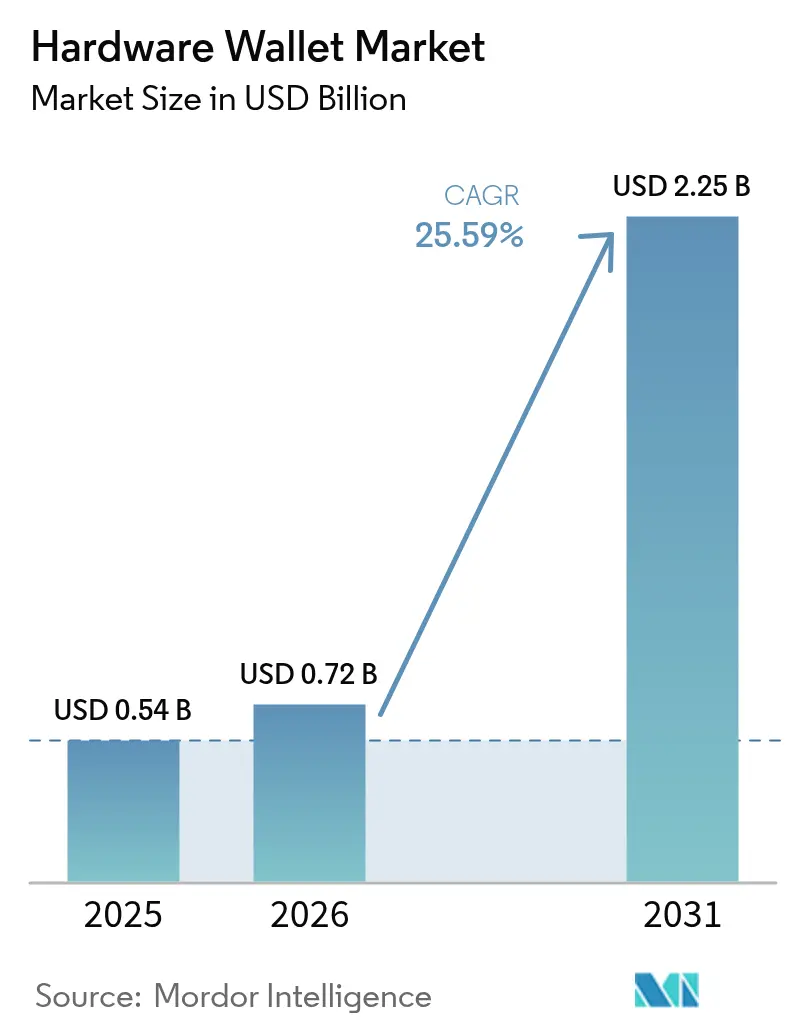
| Market Size (2026) | USD 0.72 Billion |
| Market Size (2031) | USD 2.25 Billion |
| Growth Rate (2026 - 2031) | 25.59 % |
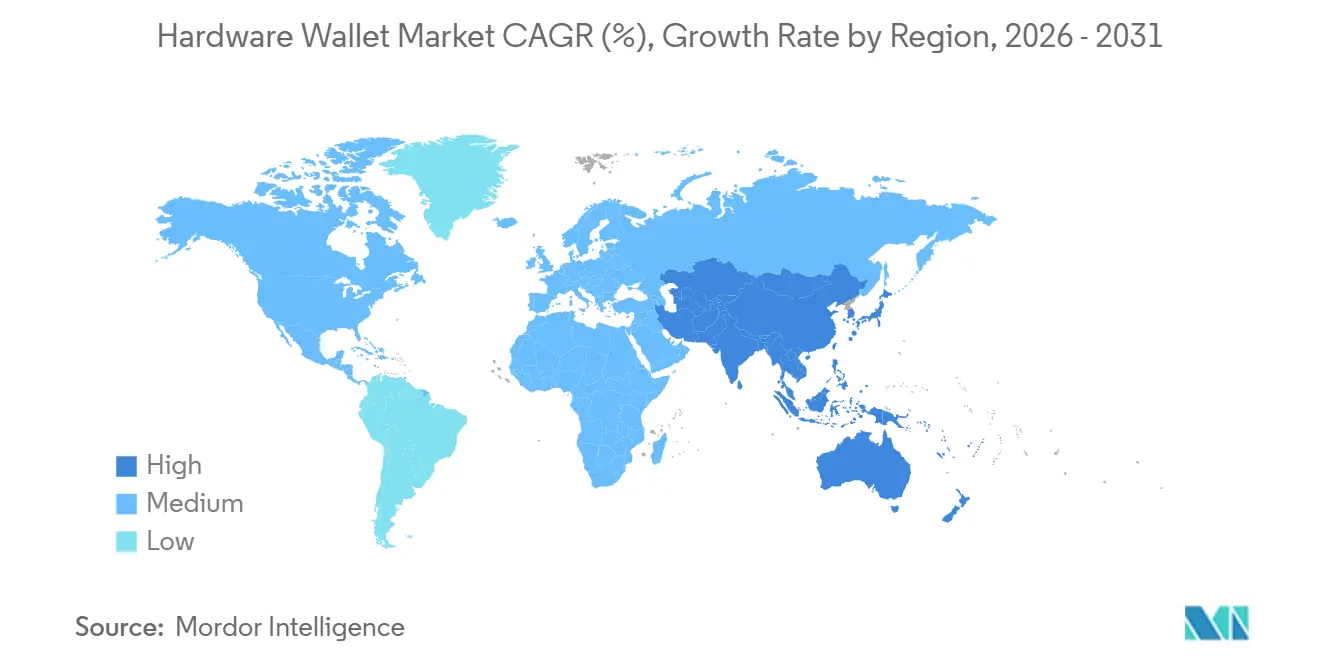
| Fastest Growing Market | Asia Pacific |
| Largest Market | North America |
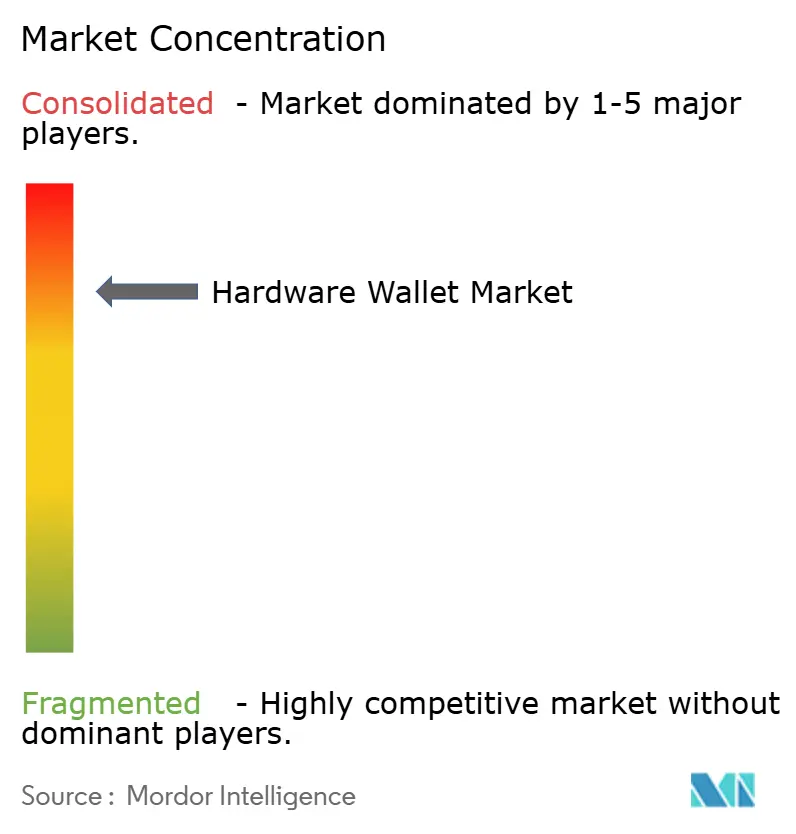
| Market Concentration | High |
Major Players *Disclaimer: Major Players sorted in no particular order Image © Mordor Intelligence. Reuse requires attribution under CC BY 4.0. | |
Hardware Wallet Market Analysis by Mordor Intelligence
The hardware wallet market size is expected to increase from USD 0.54 billion in 2025 to USD 0.72 billion in 2026 and reach USD 2.25 billion by 2031, growing at a CAGR of 25.6% over 2026-2031. Robust growth reflects the structural swing toward self-custody after high-profile exchange failures, stricter custody rules under MiCA and United States banking guidance, and wider insurance coverage for devices certified to Evaluation Assurance Level 5 and above. Institutions are layering multi-signature governance on top of cold storage, while retail buyers flock to entry-level, near-field communication (NFC) card wallets that pair with smartphones. Post-quantum secure element chips that embed lattice-based algorithms have begun shipping, giving early adopters confidence that devices ordered today will remain compliant well into the next cryptographic era. Competition centers on user-experience upgrades such as larger screens, Bluetooth Low Energy connectivity, and app-based authenticity checks, even as audit teams continue to favour air-gapped workflows for treasury-scale balances.
Key Report Takeaways
- By connectivity, USB devices led with 45.21% revenue share in 2025, while Bluetooth-enabled wallets are projected to expand at a 26.0% CAGR through 2031.
- By wallet type, cold storage commanded 63.19% of 2025 revenue and is set to grow at a 26.2% CAGR to 2031.
- By end user, retail buyers accounted for 71.43% of sales in 2025, whereas institutional and enterprise demand is forecast to rise at a 26.9% CAGR over the period.
- By distribution channel, online platforms captured 59.72% of 2025 revenue, yet offline retail is expected to climb at a 26.7% CAGR to 2031.
- By geography, North America contributed 38.95% of global revenue in 2025, while the Middle East is projected to expand at a 26.5% CAGR through 2031.
Note: Market size and forecast figures in this report are generated using Mordor Intelligence’s proprietary estimation framework, updated with the latest available data and insights as of 2026.
Market Trends and Insights
Drivers Impact Analysis of Hardware Wallet Market*
| Driver | (~) % Impact on CAGR Forecast | Geographic Relevance | Impact Timeline |
|---|---|---|---|
| Intensifying Institutional Adoption of Self-Custody Solutions | +6.20% | Global, with concentration in North America and Europe | Medium term (2-4 years) |
| Surge in Cyber-Breach Publicity Pushing Demand for Offline Keys | +5.80% | Global | Short term (≤ 2 years) |
| Regulatory Push for Segregated Crypto Custody (MiCA, OCC) | +5.10% | Europe and North America, spillover to Middle East | Medium term (2-4 years) |
| Integration of Secure Element Chips with Post-Quantum Cryptography Support | +3.40% | Global, early adoption in North America and Europe | Long term (≥ 4 years) |
| Rising Demand for Multi-Signature Workflows in DAO Treasury Management | +2.90% | Global, strongest in North America and Asia-Pacific | Medium term (2-4 years) |
| Insurance Underwriters Providing Premium Rebates for Certified Hardware Wallets | +1.70% | North America and Europe | Short term (≤ 2 years) |
| Source: Mordor Intelligence | |||
Intensifying Institutional Adoption of Self-Custody Solutions
Corporate treasuries, family offices, and pension managers accelerated device procurement after the FTX collapse and the USD 1.5 billion Bybit breach, concluding that counterparty risk outweighs the convenience of exchange custody. Gnosis Safe disclosed that assets protected by hardware-backed multi-signature contracts topped USD 100 billion in 2025, confirming that multi-layer governance has become mainstream for decentralized autonomous organizations.[1]Gnosis Safe Team, “Multisig Treasury Management Metrics,” safe.global United States banks can custody crypto under Interpretive Letters 1170 and 1172, yet many institutions still prefer on-premises cold wallets to maintain total key control.[2]Office of the Comptroller of the Currency, “Interpretive Letter 1170 on Crypto Custody,” occ.gov In Europe, MiCA Article 76 obliges providers to segregate client assets, a requirement satisfied most easily with hardware-secured cold storage.[3]European Securities and Markets Authority, “Markets in Crypto-Assets Regulation (MiCA),” esma.europa.eu The January 2024 approval of spot Bitcoin exchange-traded funds hardened audit expectations, making Evaluation Assurance Level 5 certification the de facto baseline for enterprise purchases.
Surge In Cyber-Breach Publicity Pushing Demand for Offline Keys
Headline hacks remind buyers that internet-connected keys invite adversaries. The Bybit attack attributed to the Lazarus Group triggered a sales spike for fully air-gapped devices, as did the March 2024 compromise of Safe{Wallet}’s content delivery network. Vendors such as ELLIPAL and Keystone reported triple-digit order growth within weeks of each incident. Draft standards on post-quantum key encapsulation finalized by the Internet Engineering Task Force in 2024 gave manufacturers a clear implementation roadmap, further bolstering consumer confidence. Retail users also confront phishing campaigns that ship counterfeit devices, prompting them to verify holographic seals via manufacturer apps before first use.[4]Ledger, “Nano Gen5 Product Announcement,” ledger.com Altogether, publicity around breaches shortens the decision cycle for moving funds off exchanges and into cold storage.
Regulatory Push for Segregated Crypto Custody (MiCA, OCC)
MiCA’s broad custody rules became binding in December 2024, effectively forcing European service providers to isolate client holdings in dedicated wallets kept offline. The European Banking Authority later clarified that qualified custodians must employ hardware security modules or equivalent secure elements. In the United States, the Office of the Comptroller of the Currency has allowed national banks to enter the crypto custody business since 2020, yet boards increasingly stipulate device-level segregation to match fiduciary duties. Dubai’s Virtual Asset Regulatory Authority imposes similar requirements, catalysing regional demand. The United Kingdom, through its 2024 consultation, signalled intent to align with MiCA, reinforcing the global convergence around hardware-backed safeguards.
Integration Of Secure Element Chips with Post-Quantum Cryptography Support
SEALSQ’s QS7001 chip, certified to Common Criteria EAL6+, embeds lattice-based algorithms that align with National Institute of Standards and Technology selections, giving buyers confidence that their keys will resist quantum attacks beyond 2030. Trezor’s Safe 7 adopted a dual-chip architecture that brings the same quantum-ready posture to retail and institutional users. Forrester Research found fewer than 5% of installed wallets support post-quantum algorithms, suggesting a multi-year upgrade cycle. Draft hybrid key-exchange standards from the Internet Engineering Task Force provide firmware migration paths so users can toggle between classical elliptic-curve and lattice schemes without replacing hardware. Supply-chain delays at advanced fabs, however, may limit near-term availability of the newest chips, prolonging shortages as demand surges.
Restraints Impact Analysis of Hardware Wallet Market*
| Restraint | (~) % Impact on CAGR Forecast | Geographic Relevance | Impact Timeline |
|---|---|---|---|
| Persistent Consumer UX Complexity | -3.20% | Global | Short term (≤ 2 years) |
| Hardware Supply-Chain Shortages for Secure Elements | -2.70% | Global, acute in Asia-Pacific manufacturing hubs | Medium term (2-4 years) |
| Lack of Uniform Seed Phrase Recovery Standards Across Wallets | -1.90% | Global | Medium term (2-4 years) |
| Growing Secondary Grey-Market Reselling Increasing Counterfeit Risk | -1.40% | Global, concentrated in online marketplaces | Short term (≤ 2 years) |
| Source: Mordor Intelligence | |||
Persistent Consumer UX Complexity
First-time users still find seed-phrase backup, firmware updates, and address verification intimidating. Tangem’s screen-less card wallets simplify onboarding but expose buyers to blind-signing risk because transactions are confirmed only on a smartphone. Ledger’s Nano Gen5 improves readability through a larger display and Bluetooth pairing, yet users must still scroll full addresses before approving payments. Standards divergence compounds confusion: BIP39 and SLIP39 generate incompatible backups, so households with multiple brands juggle different recovery workflows. OpenZeppelin’s ERC-7913 aims to bridge non-EVM keys into Ethereum contracts, but adoption remains limited to advanced users. Until mainstream buyers see workflows as intuitive as mobile banking, adoption will trail the broader crypto ownership curve.
Hardware Supply-Chain Shortages for Secure Elements
Secure element lead times stretched beyond 26 weeks in 2024 as fabs prioritized automotive chips, and wallet manufacturers now pre-order 18 months ahead to ensure supply. Gray-market substitution is risky: IEEE studies show that one in ten off-catalogue chips fail authenticity tests, occasionally embedding hardware Trojans that compromise key secrecy. The European Chips Act earmarks EUR 80 billion for onshoring production, yet fresh capacity will not meaningfully arrive before 2027. Intel’s Arizona facility delay underscores how quickly reshoring timetables can slip. In the meantime, smaller vendors either accept downgraded chip grades that lack post-quantum support or risk stock-outs that cede share to incumbents with secured allocations.
*Our forecasts treat driver/restraint impacts as directional, not additive. The impact forecasts reflect baseline growth, mix effects, and variable interactions.
Hardware Wallet Market Segment Analysis
By Connectivity:
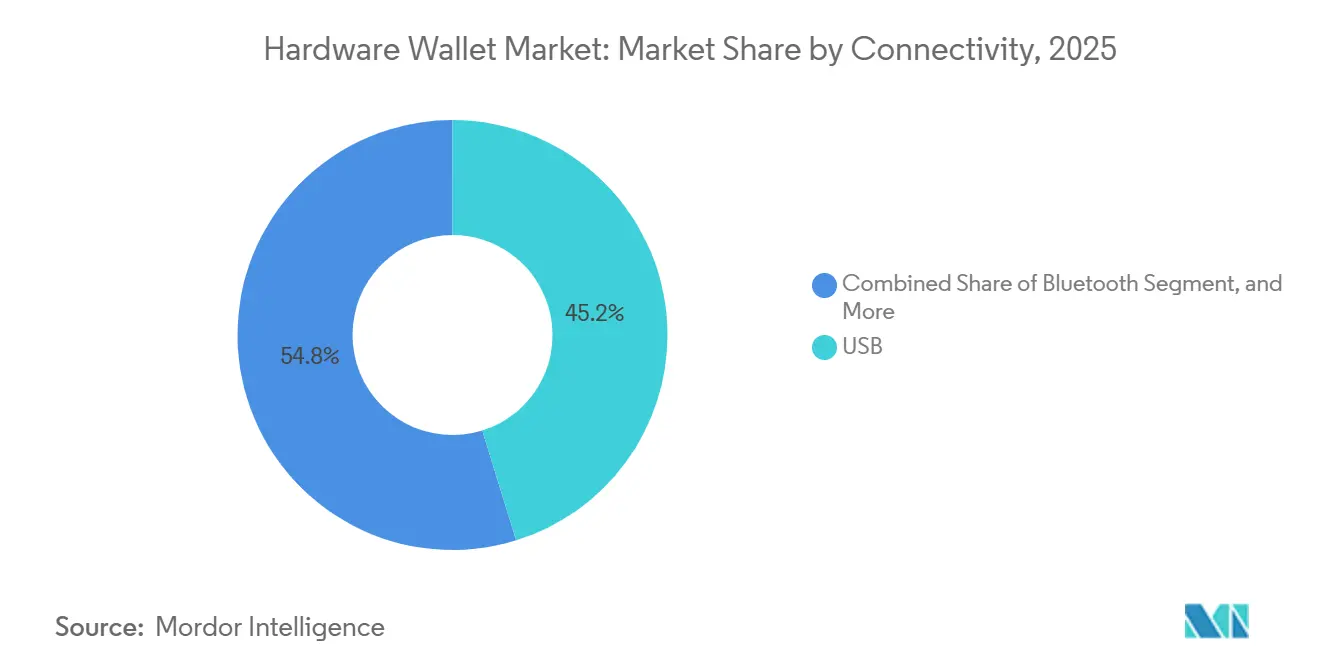
Bluetooth-Enabled Convenience Outpaces Wired SecurityUSB devices owned 45.21% of 2025 revenue, confirming their role as the audit-friendly default for enterprise signers who refuse any radios. Bluetooth wallets, however, are set to expand at a 26.0% CAGR through 2031, shrinking the USB lead as screen-on-device verification mitigates man-in-the-middle concerns. The hardware wallet market size advantage still belongs to wired models among financial institutions, yet retail buyers gravitate to Bluetooth because it pairs seamlessly with smartphones during in-person payments or decentralized-app interactions. Tangem’s NFC card bundle and Coinkite’s Coldcard Q illustrate a middle path, offering contactless signing that limits interception range. In contrast, QR-code air-gap products from Keystone and ELLIPAL isolate radio entirely, attracting high-net-worth users who trade speed for maximal security. Firmware for all connectivity types will soon integrate hybrid classical-and-lattice key exchange, and over-the-air updates may momentarily blur cold-storage purism, but adoption curves suggest Bluetooth will keep eroding USB share among mobile-first demographics.
USB remains indispensable for multi-signature treasury workflows because it leaves an immutable audit trail that satisfies Sarbanes-Oxley internal-control frameworks. Hardware wallet market share for USB will therefore stay overweight inside custodians, even as consumer-grade portfolios turn wireless. Near-term Bluetooth growth also hinges on the rollout of easier-to-navigate companion apps designed for grandfathered users who skipped prior crypto cycles. Overall, expect a bifurcated path: hardware wallet market Bluetooth shipments lead volume growth, while USB retains value density in the institutional core.



By Wallet Type:
Cold Storage Anchors Compliance-Driven DemandCold wallets captured 63.19% of 2025 sales thanks to strict segregation clauses under MiCA Article 76 and United States banking advisories. That dominance will persist with a 26.2% CAGR to 2031 because insurance carriers rebate premiums only when keys rest in Evaluation Assurance Level 5 or better secure elements. The hardware wallet market size for hot wallets remains modest, catering chiefly to decentralized-finance traders who need real-time signing. Yet each publicized exploit, such as the Bybit breach, widens the perceived risk premium on online keys. Devices like Ledger’s Nano Gen5 try to blend cold-wallet security with hot-wallet convenience by isolating keys in secure elements even during Bluetooth sessions, softening the boundary between categories.
Insurance carriers and compliance auditors continue to treat airgap as table stakes, so corporate treasurers still bulk-buy cold storage even when traders keep small balances in web extensions. Hardware wallet market share for cold storage may inch higher because regulatory language leaves little room for alternative interpretations. Looking forward, the mandatory adoption of post-quantum cryptography will likely trigger refresh cycles concentrated in the cold segment, given its longer retention horizons.
By End User:
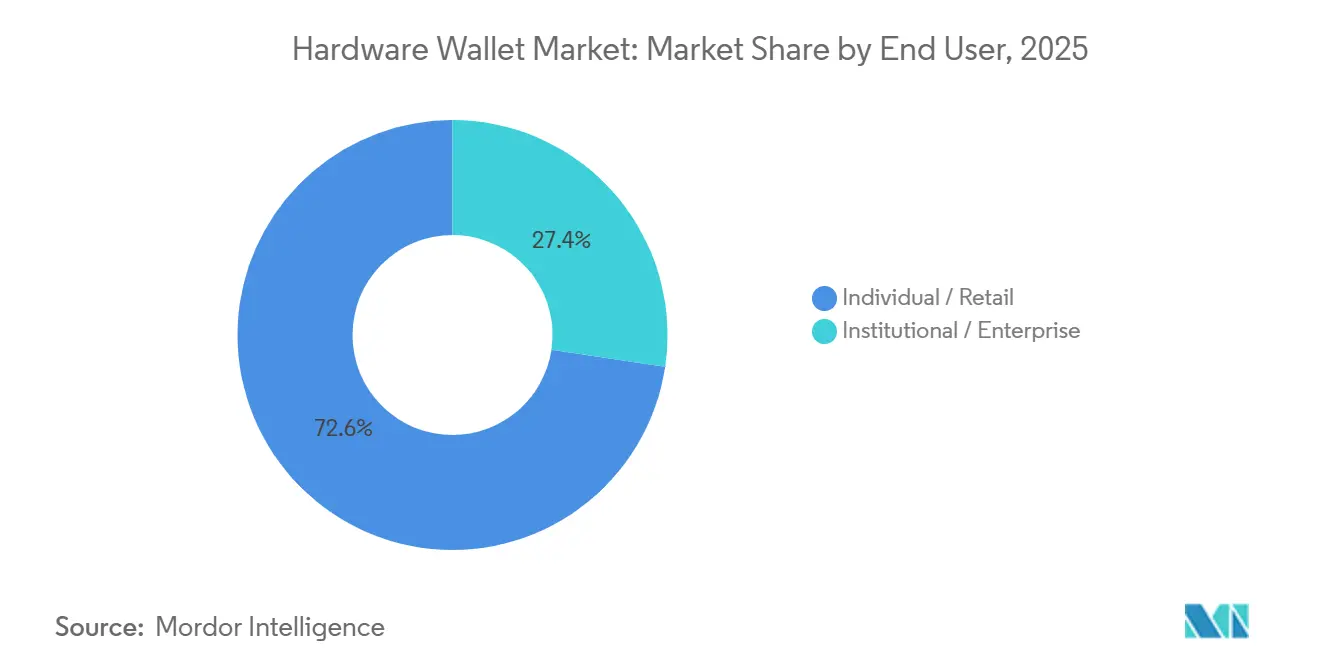
Enterprise Procurement AcceleratesRetail accounted for 71.43% of devices sold in 2025 as early adopters shifted savings off exchanges. The institutional cohort is now the fastest growing, posting a 26.9% CAGR forecast through 2031. Spot Bitcoin exchange-traded fund approvals hardened custody standards, cementing hardware wallets as the easiest route to satisfy Rule 38a-1 record-keeping. Enterprise orders also bundle dozens of units for multi-signature committees, so each sale represents higher average revenue. High-net-worth family offices are embracing Shamir-secret backups under SLIP39, while decentralized autonomous organizations write policy documents that enumerate specific device models for signers.
Retail demand tilts toward sub-USD 100 price points such as Tangem’s bundles or SafePal’s USD 99 S1 Pro, which deliver Bluetooth and touchscreen convenience with Evaluation Assurance Level 5 certification. Institutional procurement, in contrast, prioritizes Evaluation Assurance Level 6+ chips, redundant secure elements, and pending post-quantum firmware. As those buyers standardize on hardware, the hardware wallet market size delta between retail and institutional segments should narrow, though household volume will still dominate counts.
By Distribution Channel:
Offline Retail Rebuilds TrustOnline direct-to-consumer sites amassed 59.72% of 2025 revenue, but brick-and-mortar outlets in Dubai, São Paulo, and Johannesburg are on track for a 26.7% CAGR through 2031. Phishing attacks that shipped bogus devices via third-party marketplaces dented confidence in anonymous e-commerce. Physical stores let customers inspect security seals under staff guidance, and many emerging-market regulators now require in-country point-of-sale availability to simplify warranty claims. Manufacturers are experimenting with kiosk models inside electronics chains, both to fight counterfeiters and to tap walk-in traffic unfamiliar with crypto.
Global logistics efficiency still favours direct shipping in mature markets, so hybrid fulfilment is taking shape: flagship web stores handle firmware updates and customer support, while accredited retailers dominate first-time purchases in regions with low digital trust. The hardware wallet market share of offline retail therefore expands not at the expense of online, but as a complementary trust-layer in high-growth geographies.
Geography Analysis
North America Hardware Wallet Market
North America held 38.95% of global revenue in 2025, energized by early regulatory clarity from the Office of the Comptroller of the Currency and the Securities and Exchange Commission ETF approvals. Institutional asset managers insist on Evaluation Assurance Level 5 devices to pass audits, and decentralized-autonomous-organization treasuries headquartered in the United States represent a large share of assets inside multi-signature contracts. Canada’s prescriptive segregation framework, enforced by provincial regulators, brought small but steady retail inflows, while Mexico’s use case centers on remittance corridors that favour NFC card wallets for cross-border transfers. Combined, these trends anchor a high-value base that continues to spin off enterprise refresh orders each time post-quantum enhancements arrive.
Europe Hardware Wallet Market
Europe’s MiCA regime, fully live since December 2024, ignited a broad hardware replacement cycle as payment institutions upgraded custody stacks to meet Article 76 mandates. Germany issued 40 crypto-custody licenses that bind holders to cold storage, and France’s PSAN registry applies similar offline requirements. The European Banking Authority has suggested Evaluation Assurance Level 6+ as best practice, driving higher average device prices. The United Kingdom is aligning post-Brexit rules with MiCA, while Italy and Spain trail on retail penetration yet show institutional upticks via family-office allocations.
MEA Hardware Wallet Market
The Middle East will record the fastest regional CAGR at 26.5% through 2031, driven by sovereign funds in the United Arab Emirates and pending custody frameworks in Saudi Arabia. Dubai’s VARA licensing explicitly references secure key management, so local custodians place bulk orders for certified devices. Bahrain and Qatar have followed with similar directives, and high-net-worth individuals in the Gulf favour in-person purchases at upscale electronics boutiques. Africa’s market remains small but vibrant in South Africa and Nigeria, where hardware wallets solve currency-devaluation and capital-control headwinds.
APAC Hardware Wallet Market
Asia-Pacific features pockets of rapid adoption in Hong Kong and Singapore, each with full licensing that insists on segregated custody. Japan tightened exchange rules under its amended Payment Services Act, pushing sceptical retail holders toward self-custody. Australia’s ongoing regulatory consultations have not slowed hardware sales, as buyers hedge against policy uncertainty. India remains volatile due to taxation ambiguities, but household interest persists despite occasional exchange-shutdown rumours. Mainland China stays chilled by the 2021 trading ban, limiting regional upside.

Regulatory Landscape
Regulatory requirements increasingly distinguish custodial crypto service providers from non-custodial hardware wallet makers, influencing how products are positioned in Europe and other regulated markets. In the EU, Markets in Crypto-Assets Regulation (MiCA, Regulation (EU) 2023/1114) sets authorization and custody obligations for crypto-asset service providers, while non-custodial wallet providers where users retain sole control of private keys are not covered under MiCA. For EU-facing firms, compliance exposure rose again as the Transfer of Funds Regulation (TFR) became fully applicable to crypto-asset transfers on December 30, 2024, extending Travel Rule-style data collection to certain interactions with self-hosted wallets above defined thresholds.
In 2026, enforcement milestones tighten market access for regulated intermediaries and raise the bar for auditable, certified secure key management in institutional deployments. The UK brought into force the Reporting Cryptoasset Service Providers (Due Diligence and Reporting Requirements) Regulations 2025 on January 1, 2026, requiring due diligence and reporting to HMRC for in-scope cryptoasset service providers. In the EU, the end of MiCA transitional regimes (for example, Luxembourg CSSF noting expiry on July 1, 2026) requires non-authorized entities to stop onboarding and marketing, reinforcing demand for compliant custody stacks. For enterprise and government-aligned procurement, FIPS 140-3 validation via the NIST and Canadian Centre for Cyber Security Cryptographic Module Validation Program (CMVP) functions as a practical assurance anchor for cryptographic modules, supporting the use of hardware-root-of-trust components alongside hardware wallets in regulated environments.
Competitive Landscape
Competition is moderate. Ledger SAS and SatoshiLabs (Trezor) anchor mindshare, yet around 20 smaller brands contest niches on price, connectivity, or specialization. Ledger’s Nano Gen5, launched in October 2025 at USD 179, adds Bluetooth Low Energy and a larger screen to protect its installed base from the EUR 249 (USD 280) Trezor Safe 7 that boasts dual secure elements and quantum-ready firmware. Tangem’s USD 69.90 NFC card bundle set a new entry threshold, pressuring incumbents to justify premiums through expanded feature sets. Keystone and ELLIPAL lean into fully air-gapped architectures that appeal to security maximalists.
Technological differentiation now pivots around chip certification and post-quantum readiness. SEALSQ’s QS7001 and Trezor’s proprietary TROPIC01 are EAL6+ and embed lattice-based algorithms, years ahead of mainstream chipsets. Insurance carriers such as BitGo rebate 10-15% of premiums for clients that deploy EAL6 devices, nudging enterprise buyers toward the highest tiers. Counterfeit risk also shapes go-to-market strategy: Coinkite sells its Coldcard Q only from its own website, whereas Ledger and Trezor invest in holographic seals and smartphone authenticity apps.
Emerging disruptors like Foundation Devices (Passport) and Ngrave (Zero) specialize in open-source or biometric features that appeal to privacy-focused communities. The hardware wallet industry therefore straddles a continuum: mass-market makers chase usability, while boutique vendors focus on uncompromising security. Consolidation pressure has yet to appear, as brand loyalty remains strong and switching costs stay low relative to portfolio size.
Hardware Wallet Industry Leaders
Ledger SAS
ShapeShift AG
Coinkite Inc.
CoolBitX Technology Ltd.
SatoshiLabs s.r.o.
- *Disclaimer: Major Players sorted in no particular order
Hardware Wallet Market Companies Covered in this Report
- Ledger SAS
- SatoshiLabs s.r.o.
- ShapeShift AG
- Coinkite Inc.
- CoolBitX Technology Ltd.
- Shift Crypto AG
- Penta Security Systems Inc.
- SecuX Technology Inc.
- ARCHOS S.A.
- ELLIPAL Ltd.
- BitLox Limited
- SafePal Technology Ltd.
- Keystone (Cobo Technology Ltd.)
- OPOLO SARL
- zSofitto NV (Sugi)
- KeepKey LLC
- IoTrust Co., Ltd. (D’CENT)
- Prokey Technologies Co., Ltd.
- CryoBit LLC
- BC VAULT d.o.o.
- Tangem AG
- OneKey Technology Co., Ltd.

Market Opportunities and Future Outlook
Institutional self-custody programs are moving beyond standalone devices toward enterprise-grade signing and governance architectures, which creates room for vendors that combine cold-storage assurances with operational controls. In March 2026, Ledger launched an on-premise enterprise HSM offering that keeps signing infrastructure within customer data centers while maintaining governance and orchestration tooling, aligning with board-level expectations for segregation and internal controls in regulated procurement. At the same time, treasury-grade coordination features are increasingly being reflected at the hardware wallet layer, including Coinkite releasing a Key Teleport capability for Coldcard Q in July 2026 to support remote multisig coordination without reverting to exchange custody patterns.
Assurance signals for cryptographic modules also expand adjacent opportunities in hardware wallet ecosystems, particularly when buyers connect identity and authentication requirements to key management policy. Yubico secured FIPS 140-3 validations in 2026 for the YubiKey 5 FIPS Series and YubiHSM 2 FIPS, reinforcing procurement preferences for validated modules in high-assurance environments and supporting bundled workflows around secure authentication, policy enforcement, and offline signing. Regulatory clarity on what sits inside versus outside licensing regimes is also shaping go-to-market messaging and channels: after full MiCA enforcement in July 2026, Ledger publicly clarified that self-custody remains outside MiCA licensing for CASPs, strengthening demand for direct-to-consumer and enterprise self-custody implementations even as regulated service providers face tighter authorization and Travel Rule obligations. Product and firmware roadmaps that address quantum-risk management and post-quantum readiness are emerging as a second-order buying criterion for long-retention cold storage, supported by BitGo introducing quantum-risk management tools for multisig custody platforms in July 2026 and wider vendor investment in post-quantum capable stacks.
Recent Industry Developments in Hardware Wallet Market
- July 2026: Ledger updated its developer stack with post-quantum cryptography support and expanded Ledger Wallet capabilities. The update supports faster ecosystem readiness for quantum-risk discussions in long-retention cold storage and gives third-party applications a clearer path to adopt quantum-resistant primitives through a mainstream hardware wallet platform.
- May 2026: Trezor added stablecoin yield functionality in Trezor Suite for USDC and USDT on Ethereum using the Morpho protocol. By embedding DeFi flows in the companion app, Trezor pushed differentiation toward safer on-device confirmation while retaining access to on-chain yield use cases that historically stayed in browser wallets.
- June 2024: Ledger announced an integration with Crypto.com Pay to enable crypto purchases within the Ledger Live app. This streamlined a key onboarding step from acquisition to self-custody, supporting higher conversion from app users to hardware-secured key storage and reducing reliance on third-party browser workflows.


Hardware Wallet Market Report Scope and Research Methodology
Market Definition and Coverage
For this methodology, the hardware wallet market is the value of dedicated physical devices used to store and protect crypto private keys offline, including the device hardware sold through online and offline channels across major regions.
Scope exclusions: We exclude pure software wallets and custody-only services where no standalone hardware device is sold to the end user.
Segments Covered in This Report
- By Connectivity
- USB
- NFC
- Bluetooth
- Others, Connectivity
- By Wallet Type
- Hot Wallet
- Cold Wallet
- By End User
- Individual / Retail
- Institutional / Enterprise
- By Distribution Channel
- Online
- Offline
- By Geography
- North America
- United States
- Canada
- Mexico
- South America
- Brazil
- Argentina
- Chile
- Rest of South America
- Europe
- Germany
- United Kingdom
- France
- Italy
- Rest of Europe
- Asia-Pacific
- China
- Japan
- India
- Australia
- Rest of Asia-Pacific
- Middle East
- Saudi Arabia
- United Arab Emirates
- Rest of Middle East
- Africa
- South Africa
- Nigeria
- Rest of Africa
- North America
Data Sources, Market Sizing, and Validation
Desk Research
Desk research was used to build the fact base for a sizing model before we spoke with market participants. We reviewed public materials such as US SEC filings and annual reports of listed ecosystem firms, along with central bank and financial regulator releases on crypto asset rules and enforcement updates that influence self-custody behavior.
We also referenced non-paywalled sources such as World Bank macro indicators, UN Comtrade trade statistics for relevant electronics categories, USITC and EU tariff schedules, and academic and standards publications on secure elements and hardware security modules (these helped us understand typical bill-of-materials and security requirements). In addition, we scanned company websites, product documentation, and reputable press for device feature shifts (USB, Bluetooth, NFC) and for distribution patterns. Some company financials and news-intelligence databases were used to cross-check revenue direction and major event timelines. The sources listed here are illustrative, and we also used many other public references for data collection and clarification.
Primary Interviews and Surveys
Primary interviews and surveys were used to validate adoption drivers and the price-volume logic behind device shipments, especially where public shipment or revenue data is incomplete. We spoke with and surveyed device vendors, component and contract manufacturing contacts, distributors and retailers, and institutional user-side stakeholders across APAC, EMEA, and the Americas to confirm assumptions on average selling prices, replacement cycles, and channel mix.
Distribution of primary research fieldwork respondents
| Company type | Respondent position | Region |
|---|---|---|
| Top tier: 31% | CXOs: 14% | APAC: 45% |
| Mid tier: 51% | Functional/Unit leaders: 42% | EMEA: 35% |
| Smaller Players: 18% | Managers: 44% | Americas: 20% |
Market-Sizing & Forecasting
The model starts with a top-down build where the addressable demand pool is reconstructed using regional crypto participation signals, self-custody preference shifts after major exchange events, and channel availability indicators, then it is translated into device volumes and value through observed price bands. To keep the output grounded in practical volumes, we corroborate it with selective bottom-up approximations such as sampled online and offline channel checks, vendor revenue direction, and an ASP times estimated units sanity check, and we use those checks to adjust outliers.
Key inputs that fed the model included average selling price ranges by connectivity format (USB, Bluetooth, NFC), device replacement and upgrade cycles, retail versus institutional purchase mix, the share of multi-asset users who tend to buy cold storage, and region-level regulatory clarity that affects self-custody intent. When a data point was missing for a smaller geography, we used proxy ratios from comparable markets and then pressure-tested them using interview feedback.
For forecasting, we used scenario analysis supported by a simple multivariate regression overlay. In that layer, unit demand sensitivity was linked to crypto market participation, macro risk sentiment, and the pace of regulatory approvals for crypto products. Assumptions on pricing were stepped by expected product refresh cycles and cost trends in secure components, then reviewed again with primary respondents so we avoid a single overly aggressive or conservative path.
Data Validation & Update Cycle
Outputs were checked in several passes to keep the estimates tied to real-world signals. We compared the implied units and ASPs against observed product pricing, channel availability, and independent market activity indicators, then reviewed any sharp jumps that did not fit the adoption narrative for a given region.
Before sign-off, the work is reviewed by another analyst who re-checks formulas, currency conversions, and year alignment. Any large variances trigger a re-contact with select interviewees to confirm the assumption that caused the swing. The report is refreshed annually, and material events such as a major regulatory change or a meaningful product shift are assessed for interim updates. Right before delivery, we run a final pass to ensure the latest public signals are reflected in the model.
Mordor Intelligence's Hardware Wallet Market Sizing Compared With Other Published Estimates
Published market values for hardware wallets often differ because teams do not always count the same revenue streams, and they can anchor their calculations to different base years. The spread is usually driven by whether devices sold through resellers are fully treated in the topline, whether institutional bulk purchases are captured, and how price erosion versus premium feature pricing is carried forward.
In this study, the gap mostly comes from keeping the value limited to standalone hardware device sales and aligning the 2026 starting point to the same connectivity and channel scope across regions, a choice applied by Mordor Intelligence.
Benchmark comparison
| Source | Market Size | Gaps in Research Methodology |
|---|---|---|
| Mordor Intelligence | USD 0.72 B (2026) | |
| Global Publisher A | USD 0.36 B (2024) | Uses an earlier base year and can undercount offline retail and reseller-led sales in some regions, which pulls down the starting value even if the long-run CAGR is high. |
| Industry Publisher B | USD 0.39 B (2024) | States a readjusted forecast approach and may apply a faster adoption curve and higher blended ASPs, especially if professional and business demand is weighted more heavily. |
Taken together, the table shows that year selection and scope rules explain most of the difference, not just the growth rate. By tying the model to clear device-only revenue, practical ASP bands, and channel and end-user checks, the estimate stays traceable to inputs that a client team can revisit and update as market conditions change.


Key Questions Answered in the Report
How fast is the hardware wallet market expected to grow between 2026 and 2031?
It is projected to advance at a 25.6% CAGR, expanding from USD 0.72 billion in 2026 to USD 2.25 billion by 2031.
Which connectivity option is gaining share the quickest?
Bluetooth-enabled devices lead growth with a forecast 26.0% CAGR through 2031.
Why are cold wallets preferred by institutions?
Regulatory segregation mandates and insurance discounts require offline key storage certified at Evaluation Assurance Level 5 or higher.
What regions will post the fastest demand increase?
The Middle East is forecast to record a 26.5% CAGR as new licensing regimes mandate secure custody.
How are vendors preparing for quantum computing risks?
Leading makers like Trezor and SEALSQ embed lattice-based algorithms in EAL6+ secure elements to meet post-quantum standards.
What is the main obstacle to wider retail adoption?
Onboarding complexity, from seed-phrase backup to firmware updates, still deters first-time users despite recent UX improvements.
Page last updated on:


 Your data is secure and never sold or shared.


