
Market Overview
| Study Period | 2020 - 2031 |
|---|---|
| Forecast Data Period | 2026 - 2031 |
| Base Year Market Size (2025) | 11.25 gigawatt |
| Market Volume (2026) | 12.64 gigawatt |
| Market Volume (2031) | 22.66 gigawatt |
| Growth Rate (2026 - 2031) | 12.37 % |
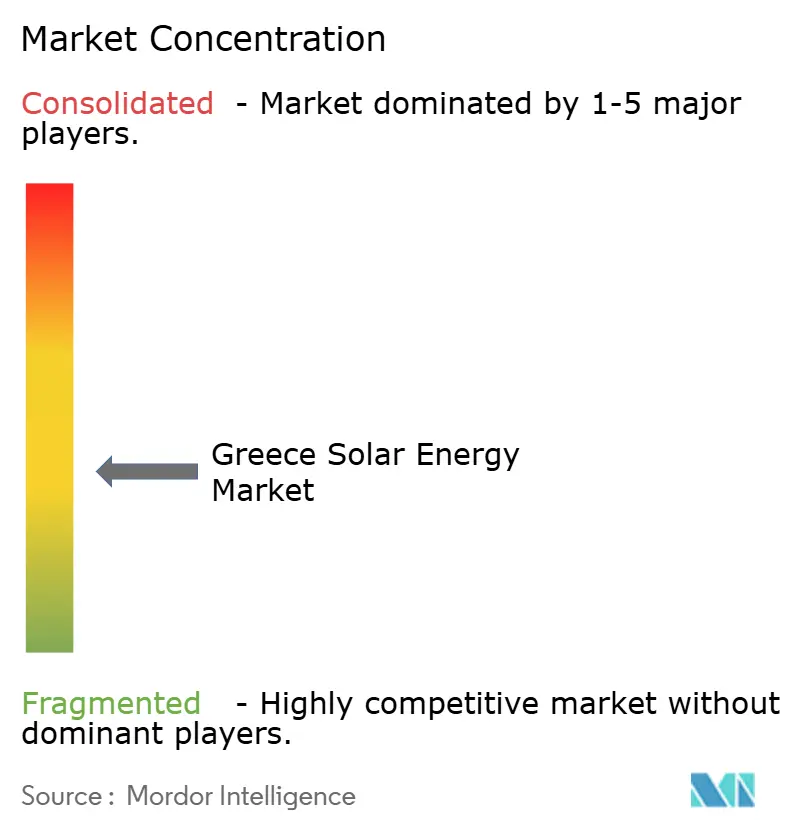
| Market Concentration | Medium |
Major Players *Disclaimer: Major Players sorted in no particular order Image © Mordor Intelligence. Reuse requires attribution under CC BY 4.0. | |
Greece Solar Energy Market Analysis by Mordor Intelligence
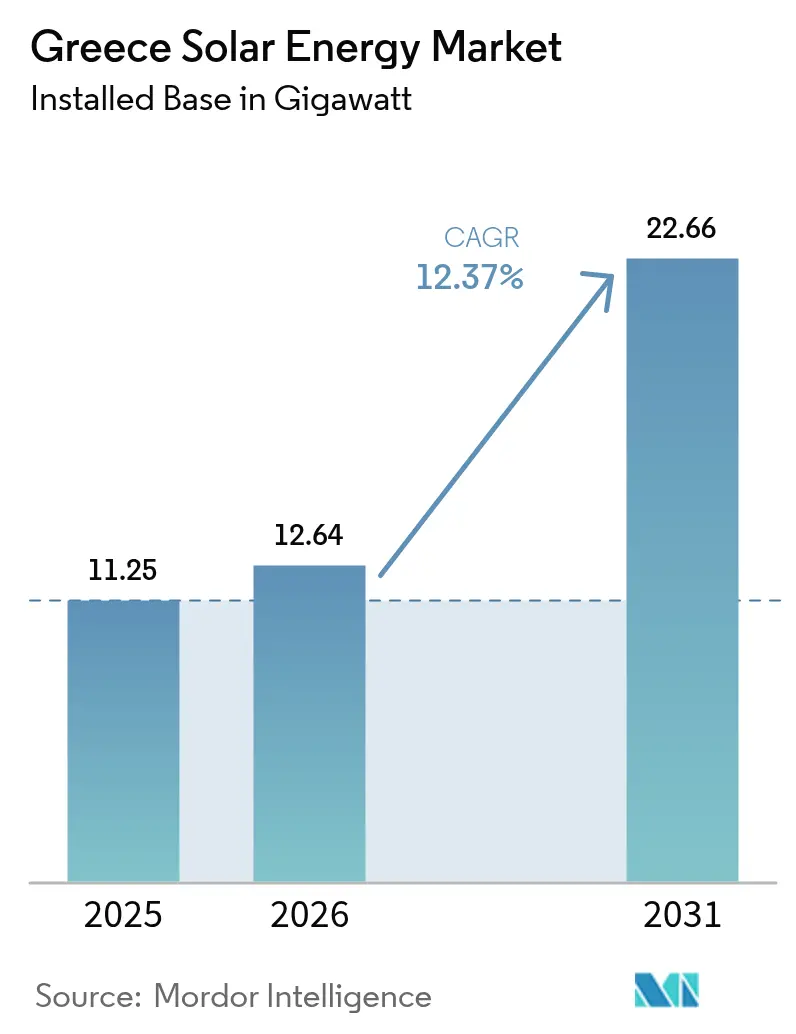
Greece Solar Energy Market size in 2026 is estimated at 12.64 gigawatt, growing from 2025 value of 11.25 gigawatt with 2031 projections showing 22.66 gigawatt, growing at 12.37% CAGR over 2026-2031.
Three structural shifts underpin this outlook: an 82% renewable electricity mandate in the revised National Energy and Climate Plan (NECP), a sharp decline in European module prices to EUR 0.10/Wp in Q3 2024, and the Independent Power Transmission Operator’s (IPTO) EUR 5.5 billion grid expansion program through 2034.[1]IPTO, “Ten-Year Network Development Plan 2024-2034,” ipto.gr As falling capital costs coincide with curtailment risks, developers pairing solar with battery storage or long-term power-purchase agreements (PPAs) capture stable returns, while merchant projects face declining capture rates during midday price troughs. The lignite phase-out by 2028 frees roughly 4 GW of capacity, positioning ex-mining regions in Western Macedonia for solar-plus-storage redevelopment financed by EU Recovery and Resilience Facility grants. Foreign capital is accelerating the build-out. Masdar’s EUR 3.2 billion acquisition of TERNA Energy in 2024 highlights Gulf investors’ appetite, and institutional lenders, such as the European Investment Bank (EIB), are offering sub-4% debt for auction-backed projects.
Key Report Takeaways
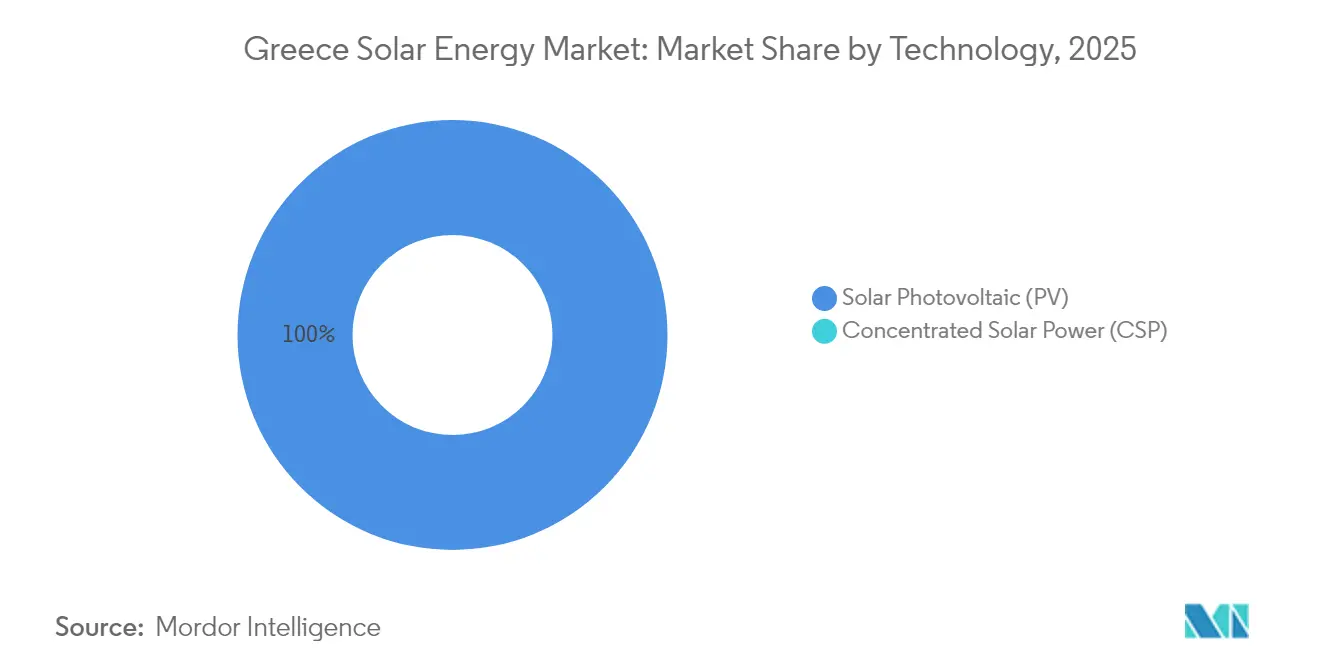
- By technology, solar photovoltaics held 100.00% of Greece solar energy market share in 2025 and will compound at a 12.37% CAGR through 2031.
- By connection type, on-grid projects commanded 95.40% of installed capacity in 2025, while off-grid systems will grow at 13.00% CAGR as island interconnections progress.
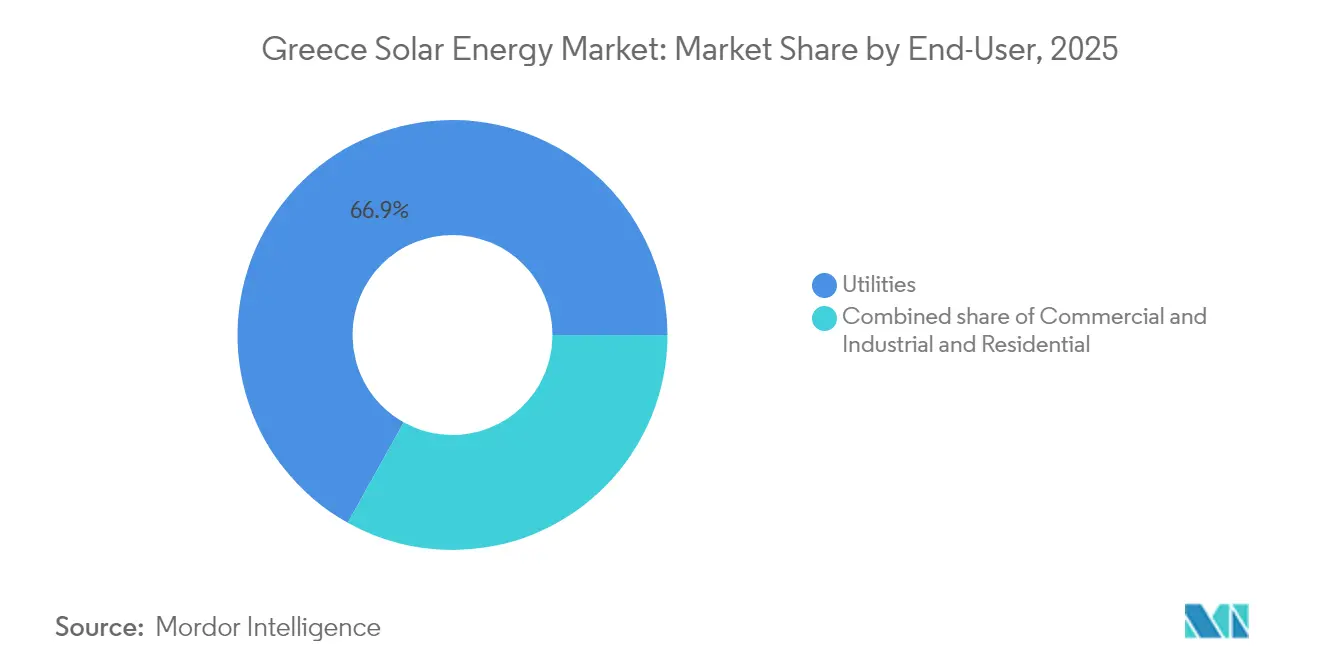
- By end user, utilities led with 66.90% share of the Greece solar energy market size in 2025; the residential segment is projected to expand at 15.26% CAGR to 2031.
Note: Market size and forecast figures in this report are generated using Mordor Intelligence’s proprietary estimation framework, updated with the latest available data and insights as of 2026.
Greece Solar Energy Market Trends and Insights
Drivers Impact Analysis*
| Driver | (~) % Impact on CAGR Forecast | Geographic Relevance | Impact Timeline |
|---|---|---|---|
| NECP-driven 2030 targets | 3.50% | National; priority zones in Western Macedonia & Crete | Medium term (2-4 years) |
| EU & national auction/FiP support | 2.80% | National; former lignite regions | Short term (≤ 2 years) |
| Rapid module CAPEX decline | 2.20% | National; all scales | Short term (≤ 2 years) |
| Corporate PPA momentum | 1.50% | Attica & Thessaloniki industrial belts | Medium term (2-4 years) |
| PV-plus-storage synergies | 1.80% | High-curtailment zones | Medium term (2-4 years) |
| Agrivoltaic pilots | 0.80% | Thessaly & Central Macedonia | Long term (≥ 4 years) |
| Source: Mordor Intelligence | |||
NECP-Driven 2030 Renewable Targets
The 2023 NECP revision requires 82% renewable electricity by 2030 and targets 13.4 GW of solar, nearly double the 7.1 GW installed by the end of 2023. Lignite retirement in 2028 unlocks grid capacity and EU transition funding; Meton Energy’s 940 MW Amynteo cluster secured EUR 127.7 million of NextGenerationEU grants and reached financial close early 2024. Binding EU regulations mean deployment delays could trigger infringement penalties, offering downside protection for investors.
EU & National Auction/FiP Support
Competitive auctions replaced feed-in tariffs, cutting strike prices and granting revenue certainty. Law 5095/2024 awards super-priority interconnection to PPA-backed projects, creating a two-tier market. Between 2023 and 2024, three storage tenders were allotted 700 MW with indexed premiums. Meanwhile, the EIB lent EUR 390 million to DEPA Commercial for an 800 MW solar pipeline at sub-4% rates.[2]EIB Communications, “EIB Backs 800 MW DEPA Solar Portfolio,” eib.org
Rapid Module CAPEX Decline
European module prices fell to EUR 0.10/Wp in Q3 2024, driving utility-scale CAPEX down to EUR 600-700/kW and enabling auction bids below EUR 50/MWh with equity IRRs exceeding 8%. Residential system costs dropped to EUR 1,200-1,500/kWp, sustaining rooftop viability despite the shift to net billing.
Corporate PPA Momentum
Law 5037/2023 unlocked direct PPAs; contracted capacity reached 0.95 GW by end-2023. Meton Energy secured 10-year PPAs for the Amynteo cluster, and EDF signed multi-year deals with Axpo. Industrial users hedged against December 2023 power prices of EUR 0.24/kWh.
Restraints Impact Analysis*
| Restraint | (~) % Impact on CAGR Forecast | Geographic Relevance | Impact Timeline |
|---|---|---|---|
| Grid congestion & curtailment | −2.5% | Central Macedonia, Peloponnese, Crete | Short term (≤ 2 years) |
| Policy volatility (net-metering shift) | −1.2% | Residential & small C&I nationwide | Short term (≤ 2 years) |
| Social push-back on farmland | −0.8% | Thessaly, Central Macedonia, Peloponnese | Medium term (2-4 years) |
| Price-cannibalization risk | −1.0% | Merchant projects nationwide | Medium term (2-4 years) |
| Source: Mordor Intelligence | |||
Grid Congestion & Curtailments
IPTO curtailed 900 GWh of renewables in 2024 and temporarily disconnected the entire fleet in May 2024 to stabilize the grid. High-voltage direct-current links to Crete (expected to be live by mid-2025) and the Dodecanese (due by 2028) will ease regional bottlenecks; however, developers without storage face 50% revenue caps on curtailment clauses.
Policy Volatility: Net-Billing Transition
Law 5106/2024 replaced net metering with net billing, reducing the value of rooftop solar by 15-20%. A four-month policy gap stalled installations until the EUR 250 million “Photovoltaic at Home” subsidy relaunched demand, yet payback periods stretched to 8-10 years.[3] PV Magazine, “Net-Billing Transition Dampens Rooftop Momentum,” pv-magazine.com
*Our forecasts treat driver/restraint impacts as directional, not additive. The impact forecasts reflect baseline growth, mix effects, and variable interactions.
Segment Analysis
By Technology: PV Dominance underpinned by bifacial roll-out
The Greek solar energy market is primarily photovoltaic, with solar PV holding 100.00% of the Greek solar energy market share and forecasted to replicate the overall 12.37% CAGR to 2031. Large parks are increasingly specifying bifacial, TOPCon, or heterojunction modules rated above 600 W to reduce balance-of-system costs. Heterojunction adoption is expected to accelerate once local-content incentives under the EU Net-Zero Industry Act are implemented, although 98% of 2024 modules were Chinese imports, reflecting the lowest-cost sourcing. Perovskite-silicon tandem cells remain laboratory curiosities, while Brite Solar's pilot line positions Greece on the advanced-module map.
Rapid module deflation is driving Greece's solar energy market size additions toward utility-scale clusters exceeding 50 MW, where EUR 600-700/kW CAPEX enables bids below EUR 50/MWh. Developers such as Juwi Hellas locked in 204 MW of bifacial supply from JinkoSolar to exploit Greece's high albedo soils. Concentrated solar power (CSP) remains underutilized in Greece due to the country's fragmented geography and relatively modest direct-normal irradiance, which tends to disfavor thermal technologies.



By Grid Type: Grid-tied pipeline outpaces island microgrids
On-grid projects represented 95.40% of the Greek solar energy market in 2025 and are expanding at a 12.85% CAGR, buoyed by IPTO’s interconnection agenda. The Great Sea Interconnector, scheduled to be live in mid-2025, will connect Crete’s 500 MW of diesel-backed solar power to the national grid, thereby erasing its prior off-grid status. Similar dynamics will play out in the Dodecanese once the 1 GW link comes online in 2028.
Off-grid microgrids remain a niche market, accounting for only 4.60% of total capacity. Tilos Island’s 800 kW PV-plus-2.4 MWh battery showcases autonomy where submarine links are uneconomic. Yet, as more islands connect, off-grid demand will shift toward agriculture, remote telecom, and tourism eco-resorts that require energy independence.
By End-User: Residential surge complements utility dominance
Utilities controlled 66.90% of the installed capacity in 2025, driving Greece's solar energy market growth through gigawatt-scale clusters in Western Macedonia and Central Greece. Residential rooftops, although smaller in absolute terms, clock the fastest 15.26% CAGR on the back of a EUR 250 million subsidy and the streamlined Law 5106/2024 permitting.
Commercial and industrial (C&I) users, exposed to EUR 0.24/kWh power tariffs in late 2023, build on-site PV and sign sleeved PPAs to hedge price volatility. Athens International Airport's move to 100% on-site solar-plus-storage exemplifies cost parity with grid electricity. Energy communities pool multiple rooftops, holding 14 MW in 2023 with 50 MW in permitting, bridging household ownership barriers.
Geography Analysis
Central Macedonia anchors the pipeline, led by Meton Energy’s 940 MW Amynteo cluster that captured EUR 127.7 million in EU funds. Former lignite mines expedite permitting and enjoy social acceptance as coal jobs sunset. Thessaly offers top irradiation but faces land conflicts; local bans have sidelined ~300 MW despite strong grid proximity.
The Peloponnese benefits from low population density and ample substations, allowing projects such as Juwi’s 160 MW park across Fthiotida and Larissa to advance with minimal resistance. Western Macedonia’s transition zones replicate the Amynteo template, packaging EU grants with accelerated access to the grid.
Crete’s mid-2025 interconnection halves curtailment risk and unlocks 500 MW of pipeline solar-plus-storage assets. The Dodecanese high-voltage link, budgeted at EUR 1.42 billion, is expected to integrate Rhodes and Kos by 2028, freeing up a further 300-400 MW. Smaller islands, such as Tilos, prove the viability of microgrids, while IPTO’s EUR 5.5 billion plan will reinforce mainland nodes that feed Attica’s demand corridor.
A feasibility study by IPTO and Saudi Arabia’s National Grid examines a submarine link to export excess solar to Middle Eastern markets after 2035, hinting at cross-border revenue options once domestic saturation emerges.
Regulatory Landscape
Greece’s solar regulatory framework is anchored by RAAEY oversight of energy market rules and RES frameworks, with licensing and permitting handled through the Ministry of Environment and Energy (YPEN). Recent reforms aim to speed up execution while tightening siting constraints. Law 5299/2026, published May 5, 2026, introduces Renewable Energy Acceleration Areas (REAAs) and binding timelines for key licensing milestones, which should improve project predictability for developers that secure compliant sites and grid access.
In parallel, YPEN opened a public consultation in May 2026 for a revised Special Spatial Framework for Renewable Energy Sources. The proposal adds horizontal exclusions that restrict solar in sensitive areas, including NATURA 2000 zones and other protected categories, and it introduces additional screening requirements, such as visual-impact studies near cultural and historic assets. For distributed generation, the Photovoltaics on the Roof program is governed by Joint Ministerial Decision YPEN/DAPEEK/52494/954/2026 (published May 18, 2026), supporting rooftop deployment under defined eligibility and implementation rules as the market adjusts to the post-net-metering environment.
Competitive Landscape
The top five players hold roughly 40-45% of operating and near-term capacity, giving the Greece solar energy market a moderate concentration. Masdar’s full buy-out of TERNA Energy in 2025 installs a deep-pocketed owner targeting a 3 GW build-out by 2028. PPC Renewables, Mytilineos, and Meton Energy leverage balance-sheet strength to self-finance projects and lock priority grid slots.
Smaller developers shift to a build-and-flip model: Juwi Hellas offloaded 267 MW of rights to Foresight and Mirova while retaining EPC and O&M roles. International entrants Ecoener, Canadian Solar, and EDF Renewables have committed > EUR 1 billion since 2024, lured by auction clarity and EIB debt.
Technology differentiation centers on bifacial modules, single-axis trackers, and battery co-location. Bank lenders now demand Tier-1 module suppliers with investment-grade balance sheets and 25-year performance guarantees, weeding out distressed Chinese manufacturers. Local disruptor Brite Solar scales semi-transparent modules for agrivoltaics, tapping into demand from farmers who resist ground-mount arrays.
Greece Solar Energy Industry Leaders
PPC Renewables SA
TERNA Energy SA
Mytilineos Energy & Metals SA (METKA EGN)
Hellenic Petroleum Renewable Energy Sources SA
RWE Renewables Greece (Meton Energy)
- *Disclaimer: Major Players sorted in no particular order

Market Opportunities and Future Outlook
Utility-scale solar continues to open whitespace in Greece through mine-site repurposing and cluster-style development, where land availability, permitting familiarity, and existing grid corridors can reduce execution friction. This is visible in northern Greece, where PPC Group completed a 2.13 GW solar PV portfolio in April 2026, and in Western Macedonia, where RWE and PPC reported completion of a 930 MW solar cluster in July 2026. Those build-outs expand demand for EPC, O&M, component supply, and hybridization solutions designed to manage curtailment and price-capture risk, with storage increasingly treated as part of the bankability toolkit rather than only an add-on.
At the policy and program level, Law 5299/2026 and the introduction of Renewable Energy Acceleration Areas (REAAs) create an investable pathway for projects positioned in eligible zones and aligned with binding administrative timelines. The May 2026 draft Special Spatial Framework for RES further shifts opportunity toward better-screened land banks, agrivoltaic-compatible concepts, rooftops, and engineered brownfield sites through new exclusion zones and a land-coverage cap at the regional-unit level. On distributed generation, the May 2026 Photovoltaics on the Roofs program, alongside the refocusing of Greece 2.0 recovery funding toward smaller-scale installations, supports demand for residential and farm rooftops, while net billing increases the emphasis on self-consumption designs, energy management, and storage-ready configurations.
Recent Industry Developments
- July 2026: RWE and PPC completed a 930 MW solar cluster in Greece, aggregating multiple solar farms developed through their Meton Energy vehicle. The completion highlights the pace of utility PV build-out on repurposed lignite-mining land and raises expectations for contractors and suppliers supporting multi-site, common-infrastructure delivery models.
- May 2025: PPC Renewables began phase 2 construction of its 490 MW Western Macedonia portfolio, supported by Recovery and Resilience Facility funding and a 15-year PPA with the Hellenic Market Operator. The construction start strengthened bankable revenue structures for large parks as underwriting increasingly reflected merchant exposure and curtailment clause risk.
- November 2024: Masdar completed the acquisition of TERNA Energy, establishing it as a key platform for Masdar’s renewables expansion across Southeastern and Central Europe. The transaction increased competitive intensity for Greek solar development by combining a local pipeline and operating base with the balance sheet to fund large-scale build-outs and pursue further consolidation.


Research Methodology Framework and Report Scope
Market Definition and Coverage
This market is defined as Greece's solar power installed capacity connected to the electricity system, counted in gigawatts, and covering new additions and the cumulative installed base across utility and behind-the-meter deployment.
Scope exclusions: off-grid solar used in isolated applications and solar thermal heating are excluded when they are not measurable as grid-connected electricity generation capacity.
Segmentation Overview
- By Technology
- Solar Photovoltaic (PV)
- Concentrated Solar Power (CSP)
- By Grid Type
- On-Grid
- Off-Grid
- By End-User
- Utilities
- Commercial and Industrial (C&I)
- Residential
- By Component (Qualitative Analysis)
- Solar Modules/Panels
- Inverters (String, Central, Micro)
- Mounting and Tracking Systems
- Balance-of-System and Electricals
- Energy Storage and Hybrid Integration
Data Sources, Market Sizing, and Validation
Desk Research
Desk research was used to build the factual backbone for capacity levels, policy context, and grid conditions in Greece. We relied on public energy statistics and regulatory releases to track installed PV capacity, annual additions, grid connection rules, and auction or permitting changes that can shift the yearly commissioning run rate.
Key public sources referenced included IEA country energy statistics, IRENA renewable capacity datasets, Eurostat energy balances, updates from the Hellenic transmission system operator and distribution operator, and publications from the Greek ministry and regulator on targets and licensing. Company annual reports, investor decks, and reputable press were reviewed to cross-check project pipeline detail and commissioning timing. In addition, a paid subscription focused on company financials, and a patent database, was used selectively to confirm company activity and technology direction. These examples are not exhaustive, and other sources were also reviewed for data collection, validation, and clarification.
Primary Interviews and Surveys
Interviews and surveys conducted in Greece cover developers, installers, utilities, distributors, and public-sector energy specialists. Respondents help clarify annual additions, connection timing, technology mix, pricing, curtailment, and policy assumptions. Their input also helps fill evidence gaps and reconcile the final model with local project conditions.
Distribution of primary research fieldwork respondents
| Company type | Respondent position |
|---|---|
| Top tier: 29% | CXOs: 15% |
| Mid tier: 46% | Functional/Unit leaders: 30% |
| Smaller Players: 25% | Managers: 55% |
Market-Sizing & Forecasting
Sizing is built mainly from a top-down capacity reconstruction, where national capacity time series and grid-connection signals are used to map the installed base year by year, then extend it through the forecast window. After the capacity path is formed, we check it with selective bottom-up approximations, such as rolling up a sample of announced and under-construction projects by expected commissioning year, and then adjusting for slippage where supporting evidence is limited.
Inputs used in the model include cumulative installed PV capacity, annual capacity additions, expected auction and corporate PPA activity that influences utility-scale buildout, grid connection availability and curtailment risk, and the pace of permitting and licensing reforms. For forecasting, scenario analysis is applied around grid and policy constraints, then the central case is refined using short time-series smoothing on annual additions so the curve does not overreact to a single unusual year. Where project-level visibility is incomplete, gaps are handled by applying historical conversion rates from pipeline to commissioned capacity, as supported by interview feedback, before totals are finalized.
Data Validation & Update Cycle
Validation is done through cross-checks that link the capacity model to independent signals, including grid operator connection updates, national and EU capacity datasets, and observed commissioning patterns from market participants. When outputs show unusual jumps, we review the drivers, revisit assumptions, and trigger follow-up calls to confirm whether the shift is tied to policy changes, grid constraints, or commissioning timing.
Internally, a multi-step review is followed so calculations, units, and year labeling stay consistent across the historical period and forecast. Reports are refreshed annually, with interim updates when material events occur, and a final pre-delivery review is completed so clients receive the most current view available at the time of publication.
Mordor Intelligence's Greece Solar Energy Market Size Versus Other Published Estimates
Published market sizes for Greece solar often differ because some sources track the installed base, others focus on yearly additions, and some convert the scope into investment value, which changes both the unit and the boundary. Differences also appear when one publisher counts only PV connected to the main grid, while another blends in broader solar categories.
Grid-connection updates and cumulative capacity checkpoints are the evidence used to keep Mordor Intelligence's 2025 estimate aligned to what is actually operating in-country, rather than to early-stage pipeline announcements. Gaps usually come from how commissioning dates are treated, whether behind-the-meter systems are captured consistently, and whether the reported figure represents capacity at year-end versus an average across the year, which can shift totals in years with fast buildout.
Benchmark comparison
| Source | Market Size | Gaps in Research Methodology |
|---|---|---|
| Mordor Intelligence | USD 11.25 B (2025) | |
| Industry Marketplace A | USD 6.77 B (2025) | Uses an installed-base figure that appears to reflect a narrower capture of connected capacity and may undercount recent commissioning, especially if year-end additions are not fully reflected. |
| Independent Publisher B | USD 1.80 B (2026) | Reports the market in monetary terms, which depends on capex and pricing assumptions, mix of utility versus rooftop systems, and inflation or currency timing, so it will not reconcile to a capacity-based size. |
The table shows that the biggest spread is explained by unit choice and by how each source treats what is actually connected versus what is planned. By keeping the scope anchored on operating capacity and then sanity-checking the path with project timing and grid constraints, the estimate stays easier to reproduce and interpret for planning.


Key Questions Answered in the Report
How large is installed photovoltaic capacity in Greece in 2026?
The Greece solar energy market size totaled 12.64 GW of installed PV capacity in 2026.
What annual growth rate is forecast for Greek solar from 2026-2031?
Installed capacity is projected to expand at a 12.37% CAGR, reaching 22.66 GW by 2031.
Which segment is growing fastest through 2031?
Residential rooftops, supported by the “Photovoltaic at Home” subsidy, are set to grow at 15.26% CAGR.
How is grid congestion being addressed?
IPTO is investing EUR 5.5 billion in transmission upgrades, including high-voltage links to Crete (operational) and the Dodecanese (due 2028).
Why are PPAs attractive for Greek industrials?
PPAs offer price certainty below the EUR 0.24/kWh industrial tariff recorded in late 2023, hedging volatility while meeting decarbonization goals.
What is Greece’s target for battery storage?
The standalone battery energy storage target was raised to 3.55 GW in 2025, backed by €1 billion of approved state aid.
Page last updated on:


 Your data is secure and never sold or shared.


