
Market Overview
| Study Period | 2021 - 2031 |
|---|---|
| Forecast Data Period | 2026 - 2031 |
| Base Year Market Size (2025) | 23.5 gigawatt |
| Market Volume (2026) | 27.25 gigawatt |
| Market Volume (2031) | 57.1 gigawatt |
| Growth Rate (2026 - 2031) | 15.95 % |
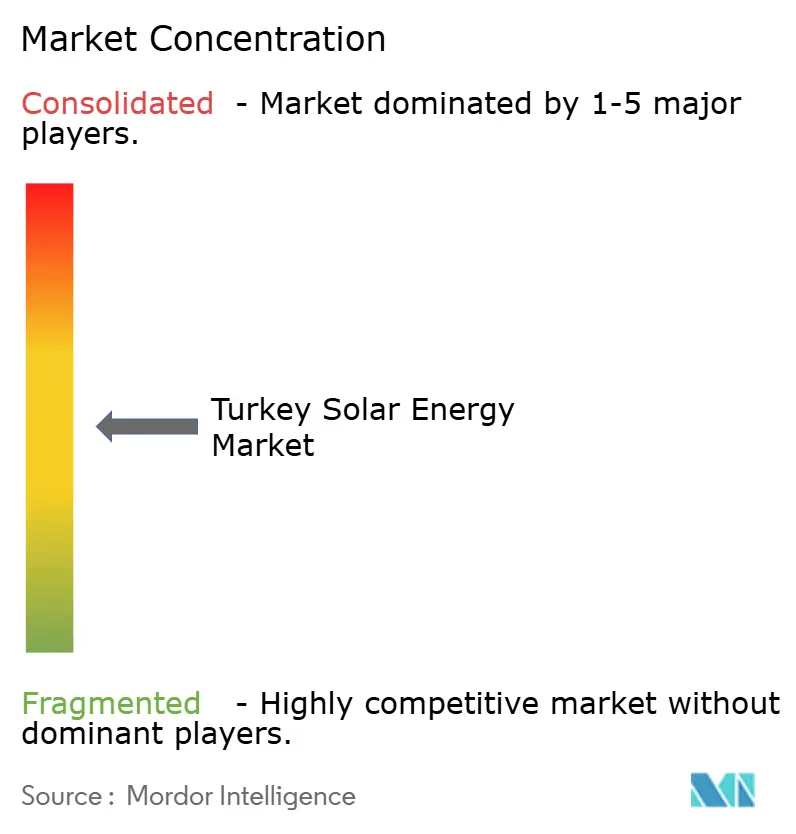
| Market Concentration | Medium |
Major Players *Disclaimer: Major Players sorted in no particular order Image © Mordor Intelligence. Reuse requires attribution under CC BY 4.0. | |
Turkey Solar Energy Market Analysis by Mordor Intelligence
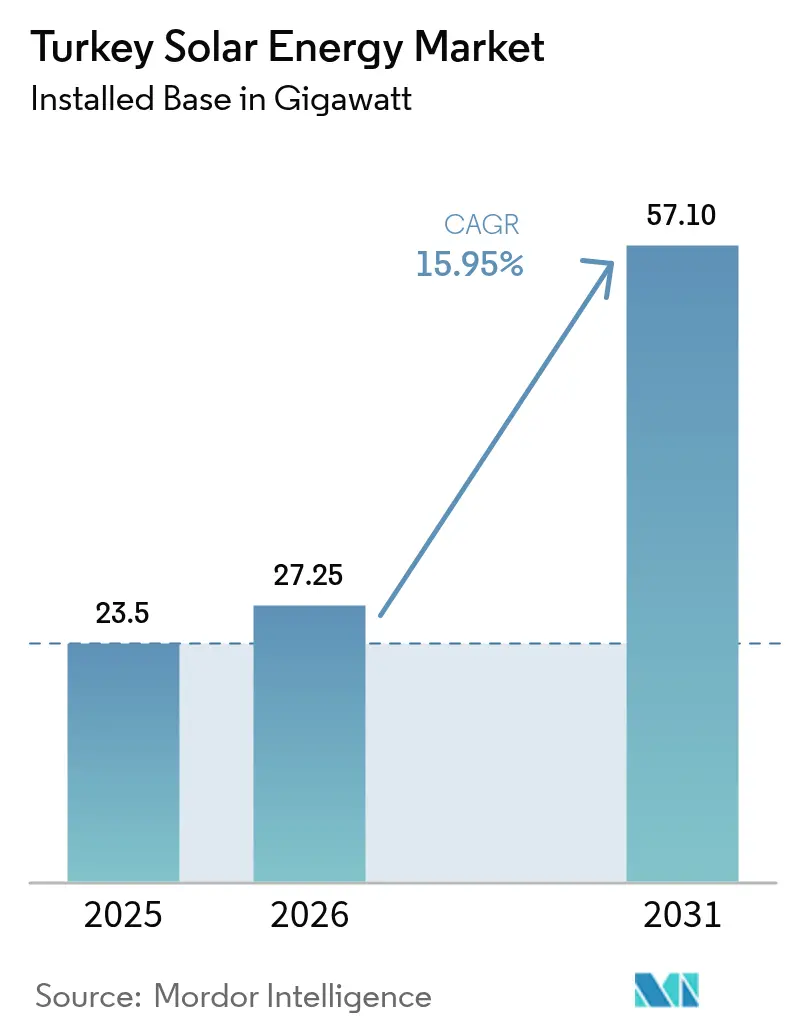
The Turkey Solar Energy Market size was valued at 23.5 gigawatt in 2025 and estimated to grow from 27.25 gigawatt in 2026 to reach 57.1 gigawatt by 2031, at a CAGR of 15.95% during the forecast period (2026-2031).
Annual additions accelerate as levelized solar electricity costs drop below USD 70/MWh, placing new plants at cost parity with imported natural gas and hard coal. Streamlined “super permit” rules now allow utility projects to be released within 24 months instead of 48, reducing development risk premiums and unlocking cheaper project financing. Turkey’s strong 7.2 daily solar-hour resource still operates under capacity compared to regional peers, leaving a significant runway for new installations that will anchor the Turkish solar energy market in the wider Eastern Mediterranean power mix. At the same time, local cell and module factories backed by USD 2.5 billion of new investment reduce import exposure and shelter project economics from TRY–USD swings.
Competitive pressure grows as exporters face looming EU Carbon Border Adjustment Mechanism fees, driving industrial buyers toward long-term solar PPAs and accelerating distributed generation uptake in Istanbul, Ankara, and Izmir. Grid-connected systems retain the lion’s share of new builds, yet rising curtailment in Konya and Antalya highlights the urgency of transmission upgrades and flexible resources. Net-metering and simplified licensing sustain the rooftop wave, particularly for installations under 5 MW, which now close payback periods within seven years. As these forces combine, the Turkey solar energy market is positioned for measured but durable growth through the decade.
Key Report Takeaways
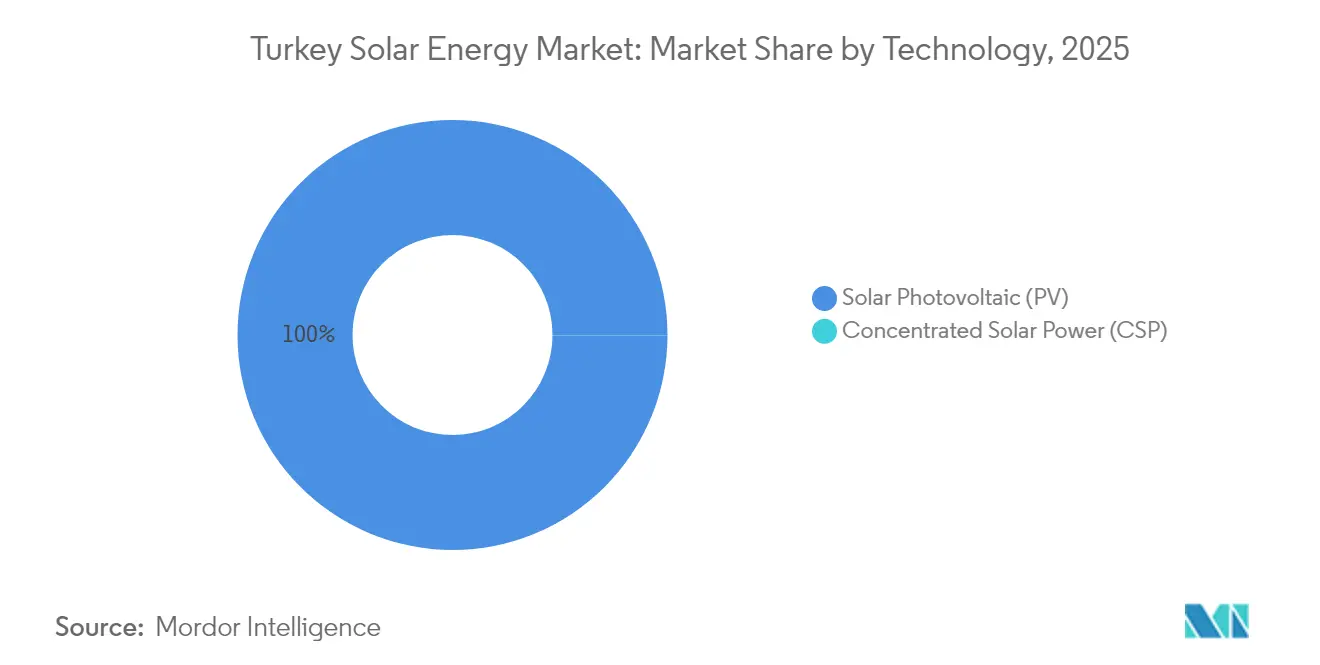
- By technology, Solar Photovoltaic secured 99.98% of Turkey's solar energy market share in 2025, while Concentrated Solar Power posted a high 112.9% CAGR off an almost zero base.
- By grid type, On-Grid systems accounted for 90.25% of the Turkish solar energy market size in 2025; Off-Grid capacity is expected to expand at a 16.9% CAGR through 2031.
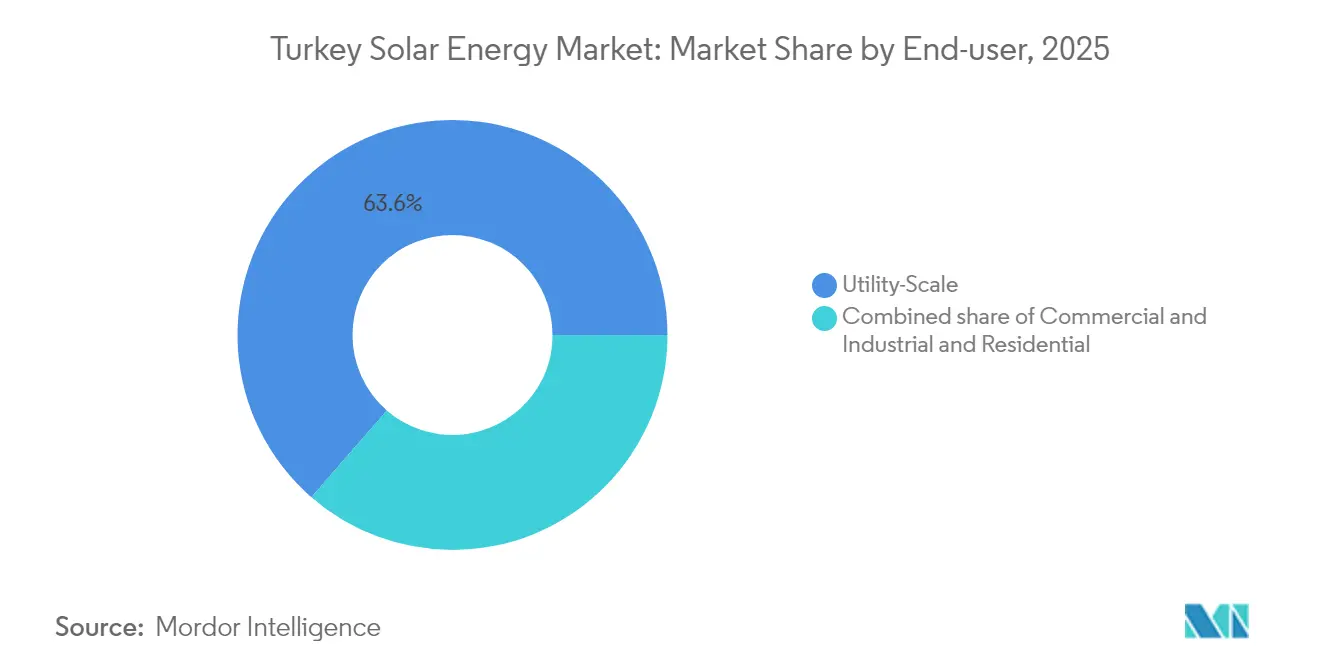
- By end user, Utility-scale plants held 63.60% of installed capacity in 2025, whereas Residential rooftops are advancing at a 19.7% CAGR through 2031.
- By province, Konya led with 1,350 MW operational in 2025, and the southern cluster is projected to capture 51.20% of new additions through 2031.
- Kalyon PV, Zorlu Enerji, and Astronergy together delivered 29% of 2024 utility-scale capacity, underscoring a moderately concentrated developer pool.
Note: Market size and forecast figures in this report are generated using Mordor Intelligence’s proprietary estimation framework, updated with the latest available data and insights as of 2026.
Turkey Solar Energy Market Trends and Insights
Drivers Impact Analysis*
| Driver | (~) % Impact on CAGR Forecast | Geographic Relevance | Impact Timeline |
|---|---|---|---|
| Net-metering expansion & rooftop mandate roll-outs | +2.1% | National, with early gains in Istanbul, Ankara, Izmir | Medium term (2-4 years) |
| Declining levelised cost of PV electricity (LCOE) in Turkey | +2.8% | National, concentrated in high-solar southern provinces | Short term (≤ 2 years) |
| Green hydrogen pilots anchoring utility-scale PPAs | +1.4% | Southern Turkey, Konya and Antalya provinces | Long term (≥ 4 years) |
| EU Carbon Border Adjustment Mechanism (CBAM) accelerating export-oriented PV adoption | +1.6% | Western Turkey, export-oriented industrial zones | Medium term (2-4 years) |
| "Made-in-Türkiye" module incentive scheme (Yerli Üretim Belgesi) | +1.9% | National, with manufacturing hubs in Manisa, Kayseri | Medium term (2-4 years) |
| Source: Mordor Intelligence | |||
Net-metering expansion and rooftop mandate roll-outs
Monthly net-metering credits enable homes and factories to sell surplus power, reducing payback times to below seven years. Rooftop potential equals 120 GW, or three times the 2030 capacity target.[1]Ember, “Türkiye can expand solar by 120 GW through rooftops,” ember-energy.org Installations under 5 MW see faster licensing, which boosts small EPC activity in Istanbul and Ankara. Distribution firms flag voltage swings at midday, yet smart inverters ease the strain. The government plans digital meters nationwide, a move that supports broader bidirectional flows. These factors collectively expand the customer base of the Turkish solar energy market.
Declining LCOE of PV electricity
Utility bids are now clearing below USD 70/MWh, matching imported gas and coal prices. Module prices decline as local fabs scale, while low-cost financing reduces the weighted cost of capital. Southern provinces average 7.2 sun-hours daily, lifting capacity-factor economics. Storage prices fall too, making hybrid arrays viable for factories with evening loads. As a result, developers lock in long PPAs that underpin the Turkey solar energy market size through the decade.
Green-hydrogen pilots anchoring utility-scale PPAs
Biga Hydrogen opened a 400 MW electrolyzer line tied to a 1.5 MW solar plant. Steel and cement firms study similar setups that swap gas heat for hydrogen. Solar developers gain 20-year offtake certainty, which lowers lender risk premiums. Co-location also trims grid fees and transmission losses. Yet high electrolyzer costs cap near-term volumes, keeping growth modest until scale brings prices down.
“Made-in-Türkiye” module incentive scheme
Feed-in bonuses add up to TRY 1.3/kWh for Turkish panels and TRY 0.8/kWh for local inverters. Astronergy and four local partners commit USD 2.5 billion to new cell lines, targeting an annual output of 10 GW.[2]PV Tech, “Astronergy, four Turkish PV manufacturers to invest USD 2.5 billion in solar cell plants,” pv-tech.org Local supply cuts FX exposure and shortens lead times for EPC firms. Antidumping duties on select imports further protect price floors. Together, these levers secure input costs and bolster the domestic manufacturers' share of the Turkey solar energy market.
Restraints Impact Analysis*
| Restraint | (~) % Impact on CAGR Forecast | Geographic Relevance | Impact Timeline |
|---|---|---|---|
| Grid curtailment caps in high-solar provinces | -1.8% | Southern Turkey, Konya, Antalya, Mersin provinces | Short term (≤ 2 years) |
| TRY-USD FX volatility squeezing imported balance-of-system costs | -2.1% | National, particularly affecting imported component costs | Medium term (2-4 years) |
| Slow permitting for land acquisition in agricultural zones | -1.2% | Central and southern Turkey agricultural regions | Medium term (2-4 years) |
| Source: Mordor Intelligence | |||
Grid-curtailment caps in high-solar provinces
Rapid PV build-outs now press the 400 kV backbone, and curtailment averages 4% in Konya, climbing to 7% on clear spring days.[3]International Energy Agency, “Renewable Energy Market Update – June 2023,” iea.org The transmission operator applies hourly caps that slice merchant revenues and unsettle lenders. Developers respond with inverter oversizing, battery add-ons, and staggered energization schedules; however, these fixes increase project capital expenditures and temper near-term additions. Grid-reinforcement plans promise a new south-north corridor by 2027, yet until then, curtailment will trim the Turkey solar energy market's CAGR.
TRY-USD volatility squeezing imported balance-of-system costs
The lira’s 15% slide in 2024 lifted prices for inverters, trackers, and cables that still rely on overseas supply. Although the YEKDEM tariff adjusts quarterly, FX swings complicate loan servicing and insurance covenants. To hedge, larger EPC groups price PPAs in euros or buy forward contracts, strategies out of reach for many small installers. Local content rules partially offset the shock, yet domestic factories cannot meet the total demand for power electronics. The result is a modest drag on the Turkey solar energy market growth curve through 2027.
*Our forecasts treat driver/restraint impacts as directional, not additive. The impact forecasts reflect baseline growth, mix effects, and variable interactions.
Segment Analysis
By Technology: PV Dominance Sustains, CSP Remains Niche
Solar Photovoltaic installations captured 99.98% of 2025 capacity, while Concentrated Solar Power lingered at 0.02%. PV’s cost edge is clear: the Karapinar complex delivers electricity at USD 69.9/MWh, whereas no commercial CSP bid has met the YEKA price ceiling. Consequently, PV additions are expected to average 2.9 GW annually, keeping the Turkey solar energy market size firmly PV-centric. CSP’s 112.9% CAGR reflects pilot-scale projects, such as a proposed 20 MW hybrid tower in Mersin; yet, even full build-out leaves CSP with a share below 1% by 2031.
Domestic manufacturers channel the USD 2.5 billion cell-fab investment into n-type modules that cross 24% efficiency, cutting land use per megawatt. EPC firms also favor bifacial and single-axis tracker combinations, which boost yield by 15–20% in southern provinces. CSP, in contrast, faces high water demand and limited local engineering expertise, so developers adopt a wait-and-see approach. Still, grid-stability debates could revive interest in thermal-storage-rich CSP after 2028.



By Grid Type: On-Grid Projects Lead, Off-Grid Finds Niches
On-grid plants accounted for 90.25% of installations in 2025, mirroring the country's push for centrally dispatched renewables. Their 15.85% CAGR keeps pace with national demand growth, ensuring the on-grid slice of Turkey's solar energy market share stays above 88% through 2031. Net-metered rooftops feed surplus into local feeders, while utility parks sign 15-year feed-in deals under YEKA.
Off-grid arrays serve telecom towers, border posts, and eco-tourism resorts where grid links would exceed USD 1 million per kilometer. Falling lithium-iron-phosphate battery prices shorten the payback period, yet the segment grows from a small base, adding roughly 50 MW per year. Hybrid kits that switch between islanded and grid-tied modes blur category lines and could boost off-grid uptake in northern Black Sea villages that frequently experience storm outages.
By End User: Utility Still Commands, Residential Accelerates
Utility-scale facilities held 63.60% of installed power in 2025 thanks to multi-hundred-megawatt YEKA rounds. They attract export-credit financing, which locks borrowing costs below 6% and maintains robust margins even at flat tariffs. However, rooftop households logged the fastest 19.7% CAGR, aided by simple e-permitting that now approves sub-10 kW kits within five days. If that pace holds, residential rooftops will supply 7% of the nation's solar output by 2031, thereby expanding the Turkey solar energy market share for distributed assets.
Commercial-and-industrial rooftops straddle both worlds. Textile plants in Bursa install 5 MW systems to shave peak tariffs and earn CBAM credits, while logistics centers near Izmir deploy car-park canopies coupled with 2 MWh batteries for backup. As storage rules mature, C&I owners may trade flexibility services, turning private arrays into micro-balancing resources for the main grid.
Geography Analysis
Turkey's southern corridor accounts for 51.28% of the country's installed capacity, equivalent to 12.05 GW, or just over half of the Turkish solar energy market size in 2025. Konya alone hosts 1.35 GW at Karapinar and secures another 900 MW in late-stage permitting, while Antalya and Mersin each surpass 1 GW of cumulative arrays. These provinces average more than 1,600 kWh/m² of annual irradiation, enabling capacity factors near 23% and keeping levelized costs among the lowest in the country. Curtailment risk is highest here, yet grid-reinforcement plans that add 1.8 GW of south-north transfer capacity by 2027 safeguard future buildouts.
Western Turkey, including Istanbul, Ankara, and Izmir, holds 6.95 GW, or 29.57% of total installations, a share that is expected to rise to 13.9 GW by 2031 as rooftops expand across densely industrialized areas. This region records the fastest 12.2% CAGR among all clusters, aided by euro-linked corporate PPAs that hedge Carbon Border Adjustment Mechanism fees. Net-metered households and small factories can contribute up to 15% of the local midday load on sunny days, prompting distribution companies to pilot smart inverter settings that ride through reverse power events. High urban land prices spur creative use of car-park canopies and building-integrated modules, widening access for space-constrained customers.
Eastern and southeastern Anatolia contribute just 4.5 GW, or 19.15% of Turkey's solar energy market share, yet house the nation's largest uncommitted land bank. Low population density facilitates site aggregation for parks exceeding 50 MW, and agrivoltaic pilots near Diyarbakır demonstrate that maize yields remain intact under elevated solar trackers. Transmission remains the hurdle; only 220 kV lines serve much of the plateau, capping the immediate government's potential. The government's 2030 grid blueprint allocates TRY 34 billion for double-circuit upgrades, positioning the region as a medium-term growth frontier once these links come online.
Regulatory Landscape
Turkey's solar buildout operates under the Electricity Market Law No. 6446, with the Energy Market Regulatory Authority (EPDK) overseeing licensing and market rules. Large, utility-scale allocations continue to be channeled through the Renewable Energy Resource Zones (YEKA) framework (regulated under the 2016 YEKA Regulation), which structures long-term offtake and tender conditions for grid-connected projects.
In 2026, policy actions tightened the linkage between grid-connection availability and new capacity awards. In February 2026, EPDK Board Decision No. 14353 opened a new 3,500 MW window for unlicensed generation projects (1,500 MW at transmission-level connections and 2,000 MW at distribution-level connections), supporting self-consumption and net-metering-style investments. In July 2026, the Ministry of Energy and Natural Resources announced YEKA GES-2026, a program covering 14 solar tenders totaling 900 MW across provinces including Ankara, Konya, and Diyarbakir, reinforcing YEKA as the core route for scaled project awards.
Competitive Landscape
Turkey’s utility-scale segment is moderately concentrated, with the top five developers accounting for 61% of the additions in 2024, resulting in a mid-level rivalry profile for the sector. Kalyon PV leads with vertically integrated wafers-to-modules capability and 2.2 GW operating or under construction, followed by Zorlu Enerji’s 1.1 GW of mixed solar-wind assets. Astronergy’s USD 2.5 billion joint venture secures 10 GW of annual cell output, anchoring domestic supply and reducing foreign-exchange exposure for local EPC partners. These first-tier players are increasingly bundling storage to win YEKA auctions, which now demand dispatchable profiles.
International equipment suppliers widen technology choice. Huawei, SMA Solar Technology, and Fronius together ship more than 60% of central and string inverters, competing on grid-support firmware and 10-year service wraps. PVH and Nextracker sign multiyear steel-frame deals with Turkish fabricators, localizing 70% of tracker content to capture Yerli Üretim bonuses. Storage entrants, led by Sungrow and CATL, target hybrid solar tenders expected in 2026, while domestic integrators such as İnform Elektronik are ready with containerized battery packages compatible with Turkey’s frequency-control market.
Below 5 MW, fragmentation reigns: over 600 licensed installers vie for rooftop and car-park contracts across 81 provinces. Consolidation is gathering pace as rising bond yields squeeze working capital, prompting smaller EPC shops to merge or pivot toward O&M niches. Digital-twin software and drone-based thermography are emerging as differentiation tools for service firms courting asset managers, who now oversee 15-year performance guarantees. As local banks tighten debt terms, developers with proven execution histories and strong foreign-currency revenues gain a distinct cost-of-capital edge, reinforcing a gradual move toward larger, integrated groups.
Turkey Solar Energy Industry Leaders
Kalyon PV
Smart Solar
HT Solar Energy
CW Enerji
Ankara Solar A.Ş.
- *Disclaimer: Major Players sorted in no particular order

Market Opportunities and Future Outlook
Hybridization and flexibility are a near-term whitespace as curtailment pressure rises in high-solar provinces (notably Konya and Antalya) and system operators seek dispatchable profiles in competitive procurement. A concrete reference point is the commissioning of a storage-integrated plant in January 2026, when Oze Grup energized a major hybrid project in Sivrihisar (Eskisehir), pairing 49.2 MWp of PV with a 34.1 MWh battery and creating a bankable benchmark for engineering, interconnection practices, and performance contracting for solar-plus-storage in Turkey.
At the utility scale, the YEKA pipeline provides recurring auction volume and a visible route to market for developers and equipment suppliers. The unlicensed generation window also expands the addressable market for commercial and industrial rooftops and behind-the-meter assets. Installed solar capacity reaching 26,899 MW by May 2026 shows continued absorption capacity across EPCs, distributors, and O&M providers. International capital and turnkey capability further reinforce entry points through February 2026 investment agreements involving Acwa Power for 2,000 MW of solar plants in Sivas and the Karaman Taseli region, alongside the July 2026 YEKA GES-2026 rollout (900 MW across 14 projects).
Recent Industry Developments
- May 2026: Kalyon PV commissioned and opened its G12R TOPCONPlus solar cell production line in Ankara, lifting total cell capacity from 1 GW per year to 2.1 GW per year. The development increases domestic availability of higher-efficiency cell technology and supports project developers seeking shorter lead times and reduced foreign-exchange exposure for core PV components.
- January 2025: HT Solar Energy introduced flexible solar panels and positioned it as the first mass production of this technology in Turkey. Expanding into flexible formats broadens addressable demand beyond conventional rooftops, including lightweight industrial roofs and specialty applications where standard glass-glass modules are constrained.
- May 2024: GE Vernova signed a contract with Kalyon PV to supply FLEXINVERTER solar power station technology for a 157 MW solar project. The deal underlines continued reliance on bankable grid-interface and inverter-platform capabilities for larger plants, particularly as grid-code compliance and operational stability become more prominent in high-penetration regions.


Research Methodology Framework and Report Scope
Market Definition and Coverage
For this study, the Turkey solar energy market is measured as the installed solar power capacity added and operating in the country, expressed in gigawatts. It covers grid connected and off grid solar installations across major end users, and it reflects commissioning rather than project announcements.
Scope exclusions: We exclude broader power generation assets and non solar renewables, and we also exclude upstream polysilicon and module manufacturing revenues that do not translate into installed capacity in Turkey.
Segmentation Overview
- By Technology
- Solar Photovoltaic (PV)
- Concentrated Solar Power (CSP)
- By Grid Type
- On-Grid
- Off-Grid
- By End-user
- Utility-Scale
- Commercial and Industrial (C&I)
- Residential
- By Component (Qualitative Analysis)
- Solar Modules/Panels
- Inverters (String, Central, Micro)
- Mounting and Tracking Systems
- Balance-of-System and Electricals
- Energy Storage and Hybrid Integration
Data Sources, Market Sizing, and Validation
Desk Research
Desk work starts with building a clean historical backbone for solar in Turkey, then aligning it with policy signals and grid context so the model inputs make sense. We mainly review official energy statistics and grid publications, such as releases from the national energy authority, transmission operator grid connection data, and capacity tables published through public portals.
To keep assumptions realistic, we also scan sources such as IEA and IRENA country datasets, World Bank macro indicators, and customs and trade statistics where equipment movement signals are useful. Company annual reports, investor presentations, and credible press coverage are then used to cross check commissioning timelines, auction outcomes, and typical project sizes. In addition, we used paid subscriptions for company financials and intelligence, news and financials, and patent database checks where it helped validate activity levels and technology choices. The sources listed here are illustrative only, and many other public documents were also used for data collection, validation, and clarification.
Primary Interviews and Surveys
Primary work was used to test what the desk signals could not fully explain, especially around how quickly projects move from permit to grid connection and how rooftop adoption changes with financing and regulation in Turkey. We spoke with a mix of developers, EPC and component channel participants, utilities and grid related experts, and large commercial buyers, and then we used follow up questions to tighten the inputs that drive the final capacity build.
Coverage was kept Turkey wide so regional permitting, land availability, and substation constraints were not missed, which is where market totals can drift if one area is over weighted.
Distribution of primary research fieldwork respondents
| Company type | Respondent position |
|---|---|
| Top tier: 28% | CXOs: 13% |
| Mid tier: 57% | Functional/Unit leaders: 31% |
| Smaller Players: 15% | Managers: 56% |
Market-Sizing & Forecasting
Sizing is built mainly through a top down capacity reconstruction, where national installed base, annual additions, and grid connection pipelines are translated into a consistent installed GW series by year. Once the headline totals are set, they are checked using selective bottom up approximations, such as sampled project counts by size band, typical MW per site for utility and rooftop systems, and channel feedback on shipment to commissioning lags, which are then used to adjust any overstatement.
A few practical inputs keep the model anchored, including annual installed capacity additions, announced versus connected project conversion rates, policy driven quotas and licensing timelines, grid connection availability by region, and typical capacity factors that influence build appetite. When gaps appear in smaller scale additions, the missing piece is estimated using permitted rooftop volumes and installer throughput, and it is subsequently tested in interviews.
For forecasting, we lean on scenario analysis with a base case informed by expert consensus on permitting pace, grid upgrade timing, and expected cost trends for modules and inverters. The final outlook is kept reproducible by documenting each assumption, and by only using indicators that can be refreshed every year without relying on inaccessible internal datasets.
Data Validation & Update Cycle
Outputs are validated in several steps so odd spikes do not pass through unchecked. We compare the modeled additions with independent signals like grid interconnection updates, public commissioning announcements, and macro drivers such as electricity demand growth and renewable policy targets in Turkey, and then we rework the inputs when the story does not line up.
Before sign off, another analyst reviews the calculations, checks year on year movements, and tests sensitivity for the few assumptions that move the forecast the most. If large variances appear versus recent permitting data or major policy changes, experts are re contacted and the model is refreshed. Reports are updated annually, with interim updates when material events occur, and a final pre delivery pass is completed so the view reflects the latest available data.
Mordor Intelligence's Turkey Solar Energy Market Size Versus Other Published Estimates
Published estimates for Turkey solar energy rarely match perfectly because each publisher counts a different thing and sometimes even uses a different unit. Some focus on installed capacity in gigawatts, while others translate activity into revenue, which can shift quickly with equipment prices and currency timing.
Key gaps usually come from scope boundaries and the measurement point in the project cycle. A capacity based view depends on what is treated as commissioned and grid connected versus only awarded or permitted, and whether rooftop systems are captured consistently. A revenue based view, on the other hand, will move based on assumed system prices, import costs, and which parts of the value chain are included, which makes cross checks essential.
Benchmark comparison
| Source | Market Size | Gaps in Research Methodology |
|---|---|---|
| Mordor Intelligence | USD 23.50 B (2025) | |
| Regional Consultancy A | USD 3.70 B (2023) | Reported as market value in USD, which depends heavily on assumed system pricing, value chain coverage, and exchange rate timing rather than commissioned capacity. |
| Industry Association B | USD 27.25 B (2026) | Uses a forward year capacity figure as the headline size, so the number reflects expected additions and pipeline conversion rather than the current installed base in the stated year. |
By tracking grid connected commissioning records and then refreshing conversion and timing assumptions through interviews, Mordor Intelligence keeps the estimate tied to installed capacity reality instead of price swings or early stage project counts. The spread in the table is mostly explained by unit choice and the point where projects are counted, and our approach stays traceable because the steps can be repeated each year with the same public signals and field checks.


Key Questions Answered in the Report
What cumulative capacity is targeted for 2031?
National roadmaps aim for 57.1 GW of installed solar by 2031, up from 23.50 GW in 2025.
Which region contributes the largest share today?
The southern corridor centered on Konya, Antalya, and Mersin supplies 51.28% of current capacity.
How fast are residential rooftops expanding?
Household systems register a 19.7% CAGR through 2031 under net-metering incentives.
Why is the “super permit” important for investors?
It trims project approval from 48 to under 24 months, lowering development risk and interest costs.
How does EU CBAM affect Turkish manufacturers?
From 2026, exporters face carbon levies, so many sign long-term solar PPAs to cut embedded emissions.
What local incentives back solar manufacturing?
The Yerli Üretim scheme pays up to TRY 1.3/kWh for Turkish-made modules and TRY 0.8/kWh for domestic inverters.
Page last updated on:




