
Glyoxal Market Size and Share
Market Overview
| Study Period | 2020 - 2031 |
|---|---|
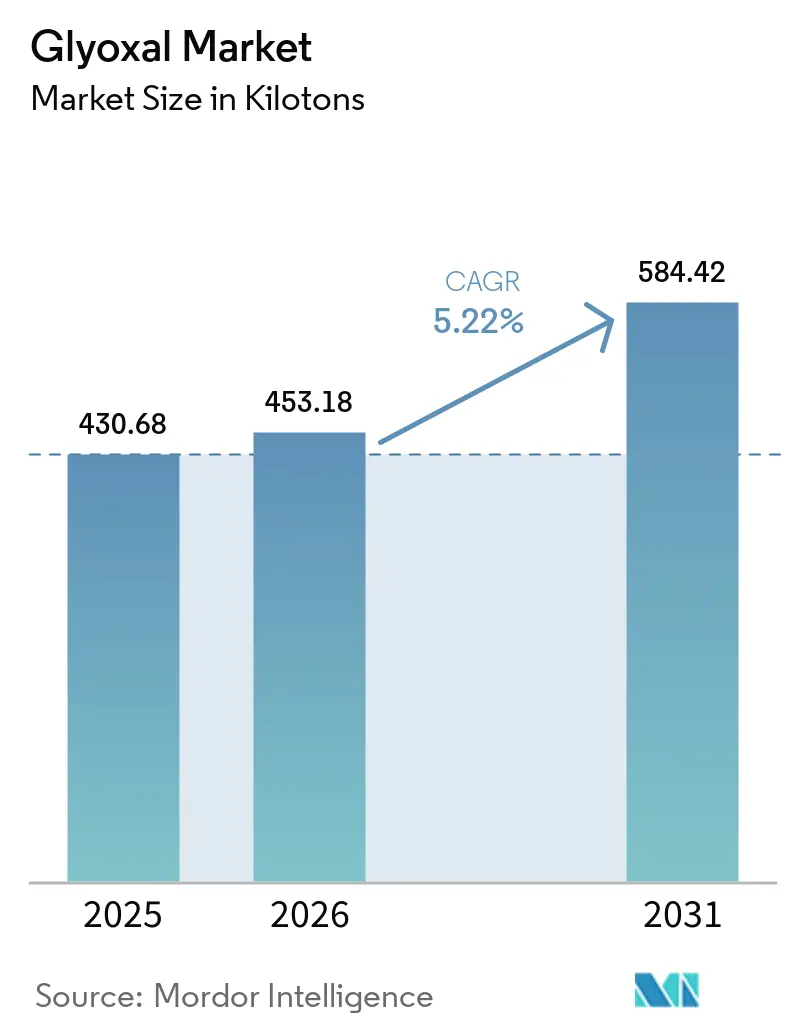
| Market Volume (2026) | 453.18 kilotons |
| Market Volume (2031) | 584.42 kilotons |
| Growth Rate (2026 - 2031) | 5.22 % |
| Fastest Growing Market | Asia Pacific |
| Largest Market | Asia Pacific |
| Market Concentration | Medium |
Major Players *Disclaimer: Major Players sorted in no particular order Image © Mordor Intelligence. Reuse requires attribution under CC BY 4.0. | |
Glyoxal Market Analysis by Mordor Intelligence
The Glyoxal Market size was valued at 430.68 kilotons in 2025 and estimated to grow from 453.18 kilotons in 2026 to reach 584.42 kilotons by 2031, at a CAGR of 5.22% during the forecast period (2026-2031). Robust demand in textile finishing, water-borne adhesive formulations and nascent battery-electrolyte uses underpins this trajectory, largely because glyoxal’s dual-aldehyde structure delivers stronger, formaldehyde-free cross-linking. Asia-Pacific remains the principal consumption hub, fueled by China’s expanding yarn exports and India’s maturing chemical-intermediates platform. Liquid-solution grades are displacing solid formats in all major applications because automated dosing lines improve batch consistency and reduce processing downtime. Parallel growth in chemical-intermediate synthesis, particularly for pharmaceuticals and specialty materials, broadens the addressable customer base and cushions cyclicality in the textile sector. Rising defense allocations in the United States and BASF’s new Chinese complex underline how supply-chain decentralization and near-shoring strategies are reshaping long-term capacity planning.
Key Report Takeaways
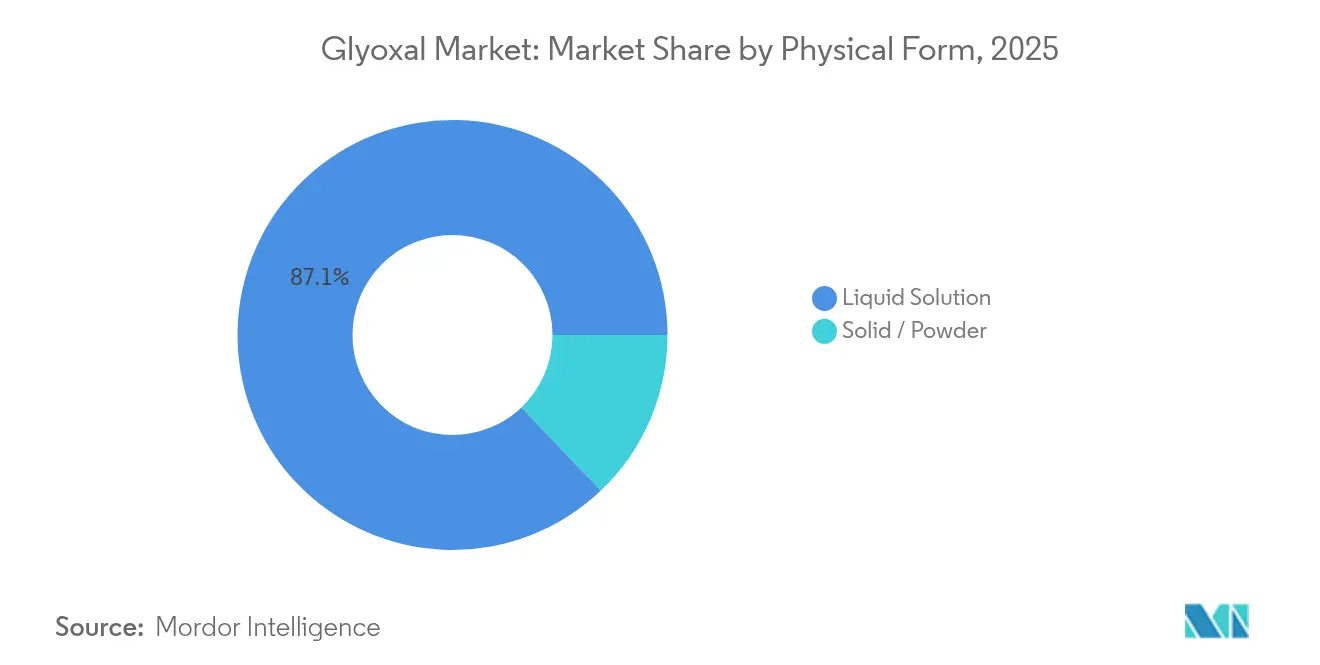
- By physical form, liquid solutions captured 87.12% of glyoxal market share in 2025; solid and powder formats are forecast to post the fastest 6.15% CAGR through 2031.
- By application, cross-linking agents led with a 64.10% revenue share in 2025, while chemical intermediates are projected to advance at a 5.86% CAGR to 2031.
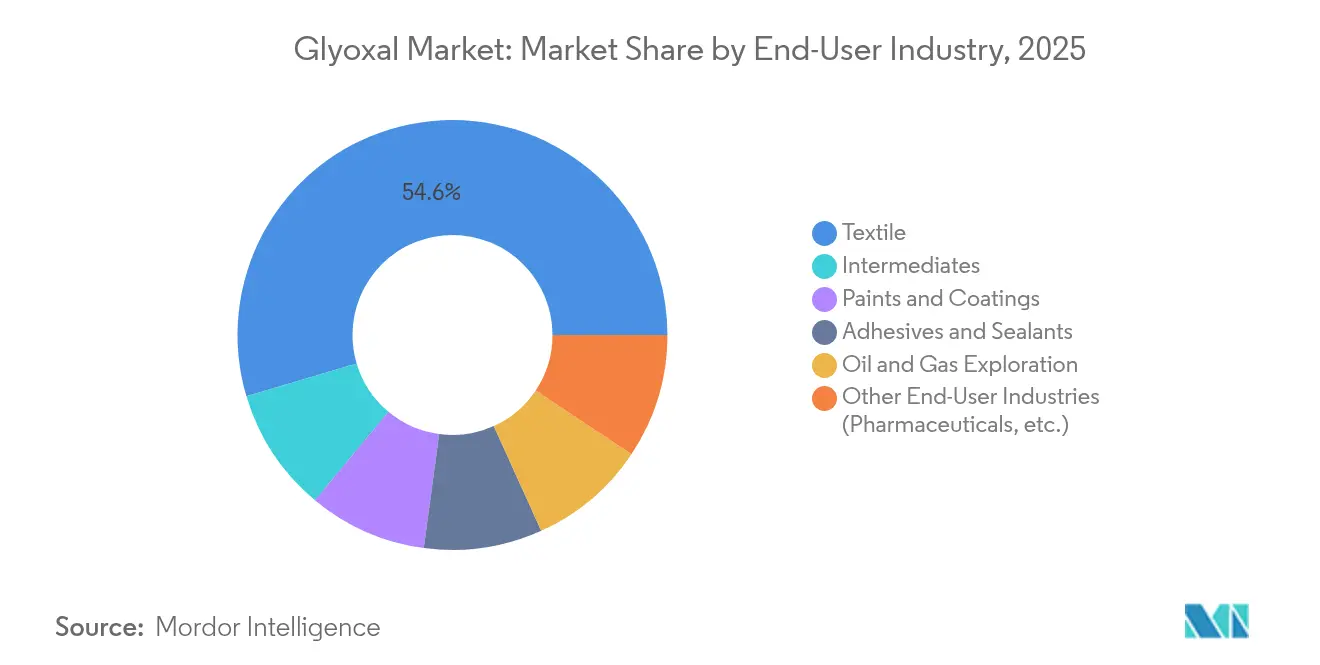
- By end-user industry, textiles accounted for 54.60% of the glyoxal market size in 2025 and intermediates are expanding at a 5.98% CAGR through 2031.
- By geography, Asia-Pacific dominated with 44.55% of the glyoxal market share in 2025; the region is also set to record the highest 6.30% CAGR during the forecast window.
Note: Market size and forecast figures in this report are generated using Mordor Intelligence’s proprietary estimation framework, updated with the latest available data and insights as of 2026.
Market Trends and Insights
Drivers Impact Analysis of Glyoxal Market*
| Driver | (~) % Impact on CAGR Forecast | Geographic Relevance | Impact Timeline |
|---|---|---|---|
| Rising textile and apparel production in developing economies | +1.2% | APAC core, spill-over to South America | Medium term (2-4 years) |
| Expanding use as cross-linking agent in water-borne adhesives | +0.8% | Global, with concentration in North America & EU | Short term (≤ 2 years) |
| Growing demand for oil-field chemicals in deep-water drilling | +0.6% | North America, Middle East, offshore regions | Long term (≥ 4 years) |
| Glyoxal adoption as biodegradable biocide in paper and board packaging | +0.5% | EU, North America, with expansion to APAC | Medium term (2-4 years) |
| Emerging role in silicon-anode battery electrolyte formulations | +0.3% | APAC manufacturing hubs, technology centers globally | Long term (≥ 4 years) |
| Source: Mordor Intelligence | |||
Rising Textile and Apparel Production in Developing Economies
China exported USD 13.7 billion in yarn during 2023, with cotton yarn comprising 70% of shipments, an output scale that necessitates durable-press and antimicrobial finishing aided by glyoxal cross-linking. The compound’s biodegradability meets stricter import regulations in the European Union and North America, making it a preferred alternative to formaldehyde for brands marketing “cleaner” garments. BASF’s Zhanjiang complex, operational from 2025, exemplifies how major suppliers are co-locating capacity in Asia to shorten logistics lanes and capture incremental orders from Vietnam, Bangladesh and India[1]BASF SE, “BASF Starts Up First Plants at Zhanjiang Verbund Site,” basf.com. Medium-term impact is tied to the typical 2-4 year build-out cycle of new spinning and dyeing mills. As these plants scale, glyoxal market demand should parallel fiber throughput because every incremental meter of fabric finished with wrinkle-free or antimicrobial chemistry contains a defined aldehyde loading.
Expanding Use as Cross-Linking Agent in Water-Borne Adhesives
Stringent global emission rules have accelerated the phase-down of solvent-borne wood and paper adhesives, elevating glyoxal’s attractiveness in aqueous systems. Its ability to generate stable hemi-acetal bridges in cellulose substrates allows adhesive formulators to meet low-VOC thresholds without sacrificing bond strength. BASF enacted price increases on diols and derivatives in April 2025, a move that reflects broader raw-material cost inflation and pressures converters to seek more efficient curatives such as glyoxal that enable single-component formulations. The driver exerts short-term impact because adhesive plants retrofit mixers and reactors relatively quickly—typically within a fiscal year—once raw-material approvals are secured. North American building-products makers view glyoxal as a direct pathway to keep ahead of potential formaldehyde re-classification under the EPA’s IRIS program.
Growing Demand for Oil-Field Chemicals in Deep-Water Drilling
Macromolecular gels used in hydraulic fracturing rely on cross-linkers that maintain viscosity at 150 °C and beyond; glyoxal retains reactivity under such extremes, whereas lower-molecular weight aldehydes degrade[2]American Chemical Society, “High-Temperature Fracturing Fluids Using Dialdehydes,” acs.org. Operators in the Gulf of Mexico and the Brazilian pre-salt have begun specifying glyoxal-activated guar and cellulose gels to stabilize fracture networks in ultra-deep wells. Because project sanctioning spans half-decades, the chemical’s requirement profile is locked during early field-development stages, creating predictable offtake volumes over the long term. Middle-Eastern NOCs trialed glyoxal-based diverter fluids in 2024 and initial case studies report 15% higher hydrocarbon flow rates. The slow yet steady pipeline of new offshore projects suggests sustained, albeit niche, volume lift for the glyoxal market through 2030.
Glyoxal Adoption as Biodegradable Biocide in Paper and Board Packaging
European food-contact legislation favors preservatives that decompose rapidly post-use, and glyoxal’s dual action as both cross-linker and antimicrobial aligns with this framework. FDA compliance for resin-coated paper further reassures North American mills that the aldehyde can be incorporated without additional GRAS petitions. Producers of molded fiber trays and cups increasingly deploy glyoxal to reduce spoilage microbes, extending shelf life by 48 hours in fresh-produce trials. Medium-term adoption hinges on packaging converters’ equipment upgrade cycles and on confirming toxicological endpoints in emerging markets. The driver’s 0.5 percentage-point push to global CAGR is therefore anchored in Europe and the United States but will diffuse to APAC printers as multinational consumer-goods companies harmonize packaging specs across regions.
Restraints Impact Analysis of Glyoxal Market*
| Restraint | (~) % Impact on CAGR Forecast | Geographic Relevance | Impact Timeline |
|---|---|---|---|
| Toxicological concerns and stricter workplace exposure limits | -0.7% | Global, with strictest enforcement in EU & North America | Short term (≤ 2 years) |
| Price volatility of ethylene glycol feedstock | -0.4% | Global supply chains, acute in regions dependent on imports | Short term (≤ 2 years) |
| Competition from dialdehyde starch and other green cross-linkers | -0.3% | EU & North America leading, expanding to APAC markets | Medium term (2-4 years) |
| Source: Mordor Intelligence | |||
Toxicological Concerns and Stricter Workplace Exposure Limits
Regulators scrutinize dialdehydes because of potential genotoxicity; WHO’s 2024 review flagged glyoxal for advanced glycation end-product formation, prompting calls to tighten occupational limits. The European Chemicals Agency is reassessing the current 0.1 mg/m³ workplace exposure threshold, and OSHA initiated a parallel data-collection effort that could impose ventilation upgrades costing small mills up to USD 2 million. These compliance costs may drive marginal producers from the market, consolidating supply under better-capitalized companies. Short-term pressure is most acute in Europe and North America, where enforcement staff can audit plants within weeks of new limits taking effect, temporarily dampening production growth.
Price Volatility of Ethylene Glycol Feedstock
Glyoxal output hinges on vapor-phase oxidation of ethylene glycol, itself subject to naphtha and natural-gas price swings. Spot EG prices spiked 23% in Q1 2025 on Middle-East plant turnarounds, compelling glyoxal suppliers to issue USD 70 per-ton surcharges. Producers in Southeast Asia, heavily reliant on imported EG, faced squeezed margins, and several cut operating rates by 10%. Though surcharges typically pass through, converters making price-sensitive textile finishes may substitute lower-performance dialdehyde starch when glyoxal premiums exceed 15%. Short-term volatility thus trims 0.4 percentage points from the forecast CAGR.
*Our forecasts treat driver/restraint impacts as directional, not additive. The impact forecasts reflect baseline growth, mix effects, and variable interactions.
Glyoxal Market Segment Analysis
By Physical Form:
Liquid Solutions Drive Processing EfficiencyLiquid grades commanded 87.12% of 2025 consumption, reflecting plant-level preferences for pumpable, ready-to-use aldehyde solutions. Automated dosing lowers batch variability and shortens cycle times, factors that have helped the liquid glyoxal market size outpace overall demand at a 5.78% CAGR. Powder forms maintain relevance in remote oil-field operations where weight-based metering and storage stability trump convenience. Growth in containerized textile-chemical “kitchen” installations across Bangladesh and Ethiopia supports continued liquid-grade penetration through 2031. Solid glyoxal derivatives remain important in resin capsules and latency-controlled adhesive kits, but rising freight costs for bulky solids encourage converters to formulate on-site liquids instead.
Processing efficiency explains why liquid solutions remain the preferred specification for fashion, home-textile and technical-fabric producers. Inline pH-controlled injection ensures homogeneous fixation, reducing rework rates by 4% in denim finishing trials. This cost benefit justifies modest price premiums over powders. Moreover, regulations governing shipping of oxidizable solids are tightening; liquids classed as non-combustible enjoy simpler documentation under IMDG rules, a logistics advantage that supports the liquid share’s incremental expansion.



By Application:
Chemical Intermediates Accelerate Despite Cross-Linking DominanceCross-linking applications still dominated 2025 with a 64.10% share of the glyoxal market, underlining the molecule’s enduring role in durable-press fabrics, paper sizing and water-borne wood glues. Nevertheless, the fastest 5.86% CAGR stems from chemical-intermediate use, reflecting glyoxal’s versatility as a C2 dialdehyde in heterocycle and API synthesis. Pharmaceutical firms exploit it to construct imidazoles and pyrazines, while specialty polymer start-ups condense it into bio-based barrier resins, alongside glyoxylic acid in chemical synthesis. Pilot plants in India report a threefold rise in glyoxal consumption for pyrimidine intermediates since mid-2024.
Diversification toward intermediates lessens reliance on cyclical textile demand and often yields margins 200 basis points higher than commodity finishing grades. FDA and BfR clearances for food-contact coatings further broaden glyoxal’s utility, allowing film-forming resin producers to address the fast-growing fresh-produce packaging niche. These trends anchor the segment’s acceleration even as cross-linkers remain core volume drivers.
By End-User Industry:
Intermediates Segment Outpaces Textile LeadershipTextiles retained 54.60% of 2025 volume because wrinkle-free shirtings, medical apparel and home linens rely on aldehyde fixation to achieve durable hand-feel and antimicrobial persistence. The glyoxal market share of textiles is expected to dilute modestly as the intermediates segment climbs at 5.98% CAGR on the back of broader chemical-synthesis uptake. Adhesives hold steady, aided by construction-grade water-borne polyvinyl-alcohol glues shifting away from formaldehyde. In oil and gas, glyoxal-cross-linked gels feature in high-temperature fracturing fluids where alternative curatives degrade, ensuring a small but lucrative off-take stream.
Pharmaceutical and “other” categories exhibit the sharpest absolute growth, spurred by demand for antibiotic scaffolds and specialty coatings. Their share gains are magnified because end-use pricing can exceed USD 4,000 per ton, more than double textile-grade benchmarks, further buoying overall glyoxal market profitability.
Geography Analysis
APAC Glyoxal Market
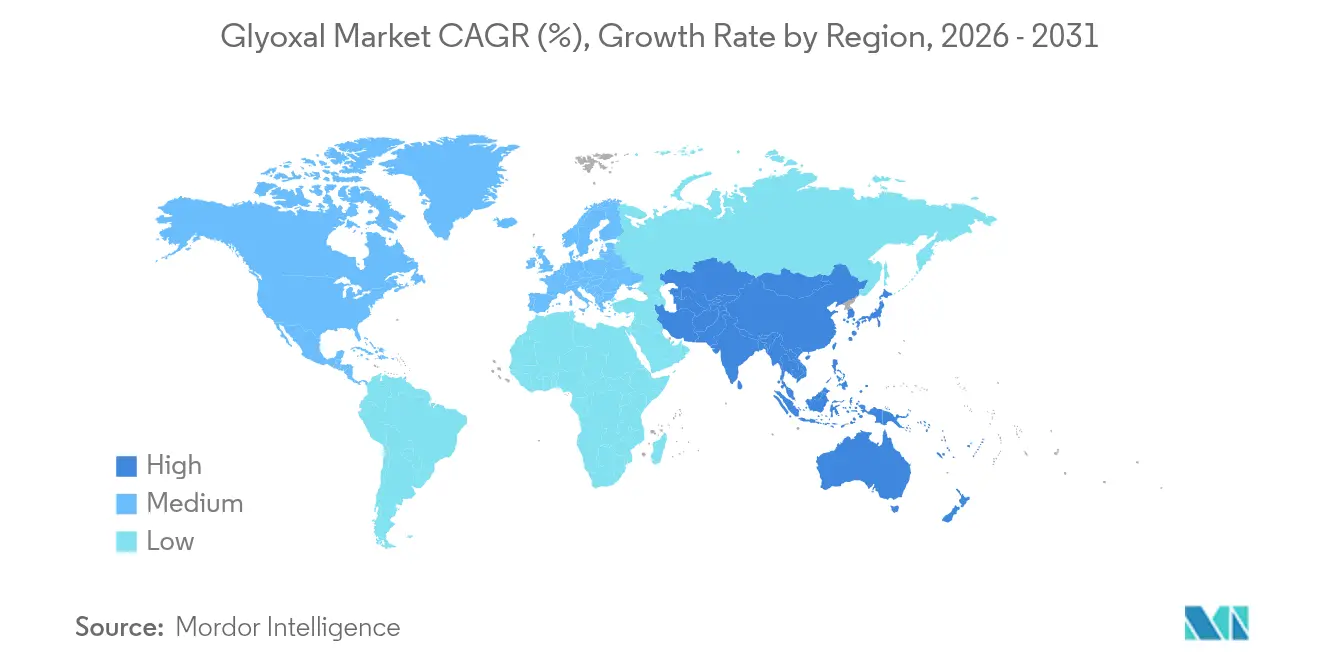
Asia-Pacific captured 44.55% of worldwide volume in 2025 and is forecast to expand at a 6.30% CAGR to 2031, more than one percentage point above the global glyoxal market CAGR. China’s yarn export engine exemplifies underlying fabric-finishing demand, while India’s pharmaceutical build-out stimulates intermediate consumption. Japan and South Korea contribute innovation pull through advanced battery programs evaluating glyoxal-based electrolytes. The region’s integrated petrochemical chains mitigate ethylene-glycol feedstock shocks, giving APAC producers a structural cost edge.
North America Glyoxal Market
North America remains the second-largest regional cluster due to established chemical infrastructures and legislative momentum behind low-emission adhesives. The Department of Defense’s USD 24 million, five-year funding for domestic glyoxal manufacturing underscores the compound’s criticality in specialty coatings. Robust housing starts and remodeling spending sustain adhesive demand, while shale-related deep-water tie-backs extend oil-field chemical requirements. Importantly, the continent’s stringent OSHA oversight drives higher-purity and lower-formaldehyde specifications, favoring premium glyoxal formulations.
Europe Glyoxal Market
Europe displays mature demand tempered by stringent occupational exposure regulation but benefits from high-value specialty chemical niches. BASF’s 60,000-ton Ludwigshafen train secures regional supply, complemented by smaller niche makers in Italy and the Netherlands. Transition toward paper-board food packaging, propelled by the Single-Use Plastics Directive, is forecast to add incremental glyoxal biocide volumes. However, rising energy costs and tightened REACH dossiers may compress margins, motivating European converters to shift certain high-volume formulations to Eastern Europe and Türkiye.

Value Chain Analysis
Glyoxal production sits downstream of ethylene glycol (EG), with gas-phase oxidation of EG with oxygen over precious-metal catalysts as the dominant route, followed by absorption and stabilization into aqueous solution for transport. Feedstock integration into EG is a key cost and supply lever for large producers, while catalyst performance, reaction control, and purification determine suitability for higher-spec uses, including low-color and low-impurity grades for intermediates. The chain is sensitive to EG price swings, and handling requirements for a reactive aldehyde solution add operating discipline and compliance overhead compared with many commodity oxygenates.
Most volumes move as stabilized liquid solutions through bulk tank logistics, IBCs, and drums to regional blenders and formulators, then onward to textile finishing houses, adhesive producers, paper and packaging mills, and oilfield chemical suppliers. Application know-how and documentation, including food-contact related compliance where applicable, are common differentiators, which pushes suppliers to provide technical support, consistent specifications, and secure storage and dosing infrastructure at customer sites. Downstream pull is strongest where automated dosing lines and turnkey concentrates reduce customer-side blending, while smaller mills face higher relative costs for ventilation, wastewater treatment, and safe storage, shaping channel selection and supplier preference.
Competitive Landscape
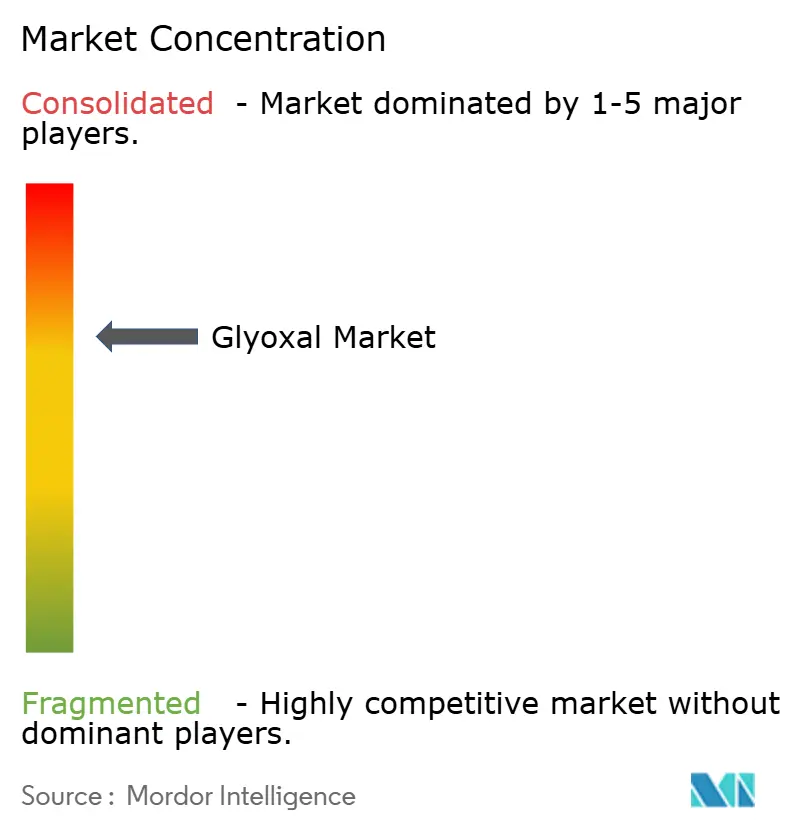
The glyoxal market is moderately concentrated. BASF leverages 60,000 tons of captive capacity in Germany and a new Zhanjiang line to safeguard supply for multinational textile and paper clients. Chinese producers focus on volume, often integrating upstream ethylene-glycol availability to maintain cost leadership, while European players differentiate via REACH dossier depth and application-lab support.
Strategically, sustainability credentials dominate competitive positioning. BASF has obtained ISCC+ certification for over 60 glyoxal-containing products, offering carbon-footprint declarations below 0.9 kg CO₂-eq per kg product. Hubei Hongyuan is piloting bio-ethylene glycol routes to hedge fossil volatility. Forward integration into application-specific blends is also a priority; WeylChem launched a turnkey antibacterial paper-coating concentrate in 2025 that eliminates customer side-blending and cuts batch times by 20%. Meanwhile, U.S. mid-tier entrant Locus Performance Materials is marketing glyoxal-enhanced biosurfactant packages for drilling fluids, signaling how niche technology can disrupt traditional supply chains.
Heightened regulatory scrutiny incentivizes larger companies to invest in closed-loop wastewater treatment and continuous reactor retrofits to curb unreacted aldehyde emissions. Smaller producers lacking capital may exit, gradually raising global market concentration. Nonetheless, regional supply security initiatives—such as the Pentagon’s domestic capacity grant—could seed new entrants, balancing consolidation forces.
Glyoxal Industry Leaders
BASF
Haihang Industry
hubei hongyuan pharmaceutical technology co., ltd
WeylChem International GmbH
Zhonglan Industry Co.,Ltd.
- *Disclaimer: Major Players sorted in no particular order
Glyoxal Market Companies Covered in this Report
- Amzole India Pvt Ltd
- BASF
- Haihang Industry
- hubei hongyuan pharmaceutical technology co., ltd
- Jinan Huashihang Chemical Co., Ltd.
- INEOS
- Merck KGaA
- Otto Chemie Pvt. Ltd.
- Spectrum Chemical
- Thermo Fisher Scientific
- Tokyo Chemical Industry India Pvt. Ltd.
- WeylChem International GmbH
- Zhonglan Industry Co.,Ltd.

Market Opportunities and Future Outlook
Formaldehyde substitution in textiles, water-borne adhesives, and paper-based packaging continues to open specification space for glyoxal-based cross-linking systems that deliver lower-VOC performance, particularly for branded apparel supply chains and building-products adhesives. In textiles, China remains a scale anchor for finishing demand, supported by yarn export intensity, while growth in Asia-based dyeing and finishing capacity creates room for suppliers that can deliver consistent liquid-solution grades compatible with automated dosing. In packaging and paper, food-contact driven requirements increase demand for higher-purity and well-documented chemistries, which tends to reward suppliers that can support compliance packages and application-lab validation with mills and converters.
A second opportunity track sits in higher-value chemical intermediates, where glyoxal is used as a versatile C2 building block for heterocycles and specialty materials. India has been one visible locus of increased intermediate synthesis activity since mid-2024, raising the importance of tighter impurity profiles and lot-to-lot reproducibility rather than bulk volume alone. On the supply side, capacity co-location and supply security investments by major producers in Asia, including BASF at Zhanjiang (operational from 2025), reinforce regional sourcing options for multinational customers and support multi-region procurement strategies when EG and freight markets tighten.
Recent Industry Developments in Glyoxal Market
- March 2026: Hubei Hongyuan Pharmaceutical Technology Co., Ltd. reported its results for the first quarter ended March 31, 2026, showing a sharp increase in sales versus the prior-year period. While not glyoxal-only, the scale-up signals stronger throughput for chemical intermediate operations where glyoxal is a key input, tightening requirements around consistent quality and supply reliability for specialty customers.
- April 2025: BASF announced price increases for diols and derivatives, reflecting broader upstream cost inflation in oxygenated chemicals that connect back to ethylene glycol economics. The move highlighted pass-through pressure across the glyoxal chain and increased attention on formulation efficiency in water-borne adhesives and textile finishing, where curative loading and process time translate directly into cost per unit output.
- December 2024: INEOS continued integration planning for its previously announced acquisition of LyondellBasell’s Ethylene Oxide and Derivatives business, including the Bayport Underwood site in Texas. The asset base strengthens EG availability and optionality in North America, which can influence glyoxal feedstock economics and resilience for downstream users during logistics disruptions.


Glyoxal Market Report Scope and Research Methodology
Market Definition and Coverage
For this study, the glyoxal market is defined as the global demand and supply of glyoxal sold as a chemical input for industrial use, tracked across major consuming industries and trade-linked regions.
Scope exclusions: this sizing does not count downstream finished goods value that contain glyoxal as an ingredient, and it excludes internal transfers that are not priced as market sales.
Segments Covered in This Report
- By Physical Form
- Liquid Solution
- Solid / Powder
- Application
- Cross-linking Agents
- Chemical Intermediates and Synthesis
- Other Applications (Biocides and Preservatives, etc.)
- By End-User Industry
- Adhesives and Sealants
- Intermediates
- Oil and Gas Exploration
- Paints and Coatings
- Textile
- Other End-User Industries (Pharmaceuticals, etc.)
- By Geography
- Asia-Pacific
- China
- Japan
- India
- South Korea
- ASEAN Countries
- Rest of Asia-Pacific
- North America
- United States
- Canada
- Mexico
- Europe
- Germany
- United Kingdom
- France
- Italy
- Spain
- Russia
- NORDIC Countries
- Rest of Europe
- South America
- Brazil
- Argentina
- Rest of South America
- Middle East and Africa
- Saudi Arabia
- South Africa
- Rest of Middle East and Africa
- Asia-Pacific
Data Sources, Market Sizing, and Validation
Desk Research
Desk research was used to set the fact base for the model and to keep assumptions realistic before we tested them with the industry. Public sources, such as UN Comtrade trade statistics, USITC DataWeb, Eurostat, and national statistical offices, helped map trade flows, chemical production context, and regional demand signals.
We also reviewed safety and regulatory references that shape usage patterns and transport, along with peer reviewed chemistry and materials journals that explain typical glyoxal applications and substitution behavior. Company annual reports, investor presentations, and reputable industry press were used to understand capacity moves, operating footprint changes, and end market exposure. In a few places, we supplemented with paid subscriptions used for company financials and intelligence, patent databases, and shipment-level import and export data to cross-check what is visible in public tables. These desk sources are illustrative and not exhaustive, and many other references were used for data collection, validation, and clarification.
Primary Interviews and Surveys
Primary discussions were used to confirm how glyoxal volumes move through key applications, and to test the pricing logic that supports value translation. We covered producers, distributors, and downstream users across APAC, EMEA, and the Americas, so regional demand signals, trade reliance, and the application mix could be validated and then reflected back into the market model.
Distribution of primary research fieldwork respondents
| Company type | Respondent position | Region |
|---|---|---|
| Top tier: 26% | CXOs: 12% | APAC: 43% |
| Mid tier: 53% | Functional/Unit leaders: 30% | EMEA: 32% |
| Smaller Players: 21% | Managers: 58% | Americas: 25% |
Market-Sizing & Forecasting
Sizing was built using a top-down approach where production context, trade flows, and application level demand pools were reconstructed by region, and the main totals were reached at the end. To keep the outcome practical, results were then corroborated with selective bottom-up checks using sampled supplier and channel feedback, and volume times average selling price approximations for common grades and forms.
Key inputs that shaped the model included the split between liquid solution and solid or powder shipments, the share of demand going into cross-linking uses versus chemical intermediate use, regional import dependence seen in customs flows, and observed price spreads linked to concentration, packaging, and logistics distance. We also tracked demand pull from major end uses that repeatedly surfaced in interviews, such as textiles, adhesives and sealants, and certain specialty chemical synthesis routes. Forecasts were mainly produced using scenario analysis, where macro and end use indicators were converted into demand paths and then reviewed with experts to confirm that the pace of adoption and substitution looked reasonable.
Where a clean bottom-up roll-up was not possible for smaller countries, gaps were handled through proxying based on trade to apparent consumption, normalized per industrial output indicators, and then corrected using interview-based reality checks on local sourcing versus imports.
Data Validation & Update Cycle
Validation is done by comparing model outputs against independent signals, such as trade based apparent consumption, known capacity additions or shutdowns, and the implied application splits that downstream users described. Outliers are investigated with extra checks on unit conversions, regional pricing, and currency timing, and then a second analyst review is completed before sign-off.
The report is refreshed annually, and interim updates are made when material events occur, such as major plant moves, sharp feedstock cost shifts, or policy changes that affect chemical trade. Before delivery, we run a fresh pass on the newest public releases and re-contact sources if a variance shows up that cannot be explained by the existing assumptions.
Mordor Intelligence's Glyoxal Market Size Compared Against Other Published Estimates
Published market sizes for glyoxal do not always match because the starting unit can differ, and then the conversion logic can drift as scope and assumptions change. The biggest drivers we usually see are whether a source sizes in volume versus value, how it treats grade and concentration mixes, and what it assumes for regional pricing and trade dependence.
Trade based apparent consumption checks and application mix validation from industry interviews are the evidence that keep Mordor Intelligence's estimate tied to a volume-defined glyoxal demand pool, before any optional translation into value is attempted. Some external figures appear to rely on a single base year value model and then extend growth forward without showing how concentration, logistics, and end-use mix shift the average selling price over time.
Benchmark comparison
| Source | Market Size | Gaps in Research Methodology |
|---|---|---|
| Mordor Intelligence | USD 453.18 M (2026) | |
| Global Consultancy A | USD 328.43 M (2024) | Uses a value-only base year and does not make the volume-to-value bridge explicit, so concentration and form mix changes can be under-reflected in the total. |
| Industry Research Group B | USD 345.93 M (2024) | A broader end-use list is shown, but the methodology summary does not clarify how regional pricing, import reliance, and concentration differences are normalized, which can shift the final aggregation. |
The spread across published numbers is mostly explained by unit choice and by the visibility of the price and mix assumptions used to move from chemistry demand to a single market total. By keeping the steps traceable to trade signals, application splits, and practical pricing checks, the model stays easier to reproduce and update when new supply or demand information appears.


Key Questions Answered in the Report
What is the current Glyoxal Market size?
The glyoxal market reached 453.18 kilo tons in 2026 and is forecast to hit 584.42 kilo tons by 2031, reflecting a 5.22% CAGR.
Which region leads glyoxal consumption?
Asia-Pacific holds 44.55% of global volume and is expected to advance at the quickest 6.30% CAGR through 2031.
Why are liquid glyoxal solutions preferred by manufacturers?
Liquid grades enable automated dosing, reduce batch variability and simplify compliance with transport regulations, explaining their 87.12% share in 2025.
What drives glyoxal demand beyond textile finishing?
Rapid uptake in chemical-intermediate synthesis for pharmaceuticals and specialty materials is the fastest-growing application at a 5.86% CAGR.
Page last updated on:


 Your data is secure and never sold or shared.


