
Market Overview
| Study Period | 2020 - 2031 |
|---|---|
| Market Volume (2026) | 24.21 Million tons |
| Market Volume (2031) | 30.98 Million tons |
| Growth Rate (2026 - 2031) | 5.05 % |
| Fastest Growing Market | Asia-Pacific |
| Largest Market | Asia-Pacific |
| Market Concentration | Medium |
Major Players *Disclaimer: Major Players sorted in no particular order Image © Mordor Intelligence. Reuse requires attribution under CC BY 4.0. | |
Formaldehyde Market Analysis by Mordor Intelligence
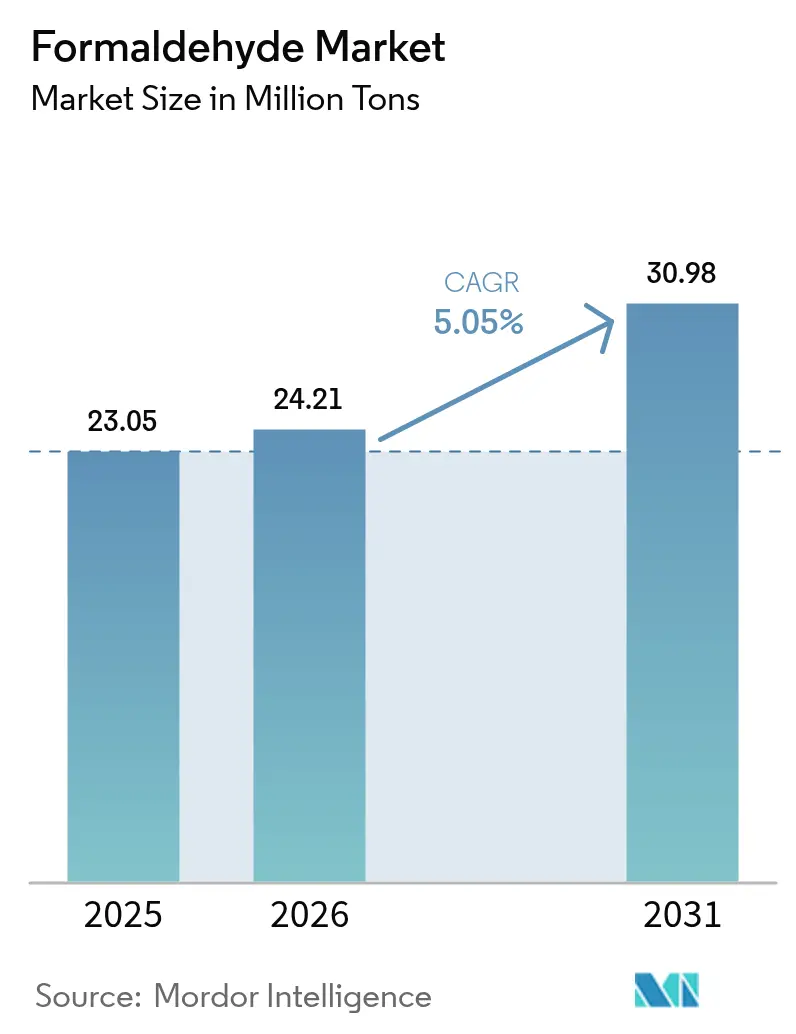
The Formaldehyde Market size was valued at 23.05 Million tons in 2025 and estimated to grow from 24.21 Million tons in 2026 to reach 30.98 Million tons by 2031, at a CAGR of 5.05% during the forecast period (2026-2031). Construction, automotive, and agriculture collectively drive this expansion through steady demand for resins, adhesives, and specialty intermediates that rely on formaldehyde’s unique cross-linking properties. Competitive capacity additions, notably in Asia-Pacific, align with policy-backed infrastructure spending, while incremental innovations in emission-control catalysts moderate regulatory headwinds in North America and Europe. Market leaders protect margins by integrating methanol feedstocks, optimizing catalyst efficiency, and investing in bio-based alternatives that anticipate tighter workplace exposure limits from the United States Environmental Protection Agency. Producers also accelerate research and development (R&D) around next-generation low-free formaldehyde resins to retain share in price-sensitive wood panel applications without compromising compliance.
Key Report Takeaways
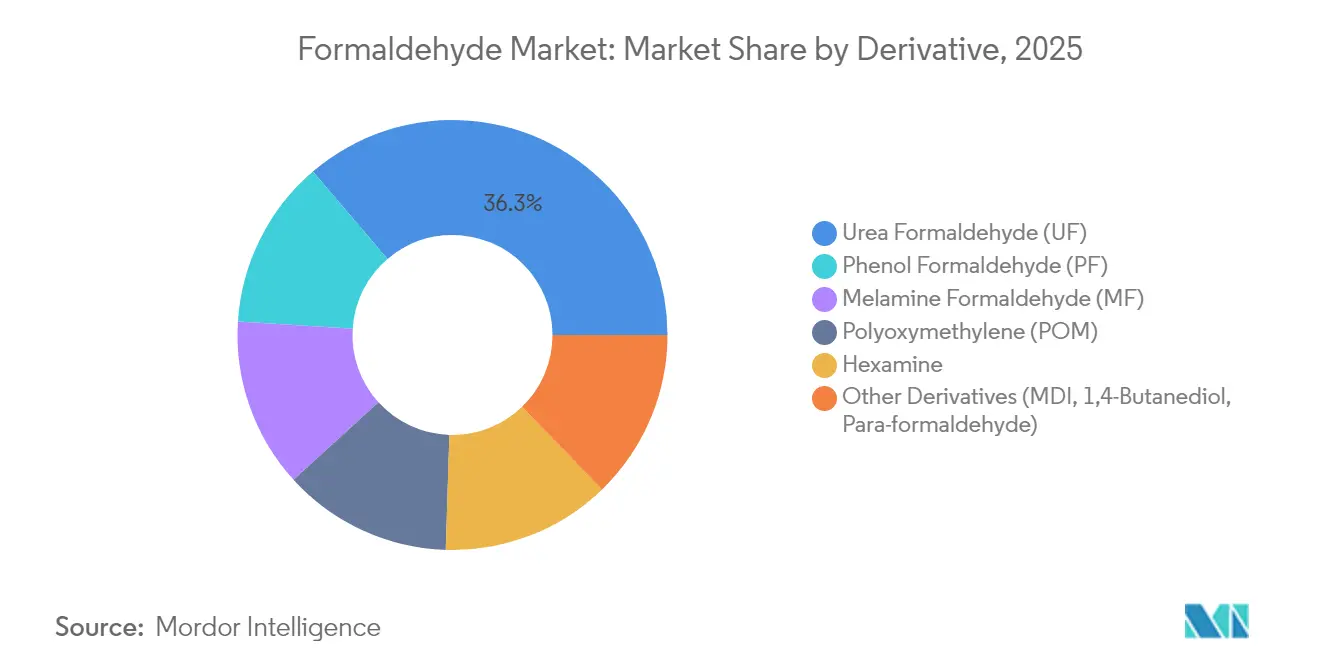
- By derivative, urea-formaldehyde captured 36.25% of the Formaldehyde market share in 2025, while polyoxymethylene is projected to grow at a 6.05% CAGR to 2031.
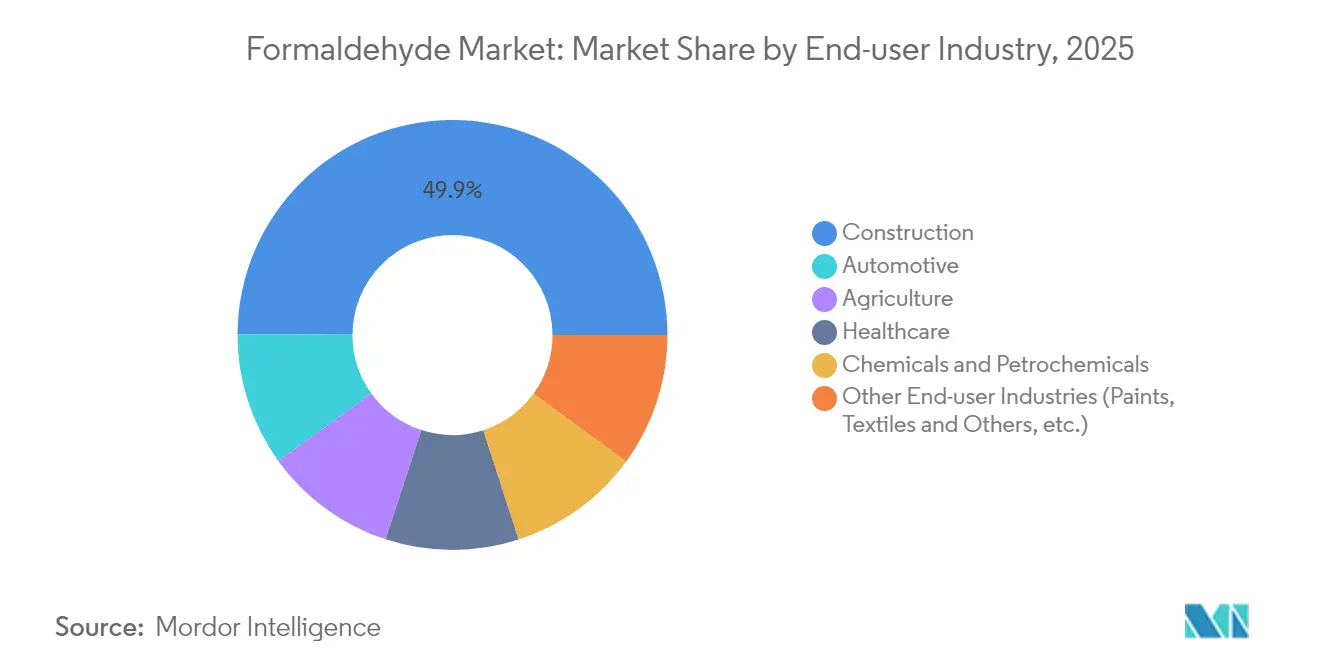
- By end-user industry, construction led with 49.95% revenue share in 2025; automotive is forecast to expand at a 6.02% CAGR through 2031.
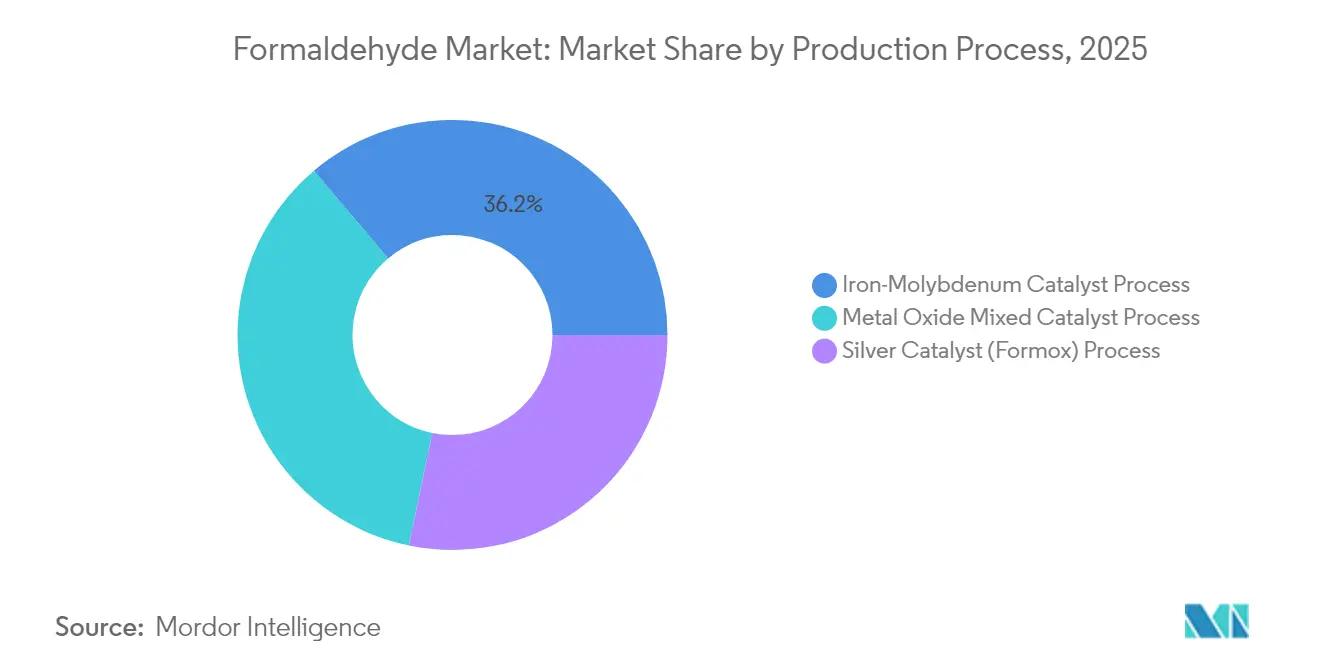
- By production process, the silver catalyst route accounted for 28.25% of the Formaldehyde market size in 2025, whereas the iron-molybdenum pathway is advancing at a 5.92% CAGR through 2031.
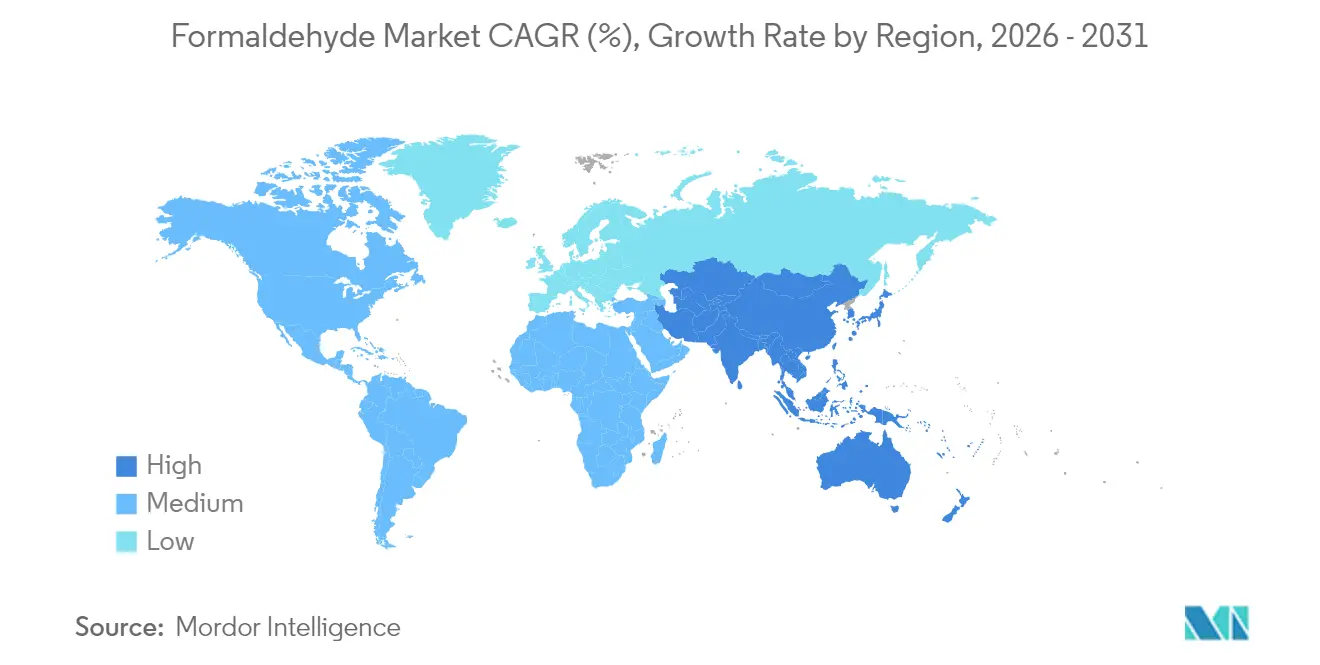
- By geography, Asia-Pacific held 51.88% of global volume in 2025 and is set to record the highest regional CAGR of 5.8% during 2026-2031.
Note: Market size and forecast figures in this report are generated using Mordor Intelligence’s proprietary estimation framework, updated with the latest available data and insights as of 2026.
Market Trends and Insights
Drivers Impact Analysis of Formaldehyde Market*
| Driver | (~) % Impact on CAGR Forecast | Geographic Relevance | Impact Timeline |
|---|---|---|---|
| Construction Demand for Wood Panels | +1.2% | Asia-Pacific, North America | Medium term (2-4 years) |
| Automotive Shift to Polyoxymethylene (POM)-based Lightweight Parts | +0.8% | North America, Europe, Asia-Pacific | Long term (≥ 4 years) |
| Fertilizer Sector Expansion in Developing Economies | +0.6% | Asia-Pacific, Latin America, Africa | Medium term (2-4 years) |
| Healthcare Use in Vaccines and Disinfectants | +0.4% | Global | Short term (≤ 2 years) |
| Growing Utilization for Chemical Manufacturing | +0.3% | Global industrial centers | Long term (≥ 4 years) |
| Source: Mordor Intelligence | |||
Construction Demand for Wood Panels
Urbanization continues to elevate housing starts, which in turn lifts engineered-wood consumption that relies on urea-formaldehyde and phenol-formaldehyde binders. China and India dominate incremental panel capacity, yet rising plantation hardwood use demands modified resin formulations that preserve bond strength while lowering emissions. Tier-1 panel producers deploy advanced scavenger additives and catalytic oxidation units to meet California Air Resources Board limits without sacrificing line speed. Although alternative chemistries such as soy-protein adhesives gain traction in premium cabinetry, formaldehyde resins remain cost-optimal for mass-market boards.
Automotive Shift to Polyoxymethylene (POM)-based Lightweight Parts
Fleet-wide fuel-economy targets spur automakers to replace metal with engineering thermoplastics, placing Polyoxymethylene (POM) at the center of light-weighting strategies due to its high stiffness-to-density ratio. Battery-electric models further accelerate POM uptake in electrical connectors and coolant-management manifolds because the polymer offers dielectric strength alongside hydrolysis resistance [1]Hexion Inc., “POM Solutions for Electric Vehicles,” hexion.com. Tier-1 suppliers situated near Midwest and East-Asian vehicle hubs secure multi-year contracts that guarantee formaldehyde of tight purity for stable polymerization. Catalyst advances improve methanol-to-POM conversion, yielding higher throughput and lower per-ton energy consumption, benefits that cascade into competitive component pricing.
Fertilizer Sector Expansion in Developing Economies
Governments across Southeast Asia and Sub-Saharan Africa subsidize slow-release fertilizers that minimize nutrient run-off, creating a growing pull for urea-formaldehyde granules. Farmers adopting precision agriculture value the extended nitrogen availability profile, which supports higher yields on rain-fed fields. As local blending plants come online, backward-integrated formaldehyde capacity is built near urea complexes to streamline logistics. Pilot programs funded by development banks validate agronomic returns, reinforcing medium-term demand visibility.
Healthcare Use in Vaccines and Disinfectants
Formaldehyde’s role as an inactivating agent in influenza and polio vaccine production remains irreplaceable, sustaining baseline demand even as messenger Ribonucleic Acid (mRNA) platforms rise. Hospitals also rely on the compound for surface disinfection and surgical instrument sterilization, with usage peaking during outbreaks. Automated dosing systems and closed-loop ventilation now mitigate occupational exposure, allowing compliance with Occupational Safety and Health Administration (OSHA) short-term exposure limits without curtailing throughput.
Restraints Impact Analysis of Formaldehyde Market*
| Restraint | (~) % Impact on CAGR Forecast | Geographic Relevance | Impact Timeline |
|---|---|---|---|
| Indoor-air Emission Regulations | -0.7% | North America, Europe, developed Asia-Pacific markets | Short term (≤ 2 years) |
| Cosmetics and Consumer Bans | -0.4% | North America, Europe, with spillover to Asia-Pacific | Medium term (2-4 years) |
| Methanol Feedstock Price Volatility | -0.5% | Global, with particular impact on Asia-Pacific production | Medium term (2-4 years) |
| Source: Mordor Intelligence | |||
Indoor-air Emission Regulations
The Environmental Protection Agency (EPA)’s 2024 TSCA determination that 58 end uses pose unreasonable health risks accelerates the shift to ultra-low-emission boards, requiring immediate retooling at North American panel mills. Similar rules in Germany, Japan, and Australia tighten emission thresholds, pushing producers to install regenerative thermal oxidizers and to adopt scavenger resins. Compliance investments raise capex by up to USD 12 million for a 300,000 m³/year board line, squeezing margins for non-integrated laminators. Firms that moved early on Acrodur water-based systems now market emission-free credentials as a price-premium differentiator [2]BASF SE, “Acrodur Water-Based System for Wood Panels,” basf.com.
Methanol Feedstock Price Volatility
Methanol constitutes nearly 70% of cash production cost, so spikes linked to natural-gas shortages compress producer spreads. China’s coal-to-methanol route adds a carbon-price overlay, while Atlantic Basin plants contend with gas-curtailment risks during winter peaks. Hedging via multi-year off-take and on-site methanol units limits exposure, yet medium-term sensitivity remains at roughly USD 25/t operating EBITDA for each USD 50/t methanol swing. Emerging waste-to-methanol projects in Western Europe promise alternative feedstock streams that cut volatility and enhance Environmental, Social, and Governance (ESG) positioning.
*Our forecasts treat driver/restraint impacts as directional, not additive. The impact forecasts reflect baseline growth, mix effects, and variable interactions.
Formaldehyde Market Segment Analysis
By Derivative:
Urea Formaldehyde (UF) Dominance Faces POM InnovationUrea-formaldehyde retained 36.25% of the Formaldehyde market share in 2025, anchored by cost-efficient adoption across plywood, particleboard, and Medium Density Fiberboard (MDF) lines servicing affordable housing programs in Asia-Pacific. Polyoxymethylene (POM), in contrast, expands at a 6.05% CAGR by capturing demand for precision gearwheels and battery-package hardware where dimensional stability under thermal cycling is critical. Melamine-formaldehyde retains relevance for fire-resistant laminates, whereas phenol-formaldehyde persists in foundry and abrasive discs requiring higher thermal endurance. Hexamine demand plateaus but remains essential in military-grade explosives and industrial rubber vulcanization.
Continued innovation in catalyst coatings under Johnson Matthey’s FORMOX label delivers incremental gains—1.5% higher selectivity and 15°C lower reactor temperature—significantly benefiting POM economics in particular. Integrated resin producers diversify into paraformaldehyde and 1,4-butanediol to hedge against UF cyclicality, leveraging existing formaldehyde assets while ascending the value curve.



By End-user Industry:
Construction Leads, Automotive AcceleratesConstruction accounted for 49.95% of global volume in 2025, converting formaldehyde into resins that bond engineered wood, mineral wool, and insulation foams. The segment’s expansion stays tethered to urban-apartment demand and renovation cycles; even conservative forecasts foresee an incremental 32 million urban housing units in Asia-Pacific by 2029, ensuring throughput stability. The automotive and transportation vertical, however, posts the sharpest gains, advancing at 6.02% CAGR as stringent CO₂ fleet caps compel Original Equipment Manufacturers (OEMs) to down-weight vehicles.
Agriculture consumes formaldehyde through urea-formaldehyde fertilizers and poultry litter disinfectants, preserving yield and bio-security. Healthcare retains stable but modest tonnage; nonetheless, its criticality for vaccine inactivation generates pricing power resilient to macro cycles. Petrochemical intermediates use formaldehyde as a precursor into higher-margin aromatics and elastomers, broadening the customer slate for bulk producers.
By Production Process:
Silver Catalyst Dominance, Iron-Molybdenum InnovationThe silver catalyst route delivered 28.25% of world output in 2025, prized for operational reliability and flexible turn-down ratios that align with cyclical wood-panel demand. Yet iron-molybdenum systems, already at 5.92% CAGR, surpass silver on energy metrics, trimming gas usage by up to 12% per ton of formaldehyde and cutting CO₂ intensity by 0.28 t/t product. Emerging plants in Vietnam, Egypt, and Mexico select iron-molybdenum because capex parity and lower Operating Expenses (OPEX) hasten payback. Mixed-metal oxides remain a niche, used where ultrapure water requirements mandate lower ionic contamination.
Advancements focus on nano-structured molybdates that double lattice oxygen mobility, extending lifetime to 30 months before regeneration. Digital twin models now optimize reactor temperature gradients in real time, limiting by-product formic acid formation and protecting downstream hexamine yields.
Geography Analysis
APAC Formaldehyde Market
Asia-Pacific’s dual role as the production and consumption center cements its Formaldehyde market leadership, accounting for a 51.88% Formaldehyde market share in 2025 and tracking toward a 5.8% CAGR through 2031. China’s integrated methanol-to-formaldehyde lines near coal basins offer cost advantages, yet decarbonization goals are steering new investors toward gas-fed projects in Malaysia and Thailand. Government-backed urban housing in India unlocks continuous Medium Density Fiberboard (MDF) demand, prompting capacity additions near port cities to exploit methanol imports. Japan and South Korea specialize in electronics-grade formaldehyde, diverting high-purity output into semiconductor wet-etch and capacitor encapsulants.
North America Formaldehyde Market
North America posted flat to modest growth in 2024 but retains technological leadership in low-free formaldehyde (LFF) panels. United States facilities in Oregon and Georgia upgraded scrubbers and catalytic oxidizers to comply with the EPA National Emission Standards for Hazardous Air Pollutants without material production curtailment. Canada benefits from vast softwood resources, anchoring resin plants integrated with wood-panel giants in Quebec and British Columbia. Mexico’s proximity to United States auto plants stimulates POM off-take, positioning the Bajío region as a demand node.
Europe Formaldehyde Market
Europe’s policy stance on circularity and Volatile Organic Compound (VOC) limits restrains volume growth but skews the product mix toward high-margin low-emission resins. Germany and Poland together account for over 40% of European consumption, with German players investing in bio-methanol pilots to hedge carbon exposure. Nordic panel producers deploy lignin-substitution R&D yet continue purchasing formaldehyde for structural cores.
MEA and South America Formaldehyde Market
South America and the Middle East & Africa, though smaller, show rising penetration. Brazil’s construction rebound after economic downturns drives formaldehyde-based panel capacity in Rio Grande do Sul. Meanwhile, methanol-rich Saudi Arabia evaluates downstream formaldehyde-UF ventures aligned with Vision 2030 diversification targets.

Regulatory Landscape
Formaldehyde regulation continues to tighten across major consuming regions, with a focus on worker exposure and indoor-air emissions from composite wood and consumer products. In the United States, the Environmental Protection Agency (EPA) published a final TSCA risk evaluation in January 2025, determining that formaldehyde presents an unreasonable risk to human health. The assessment was driven by 58 of 63 conditions of use (50 occupational and 8 consumer), and the substance moved into the TSCA risk-management phase, which can result in a Section 6 rule affecting manufacture, processing, and downstream uses.
In December 2025, the EPA released an Updated Draft Risk Calculation Memorandum that revised elements of risk characterization, keeping compliance planning active for producers and users. In Europe, ECHA maintains harmonized CLP classification for formaldehyde (including Carc. 1B and Muta. 2). Ongoing REACH-related restrictions and product compliance requirements continue to influence resin formulations and testing regimes, particularly for applications tied to indoor air quality.
Value Chain Analysis
The formaldehyde value chain starts with methanol procurement, the dominant feedstock, and moves through oxidation-based production, including silver-catalyst and metal-oxide routes. Downstream, formaldehyde is converted into derivatives such as urea-formaldehyde, phenol-formaldehyde, melamine-formaldehyde, and polyoxymethylene, along with intermediates like paraformaldehyde and hexamine. Because formaldehyde has low value density, hazardous handling requirements, and limited shelf life, supply is typically organized around regional clusters, with on-purpose plants sited near resin, wood panel, and chemical customers. This structure keeps long-distance trade limited and makes local logistics, storage, and permitting central to reliability.
Distribution mostly flows into construction and furniture, where wood panels and laminates consume formaldehyde, alongside additional demand from automotive engineering plastics (POM) and agriculture (urea-formaldehyde fertilizers). Compliance and testing requirements increasingly shape operations: in February 2026, the US EPA proposed updates to composite wood product emission standards that add ISO 12460-2:2024 as a recognized quality control test method, reinforcing the role of certified testing labs and formal quality systems in the chain. Permitting and continuity of operations also affect regional supply, highlighted by a May 2026 Supreme Court of India decision that set aside certain National Green Tribunal closure orders for formaldehyde units lacking prior environmental clearance, allowing continued operation based on valid Consent to Establish and Consent to Operate while applications undergo review.
Competitive Landscape
The Formaldehyde market exhibits moderate concentration as the top five producers hold a significant portion of the global capacity, balancing vertical integration with geographic diversification strategies. BASF leverages captive methanol and multi-regional resin plants while marketing Acrodur, an acetaldehyde-based binder, to penetrate emission-restricted segments without cannibalizing core sales. Celanese Corporation integrates acetic anhydride chains, optimizing logistics across Texas, Nanjing, and Frankfurt assets to serve both UF and POM customers. Hexion Inc. capitalizes on proprietary POM catalyst technology and recently signed a renewable-methanol supply agreement that trims cradle-to-gate CO₂ by 28%. Competitive differentiation increasingly hinges on Greenhouse Gases (GHG) reduction, VOC compliance, and circular chemistry initiatives. Patent races emerge around high-selectivity molybdate catalysts and bio-methanol feed integration.
Formaldehyde Industry Leaders
Celanese Corporation
Hexion Inc.
Metafrax Chemicals
BASF
Bakelite Synthetics
- *Disclaimer: Major Players sorted in no particular order

Formaldehyde Market Companies Covered in this Report
- BASF
- Acron
- Bakelite Synthetics
- Balaji Formalin Pvt. Ltd.
- Capital Resin Corporation
- Celanese Corporation
- Dynea AS
- Ercros S.A.
- Foremark Performance Chemicals
- Frati Luigi S.p.A
- Hexion Inc.
- Kanoria Chemicals & Industries Ltd.
- Metafrax Chemicals
- Perstorp
- Simalin Chemical Industries Pvt Ltd

Market Opportunities and Future Outlook
Opportunities focus on compliant, low-emission resin systems and on upgrades that improve energy efficiency and reduce the footprint of methanol-to-formaldehyde assets. Regulatory-driven method changes create practical whitespace for suppliers that can certify performance and provide documentation across the wood-products ecosystem. For example, the US EPA proposal in February 2026 to update composite wood product emission standards by incorporating ISO 12460-2:2024 lifts demand for producers and resin formulators that can support tighter quality control, traceability, and customer audit requirements.
A second opportunity is plant-level decarbonization and efficiency retrofits that lower unit costs and improve acceptance in carbon- and VOC-sensitive markets, including heat recovery and electrification pathways. Peer-reviewed process studies referenced in the evidence base describe optimization approaches, including organic Rankine cycle energy recovery, that can reduce global warming potential (up to 29% in studied configurations) while improving production rates (up to 18.7%). These findings support investment cases for brownfield improvements where compliance capex and energy costs are already central decision variables. Over a longer horizon, R&D continues on alternative production routes, including CO2 or syngas-based pathways, but near-term commercial focus remains on improving established methanol-based FORMOX-type operations and enabling lower-free-formaldehyde solutions for wood panels and other indoor applications.
Recent Industry Developments in Formaldehyde Market
- May 2026: Celanese Corporation announced price increases across the acetyl chain, including formaldehyde, effective immediately or as contracts allow. The change highlights active price management in a cost- and logistics-sensitive chain where integrated producers use network optimization to protect margins and maintain supply reliability for resin and intermediate customers.
- December 2025: Hexion Inc. finalized the sale of its U.S. Gulf Coast formalin business to Ancala, forming a new entity, Valentra. The divestment reshapes regional supply positioning while signaling portfolio shifts by established participants away from traditional formalin assets and toward higher-value, technology-driven materials.
- September 2024: Kanoria Chemicals & Industries Ltd. expanded formaldehyde production at Ankleshwar, Gujarat, adding a metal oxide technology plant with an investment of INR 56.06 crore (USD 6.7 million). The added capacity strengthens local supply for construction, automotive, agriculture, and chemical customers and reflects ongoing regional build-out near downstream demand centers.


Formaldehyde Market Report Scope and Research Methodology
Market Definition and Coverage
For this study, the formaldehyde market is defined as the demand and supply of formaldehyde produced and traded for downstream industrial use, captured as volume in tons and mapped across major producing and consuming regions.
Scope exclusions: The sizing excludes internal captive transfers that are not priced and marketed, and it also excludes downstream resin and finished wood-product revenues to avoid double counting.
Segments Covered in This Report
- By Derivative
- Urea Formaldehyde (UF)
- Phenol Formaldehyde (PF)
- Melamine Formaldehyde (MF)
- Polyoxymethylene (POM)
- Hexamine
- Other Derivatives (MDI, 1,4-Butanediol, Para-formaldehyde)
- By End-user Industry
- Construction
- Automotive
- Agriculture
- Healthcare
- Chemicals and Petrochemicals
- Other End-user Industries (Paints, Textiles and Others, etc.)
- By Production Process
- Silver Catalyst (Formox) Process
- Iron-Molybdenum Catalyst Process
- Metal Oxide Mixed Catalyst Process
- By Geography
- Asia-Pacific
- China
- Japan
- India
- South Korea
- ASEAN Countries
- Rest of Asia-Pacific
- North America
- United States
- Canada
- Mexico
- Europe
- Germany
- United Kingdom
- France
- Italy
- Spain
- Russia
- NORDIC Countries
- Rest of Europe
- South America
- Brazil
- Argentina
- Rest of South America
- Middle East and Africa
- Saudi Arabia
- South Africa
- Rest of Middle East and Africa
- Asia-Pacific
Data Sources, Market Sizing, and Validation
Desk Research
Desk research was used to set the factual base for the model, especially for methanol feedstock linkages, regional production footprint, and end-use pull from wood panels and construction activity. We relied on public sources such as USGS chemical statistics, UN Comtrade trade data, and US EPA and ECHA documentation for exposure and emissions references. Where relevant for upstream cost signals, we also referenced IEA energy and petrochemical indicators.
To keep assumptions grounded, we reviewed annual reports and investor decks of major producers and downstream panel manufacturers, along with association publications and reputable industry press that track capacity additions, maintenance shutdowns, and regulatory changes. We also used patent databases selectively to understand catalyst and process shifts that can change yields and typical operating rates. The sources named here are illustrative, and many other public references were used for data collection, cross-checking, and clarification.
Primary Interviews and Surveys
Primary work focused on validating the drivers of shipped volumes by region, and on how demand is behaving in the biggest consuming chains, including wood-based panels, laminates, and molded plastics. We spoke with producers, distributors, and large industrial buyers, then used follow-up calls to confirm operating rate ranges, trade flow realities, and near-term price and availability signals across APAC, EMEA, and the Americas.
Distribution of primary research fieldwork respondents
| Company type | Respondent position | Region |
|---|---|---|
| Top tier: 30% | CXOs: 16% | APAC: 37% |
| Mid tier: 51% | Functional/Unit leaders: 40% | EMEA: 36% |
| Smaller Players: 19% | Managers: 44% | Americas: 27% |
Market-Sizing & Forecasting
Sizing started with a top-down build that reconstructs formaldehyde demand from the regional derivative mix and the treated consumption pool in key uses, expressed back into tons of formaldehyde-equivalent volumes. We then corroborated the result with selective bottom-up approximations, such as sample plant capacity by region, typical operating rates discussed in interviews, and a reasonableness check using traded volumes when formaldehyde moves across borders.
The inputs that mattered most were regional capacity additions and closures, utilization patterns in integrated methanol-to-formaldehyde sites, derivative share shifts (for example, urea and phenolic resins versus other chemical intermediates), construction and furniture activity signals that influence panel output, and regulatory tightening that can change product mix and substitution. Forecasts were built using scenario analysis. In the base case, we used the consensus view from primary experts on utilization recovery, downstream panel production growth, and the pace of new capacity ramp-ups. Where bottom-up signals were incomplete in smaller countries, we filled gaps using proxy indicators such as per-capita panel consumption, import dependence, and adjacency to known production hubs.
Data Validation & Update Cycle
Validation was done by comparing model totals against independent signals, including capacity announcements, regional operating-rate discussions from interviews, and whether implied growth could be supported by downstream wood panel and construction indicators. Outliers were flagged, assumptions were revisited, and we ran a second review to confirm the final numbers still matched the market definition and unit logic.
Reports are refreshed annually, and we also run interim checks when a material event occurs, such as a large plant outage, a major new line start-up, or a policy change affecting emissions and product use. Before delivery, we recheck the latest public updates and re-run the model so clients get an updated view based on the most current inputs.
Mordor Intelligence's Formaldehyde Market Sizing Compared With Other Published Estimates
Published market sizes for formaldehyde can look far apart because firms do not always measure the same thing, and some totals are value-based while others are volume-based without clearly stating the conversion logic. Differences also arise when some estimates include downstream resin revenues or count derivative chains in a way that creates overlap.
In our work, the key gap drivers were the unit choice and what is counted as formaldehyde versus downstream products, along with how operating rates and trade flows are treated in regions with large integrated sites. When forecasts are set, some publishers assume aggressive capacity ramp-ups or uniform demand growth, while others are more conservative on construction-linked uses, which can shift totals quickly. The spread is most evident when the model is kept in tons and excludes resin revenue stacking, a scope choice applied by Mordor Intelligence.
Benchmark comparison
| Source | Market Size | Gaps in Research Methodology |
|---|---|---|
| Mordor Intelligence | USD 23.05 M (2025) | |
| Industry Publisher A | USD 8.84 B (2025) | Value-based sizing in USD and may mix formaldehyde and derivative value pools, which can pull in resin pricing effects that do not translate cleanly to tons. |
| Industry Publisher B | USD 7.92 B (2022) | Uses an earlier base year and revenue scope, and the way derivatives and end-use applications are grouped can lead to different inclusion rules and currency timing versus a volume-led build. |
The table indicates that most of the variance comes from measuring revenue versus physical volume, and from whether downstream value is included inside the total. By keeping the scope tied to formaldehyde-equivalent tons and cross-checking with capacity, utilization, and trade reality checks, the final estimate remains traceable to inputs that can be re-tested and updated each year.


Key Questions Answered in the Report
What is the current Formaldehyde Market size?
The Formaldehyde market size was 24.21 Million tons in 2026 and is forecast to reach 30.98 Million tons by 2031.
Which region leads the formaldehyde market?
Asia-Pacific dominates with 51.88% global share in 2025 and is also the fastest-growing region at a 5.8% CAGR through 2031.
Which derivative is growing fastest within the Formaldehyde market?
Polyoxymethylene records the highest derivative CAGR at 6.05% during 2026-2031 due to rising demand for lightweight automotive and electronics components.
How are regulations affecting formaldehyde demand in construction?
Tighter indoor-air emission rules in the United Sttaes and Europe push panel makers toward low-free formaldehyde resins and emission-control technologies, increasing production costs but preserving demand for compliant products.
Why is methanol price volatility a challenge for formaldehyde producers?
Methanol accounts for up to 70% of production cost; price swings directly erode margins, prompting producers to secure long-term supply contracts and explore alternative feedstocks like waste-derived methanol.
Page last updated on:





