Glucaric Acid Market Size and Share
Market Overview
| Study Period | 2021 - 2031 |
|---|---|
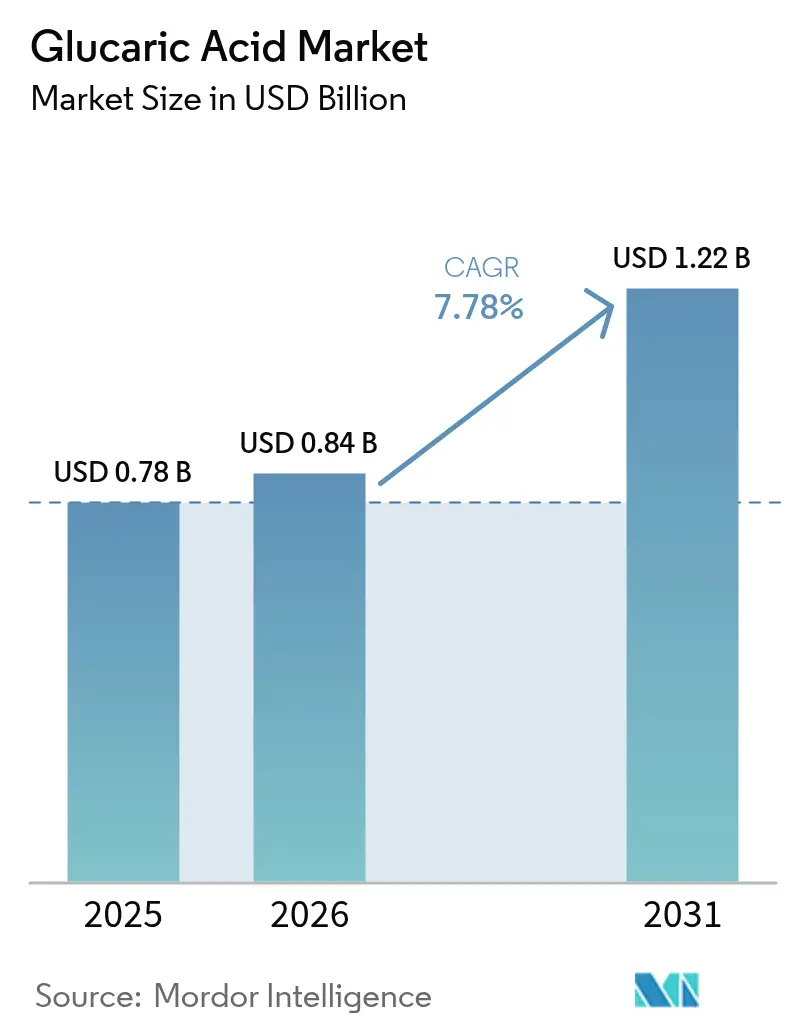
| Market Size (2026) | USD 0.84 Billion |
| Market Size (2031) | USD 1.22 Billion |
| Growth Rate (2026 - 2031) | 7.78% CAGR |
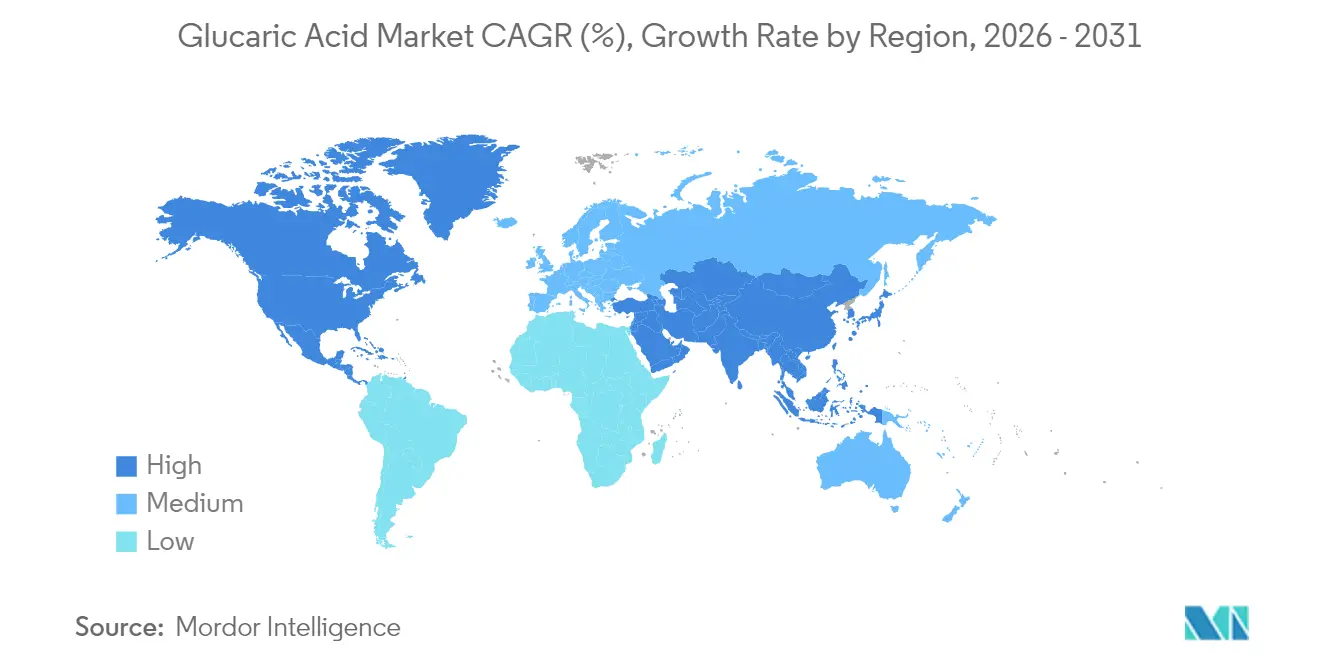
| Fastest Growing Market | Asia Pacific |
| Largest Market | North America |
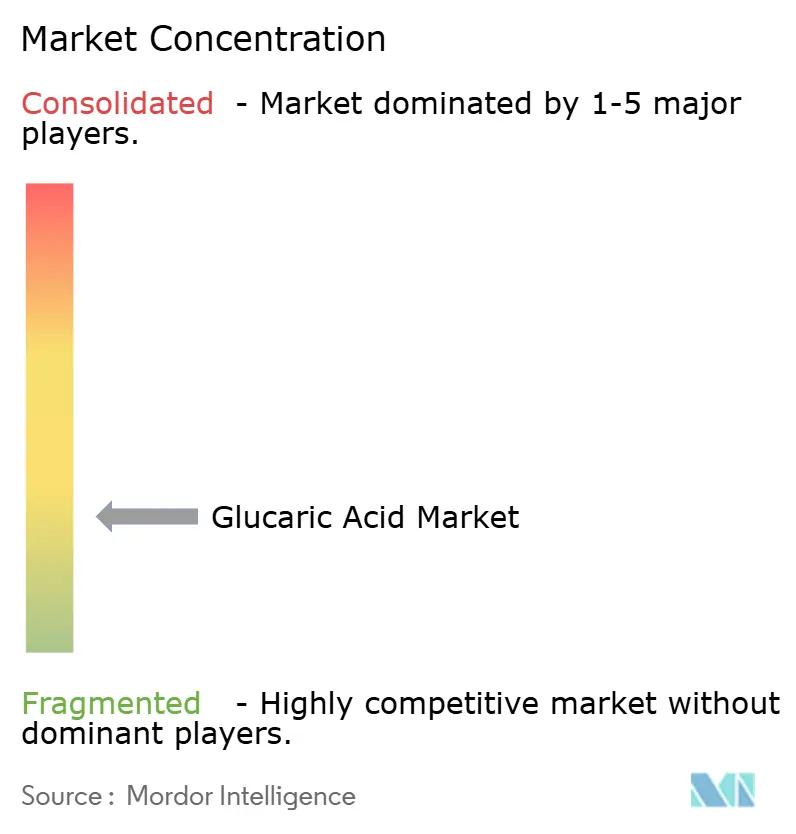
| Market Concentration | Low |
Major Players
*Disclaimer: Major Players sorted in no particular order Image © Mordor Intelligence. Reuse requires attribution under CC BY 4.0. |
|
Glucaric Acid Market Analysis by Mordor Intelligence
The glucaric acid market size is expected to grow from USD 0.78 billion in 2025 to USD 0.84 billion in 2026 and is forecast to reach USD 1.22 billion by 2031 at 7.78% CAGR over 2026-2031. Driven by stringent environmental regulations and a global push for sustainable chemical alternatives, the glucaric acid market is gaining significant momentum. Key drivers of this upward trend include advancements in biotechnology and an increasing application in pharmaceuticals and food processing. The growing focus on reducing dependency on petrochemical-based products further supports the market's expansion. Purified forms currently lead the market, showcasing their commercial maturity and widespread application. Yet, derivatives aimed at the health supplement segments are on the rise, with expectations of a faster adoption rate in the near future. The increasing consumer awareness regarding health and wellness is driving this segment's growth. While detergents hold the top spot in applications, there's a notable surge in food-grade uses, driven by a growing demand for clean-label and functional ingredients. This trend aligns with the broader shift toward transparency and sustainability in food production. Mature economies, bolstered by established industrial infrastructures and supportive regulations, still command the largest market share. However, the Asia-Pacific region is making waves as the fastest-growing area, propelled by swift industrialization and robust policy initiatives championing environmental sustainability. The region's expanding middle-class population and rising disposable incomes further contribute to the market's growth. With innovation at the forefront and regional dynamics in play, the market is poised for a transformative evolution.
Key Report Takeaways
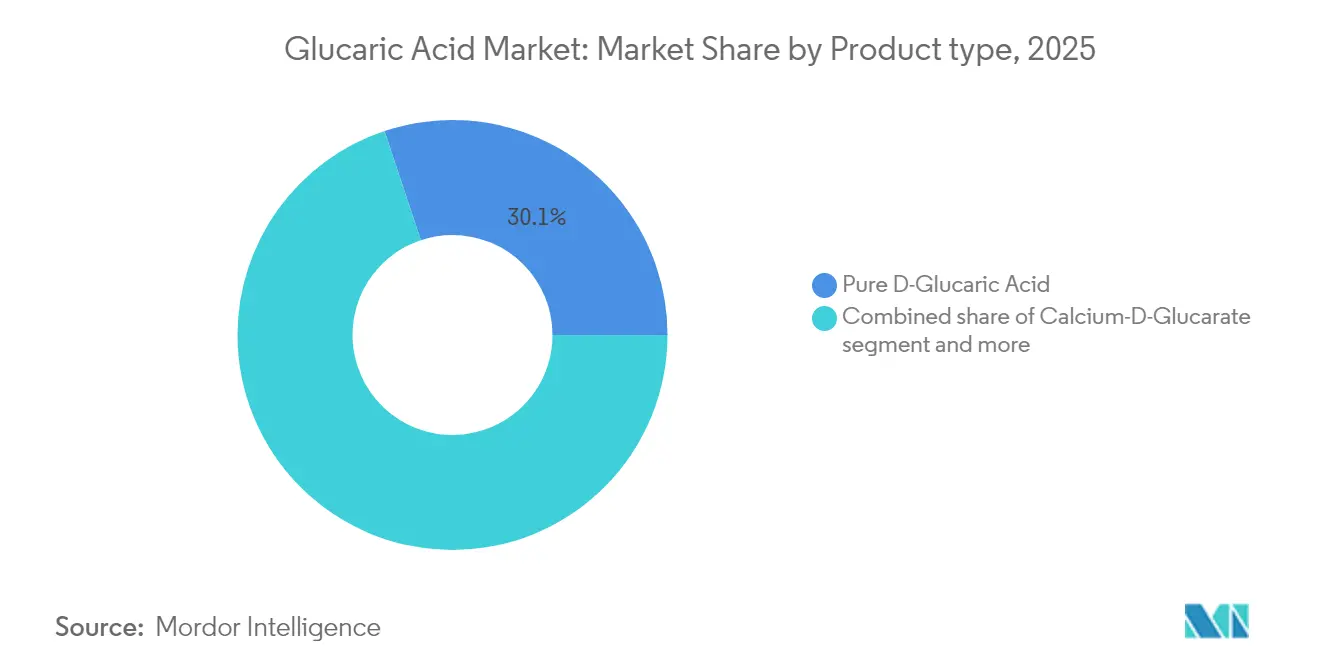
- By product type, pure D-glucaric Acid led with 30.12% revenue share of the glucaric acid market in 2025, while calcium-D-glucarate is projected to expand at a 9.01% CAGR to 2031.
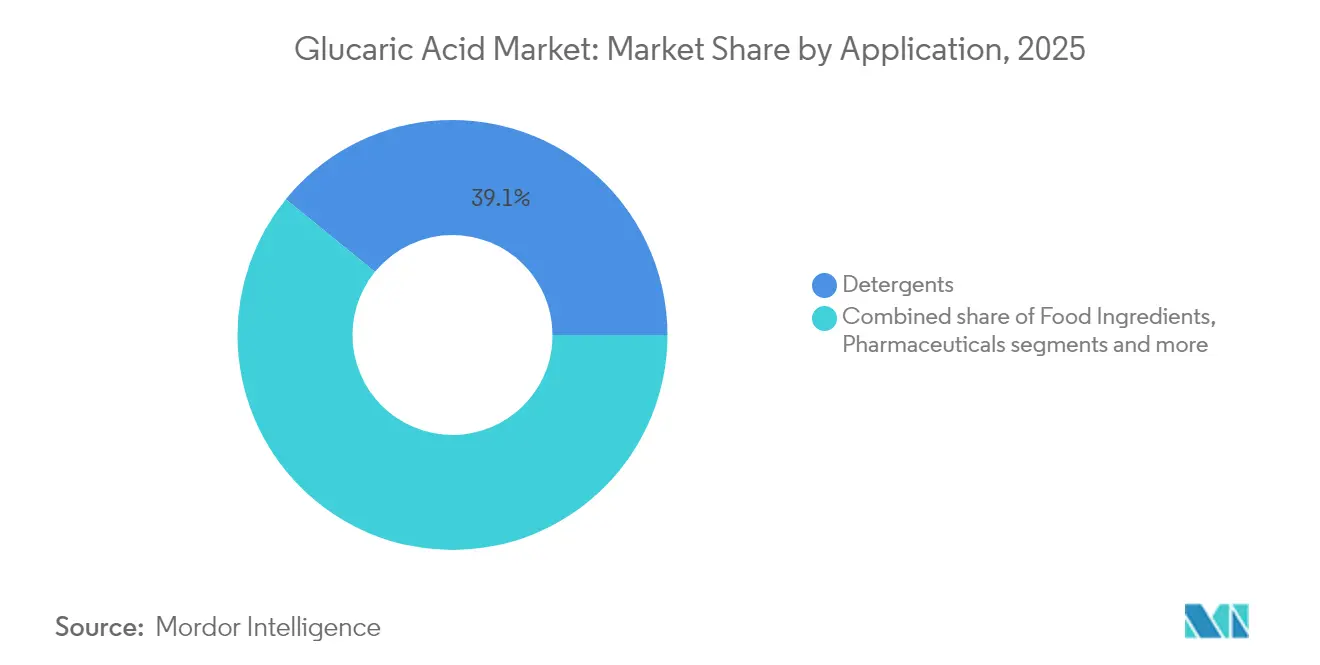
- By application, detergents accounted for 39.12% of the glucaric acid market size in 2025; the food ingredients segment is advancing at an 8.41% CAGR through 2031.
- By geography, North America held 30.74% of the glucaric acid market share in 2025, whereas Asia-Pacific records the fastest growth at 9.21% CAGR to 2031.
Note: Market size and forecast figures in this report are generated using Mordor Intelligence’s proprietary estimation framework, updated with the latest available data and insights as of 2026.
Global Glucaric Acid Market Trends and Insights
Drivers Impact Analysis*
| Driver | (~) % Impact on CAGR Forecast | Geographic Relevance | Impact Timeline |
|---|---|---|---|
| Consumer preference for non-toxic, allergen-free additives across industries | +1.8% | Global, with early adoption in North America and European Union | Medium term (2-4 years) |
| Surging consumer focus on detox and metabolic health | +1.2% | Global, concentrated in developed markets | Long term (≥ 4 years) |
| Increasing regulatory push for phosphate-free detergents | +2.1% | EU and North America core, expanding to Asia-pacific | Short term (≤ 2 years) |
| Rising demand for bio-based chemicals as sustainable alternatives | +1.5% | Global, with regulatory support in developed regions | Medium term (2-4 years) |
| Industrial shift towards safer and non-corrosive acid alternatives | +1.3% | Global, with industrial concentration in North America and Asia-Pacific | Medium term (2-4 years) |
| Wide application of glucaric acid in detergent and cleaning products | +0.9% | Global, driven by European Union regulations and North America adoption | Short term (≤ 2 years) |
| Source: Mordor Intelligence | |||
Consumer Preference for Non-Toxic, Allergen Free Additives Across Industries
The increasing demand for non-toxic, allergen-free additives is transforming chemical procurement strategies across industries, with glucaric acid emerging as an alternative to conventional chelating agents. The Environmental Protection Agency (EPA)'s Safer Choice Standard amendments, taking effect in August 2024, mandate improved ingredient transparency and lifecycle analysis for product certification, supporting the adoption of bio-based alternatives [1]Source: United States Environmental Protection Agency, "Safer Choice," epa.gov. This aligns with the European Union's Directive 2024/825, which requires verification of environmental claims and third-party certification for sustainability labels, eliminating unsubstantiated "eco-friendly" marketing claims. These regulatory changes provide advantages to glucaric acid manufacturers who can demonstrate quantifiable environmental benefits. Industrial purchasers prioritize non-toxic additives to minimize liability risks and meet corporate sustainability goals, expanding their evaluation criteria beyond cost factors. The pharmaceutical industry's use of calcium glucarate in metabolic health products illustrates how safety considerations influence pricing strategies, as supported by clinical studies that confirm its effectiveness in glucose management.
Surging Consumer Focus on Detox and Metabolic Health
The increasing prevalence of metabolic health conditions has generated substantial market demand for glucaric acid derivatives, particularly calcium glucarate. This growth is primarily attributed to consumers' heightened awareness of metabolic health management and their pursuit of scientifically validated natural alternatives to conventional pharmaceutical interventions. Glucaric acid compounds have demonstrated significant potential in modulating GLP-1 response pathways, positioning them as credible alternatives to prescription medications within the expanding weight management market. Healthcare institutions are increasingly integrating these compounds into their treatment protocols as cost-effective interventions for various metabolic disorders. The concurrent demographic shifts toward aging populations and the rising incidence of diabetes create a strong market foundation for glucaric acid-based health solutions, particularly in preventive healthcare and metabolic support applications. For instance, according to World Bank data, in 2023, Japan reported the highest proportion of individuals aged 65 or older at 30% of its population, with Italy following at 24% [2]Source: World Bank, "Population ages 65 and above (% of total population), "worldbank.org.
Increasing Regulatory Push for Phosphate-Free Detergents
Phosphate restrictions are changing detergent formulations and driving the adoption of glucaric acid. The European Union has updated its Detergent Regulation (EC No 648/2004) to include product passports, digital labeling, and stricter biodegradability standards, which benefits bio-based chelating agents [3]Source: European Parliament, "Revision of Regulation (EC) 648/2004 on detergents," europarl.europa.eu. The European Sustainable Phosphorus Platform's systematic initiatives for phosphorus recovery and recycling have fundamentally established glucaric acid as a sustainable alternative that effectively minimizes phosphorus discharge into water systems. The implementation of restrictions on animal testing for detergent safety assessment has further emphasized the significance of glucaric acid, particularly due to its well-documented safety profile. Industrial cleaning operations are required to maintain strict compliance with wastewater regulations while ensuring optimal cleaning effectiveness, positioning glucaric acid as an essential component in modern formulations. The strategic integration of membrane bioreactor systems with AI optimization technologies in wastewater treatment facilities has expanded glucaric acid's functional capabilities in improving treatment efficiency, establishing it as a fundamental element in contemporary wastewater management systems.
Rising Demand for Bio-Based Chemicals as Sustainable Alternatives
Industries are transitioning toward bio-based chemicals in response to stringent carbon reduction requirements and supply chain optimization needs, establishing glucaric acid as a viable alternative to petroleum-based chemicals. Kalion Inc.'s fermentation-based production methodology has received recognition through the EPA's Green Chemistry Award, demonstrating superior product purity and environmental sustainability compared to conventional methods. The integration of CRISPR-Cas systems with metabolic engineering has significantly enhanced microbial production efficiency, reduced operational costs, and improved yield consistency. Major corporations, exemplified by Merck KGaA's commitment to reduce Scope 1 and 2 greenhouse gas emissions by 50% by 2030, are implementing sustainable practices. The convergence of advanced biotechnology, increasing environmental regulations, and corporate sustainability commitments is expected to drive substantial growth in the glucaric acid market, particularly as industries seek sustainable alternatives to traditional petroleum-based chemicals.
Restraints Impact Analysis*
| Restraint | (~) % Impact on CAGR Forecast | Geographic Relevance | Impact Timeline |
|---|---|---|---|
| Complex and energy-intensive purification process | -1.4% | Global, particularly affecting emerging market producers | Medium term (2-4 years) |
| Price sensitivity in mass-market | -0.9% | Asia-Pacific and emerging markets primarily | Short term (≤ 2 years) |
| Low solubility in organic solvents | -0.7% | Global, affecting specialized industrial applications | Long term (≥ 4 years) |
| Patent constraints in key synthesis technologies | -1.1% | Global, with particular impact on new market entrants | Medium term (2-4 years) |
| Source: Mordor Intelligence | |||
Complex and Energy-Intensive Purification Process
Stringent purification requirements for pharmaceutical and food-grade glucaric acid restrain market growth, particularly affecting smaller biotechnology companies. Traditional purification methods demand multiple crystallization steps and strict impurity control measures. High energy costs in certain regions limit purification processes, benefiting only producers with access to affordable clean energy. Although advanced technologies such as electrodialysis and membrane separation present viable alternatives, these methodologies necessitate considerable capital expenditure and specialized technical expertise. The inherent complexity of maintaining standardized product quality across diverse feedstock materials and fermentation parameters creates a competitive advantage for established manufacturing entities. Furthermore, the regulatory framework established by the Food and Drug Administration (FDA) and European Medicines Agency (EMA) mandates comprehensive documentation and validation protocols, presenting substantial operational barriers for smaller-scale producers. These combined factors significantly influence the market's growth trajectory and operational dynamics within the glucaric acid industry.
Price Sensitivity in Mass-Market
The elevated production costs of glucaric acid present significant market constraints, particularly in high-volume applications across emerging economies where financial considerations predominantly influence purchasing decisions over environmental sustainability initiatives. The fermentation-based manufacturing methodology necessitates substantial capital investments and operational expenditures compared to conventional chemical synthesis processes, thereby diminishing its economic feasibility in commodity-scale applications. The absence of comprehensive regulatory frameworks in developing regions fails to provide adequate incentives for bio-based alternatives, subsequently restricting market penetration of premium-priced sustainable products. Conventional chemical manufacturers maintain their market position by offering economically competitive alternatives that satisfy fundamental functional requirements, although these may not fully comply with stringent environmental or safety protocols. The overall price competitiveness is additionally impacted by international currency fluctuations and volatility in raw material costs, particularly affecting manufacturers who rely heavily on imported feedstock materials and specialized fermentation equipment.
*Our forecasts treat driver/restraint impacts as directional, not additive. The impact forecasts reflect baseline growth, mix effects, and variable interactions.
Segment Analysis
By Product Type: Pure Forms Drive Premium Applications
In 2025, pure D-glucaric acid commands a 30.12% share of the market, driven by its critical role in pharmaceuticals, industry, and research, where purity is paramount. This segment's expansion is bolstered by established production techniques and adherence to regulations, especially in water treatment. Here, approvals under the Toxic Substances Control Act (TSCA) confer a competitive edge. The demand for pure D-lucaric acid is further supported by its versatility in applications, ranging from chemical intermediates to environmentally friendly solutions, which align with the growing emphasis on sustainability. Additionally, advancements in production technologies are expected to enhance efficiency and reduce costs, further driving their adoption across various segments. Meanwhile, calcium D-glucarate is on track to expand at a 9.01% CAGR through 2031, fueled by its pharmaceutical uses and clinical research focus on metabolic health. Its calcium salt form boasts superior bioavailability and stability over its free acid counterpart, making it a prime choice for dietary supplements. The increasing consumer awareness regarding health and wellness is also contributing to the rising demand for calcium-D-glucarate in dietary formulations.
Potassium and sodium-D-glucarate variants find their primary application in the industrial segments, notably in detergent formulations where both solubility and pH stability are paramount. These variants are also gaining traction due to their role in enhancing the performance of cleaning agents, particularly in hard water conditions. D-glucaric acid-1,4-lactone carves out a specialized niche in polymer chemistry and synthesis reactions. Its unique chemical properties make it an essential component in high-performance materials and advanced manufacturing processes. The 'other' category encompasses a range of emerging derivatives and tailored formulations for distinct industrial applications. This market segmentation indicates a transition from fundamental chemical uses to premium pharmaceutical and specialty products. Biotechnology firms are at the forefront, crafting derivatives that not only enhance performance but also fetch premium prices. The ongoing innovation in derivative development is expected to open new avenues for market growth, particularly in high-value applications such as drug delivery systems and advanced industrial processes.


By Application: Detergents Lead While Pharmaceuticals Accelerate
In 2025, detergents command a leading 39.12% market share, driven by manufacturers' shift towards phosphate-free formulations and bio-based chelating agents. Responding to the European Union's new detergent regulations mandating product passports and elevated biodegradability standards, manufacturers are increasingly drawn to glucaric acid-based formulations. Not only does glucaric acid adeptly bind to metal ions, ensuring top-notch cleaning performance, but it also aligns with stringent environmental benchmarks. This makes it a favored choice among industrial cleaning firms, allowing them to meet wastewater discharge regulations without compromising on cleaning efficacy. Additionally, the growing consumer preference for environmentally friendly and sustainable cleaning products further propels the adoption of glucaric acid in detergent formulations, as companies aim to cater to this demand while adhering to regulatory requirements.
Projected to expand at an 8.41% CAGR through 2031, the food ingredients segment sees food manufacturers leaning towards natural preservatives and functional additives in their processed offerings.Owing to the FDA's expedited GRAS notification system, more companies are venturing into glucaric acid-based food ingredients. Notably, calcium glucarate is in the spotlight for its metabolic function benefits. This compound is increasingly being incorporated into dietary supplements and fortified foods, addressing the rising consumer focus on health and wellness. While the pharmaceutical segment currently handles smaller glucaric acid volumes, it enjoys premium pricing, underscoring the compound's recognized therapeutic advantages in enhancing metabolic health and detoxification. The pharmaceutical industry's ongoing research into glucaric acid's potential applications in chronic disease management and toxin elimination is expected to further drive its demand in the coming years.
Geography Analysis
In 2025, North America commands a dominant 30.74% market share, bolstered by its robust biotechnology infrastructure, stringent environmental regulations, and a broad embrace of sustainable chemistry. Major companies in the region are pioneering fermentation-based production technologies and obtaining regulatory nods for water treatment. Modifications to the Safer Choice Standard and heightened environmental compliance demands fuel a steady appetite for bio-based alternatives. Meanwhile, the region's well-established pharmaceutical and specialty chemical segments present lucrative market opportunities. Additionally, the presence of advanced research facilities and a strong focus on innovation further strengthens North America's position in the market. The region's ability to adapt to evolving regulatory landscapes and its emphasis on sustainability make it a key player in driving the adoption of bio-based solutions.
Asia-Pacific is on track to achieve the highest growth trajectory, boasting a 9.21% CAGR through 2031. This surge is fueled by significant investments in research and development facilities, a rising embrace of bio-based chemicals, and an escalating demand from the pharmaceutical sector. Government-backed initiatives championing sustainable chemical production, heightened environmental awareness among manufacturers, and a broadened scope of applications from food preservation to personal care further bolster the region's growth. The region also benefits from its large and rapidly growing population, which drives demand for sustainable products across various industries. Furthermore, the increasing presence of global players and collaborations with local manufacturers are accelerating the development and adoption of bio-based technologies in Asia-Pacific.
European markets, navigating under stringent REACH regulations and circular economy initiatives, are witnessing a surge in bio-based chemicals, spurred by a growing consumer inclination towards sustainability. The region's strong regulatory framework ensures consistent quality and safety standards, which further encourage the adoption of bio-based alternatives. Additionally, Europe’s focus on reducing carbon emissions and achieving climate goals aligns with the increasing demand for sustainable products. Meanwhile, South America and the Middle East and Africa are in the nascent stages of adoption, driven by their burgeoning agricultural sectors, escalating investments in bio-refineries, and a concerted effort to diminish reliance on petroleum for chemical production. These regions are also exploring opportunities to leverage their abundant natural resources to develop bio-based chemicals, which could position them as emerging players in the global market.

Competitive Landscape
The glucaric acid market is fragmented, with key players numerous key players like Merck KGaA, Kalion Inc., Haihang Group, Cayman Chemical Company, and NutriScience Innovations, LLC dominating the market. These companies use their proprietary fermentation technologies to achieve better product purity and production efficiency. Companies integrate their operations across feedstock sourcing, fermentation, and purification processes, which creates barriers for new market entrants.
Companies use advanced synthetic biology tools like CRISPR-Cas systems and metabolic engineering to improve their production processes. The industry sees increased formation of strategic partnerships and technology licensing agreements as companies aim to access specialized capabilities without heavy investment in infrastructure. New market opportunities emerge in AI-optimized wastewater treatment and advanced polymer additives, where glucaric acid's properties enable premium pricing.
The current patent landscape shapes market competition significantly. While established companies hold patents for key synthesis technologies, new biotechnology firms develop alternative production methods. This dynamic creates a balanced market where innovation continues through different technological approaches, allowing both established and emerging players to maintain their market positions.
Glucaric Acid Industry Leaders
-
Merck KGaA
-
Kalion Inc.
-
Haihang Group
-
Cayman Chemical Company
-
NutriScience Innovations, LLC
- *Disclaimer: Major Players sorted in no particular order

Recent Industry Developments
- November 2023: Solugen expanded its biobased chemical production through a partnership with Archer-Daniels-Midland Company. The new plant in Marshall, Minnesota, produces dextrose, which Solugen uses as a feedstock. The process co-produces hydrogen peroxide and the organic acids glucaric and gluconic acid.
- November 2021: Kalion completed its first full-scale glucaric acid production at Evonik's facility in Europe. The completion of the custom manufacturing campaign enables the company to fulfill existing customer commitments and meet market demand.


Research Methodology Framework and Report Scope
Market Definitions and Key Coverage
We define the global glucaric acid market as the annual manufacturer-level revenue generated from D-glucaric acid and its common salts (calcium, potassium, sodium) that are sold for detergent, food, nutraceutical, corrosion-control, and de-icing uses, whether produced by chemical oxidation or bio-fermentation. Our value series is quoted net of distributor mark-ups, which keeps scope aligned across regions.
Scope Exclusion: Upstream glucose feedstocks, downstream polymer derivatives, and laboratory-only research volumes are excluded.
Segmentation Overview
-
By Product Type
- Pure D-Glucaric Acid
- Calcium-D-Glucarate
- Potassium/Sodium-D-Glucarate
- D-Glucaric Acid-1,4-Lactone
- Others
-
By Application
- Food Ingredients
- Detergents
- Pharmaceuticals
- Others
-
By Geography
-
North America
- United States
- Canada
- Mexico
- Rest of North America
-
Europe
- Germany
- United Kingdom
- Italy
- France
- Spain
- Netherlands
- Rest of Europe
-
Asia-Pacific
- China
- India
- Japan
- Australia
- Rest of Asia-Pacific
-
South America
- Brazil
- Rest of South America
-
Middle East and Africa
- South Africa
- Saudi Arabia
- United Arab Emirates
- Rest of Middle East and Africa
-
North America
Detailed Research Methodology and Data Validation
Primary Research
Mordor analysts interviewed bio-fermentation engineers in the United States, purchasing heads at European detergent blenders, and nutraceutical distributors across Asia-Pacific. The conversations clarified average selling prices, inclusion rates, and regulatory timing, and we folded those insights back into our assumptions.
Desk Research
Our team began with publicly available datasets from the US EPA Safer Choice registry, the European Chemicals Agency substance files, UN Comtrade trade codes, and peer-reviewed output in ACS Sustainable Chemistry, which together anchor baseline volumes and allowable applications. We layered in subscription content from D&B Hoovers, Questel patent analytics, and Dow Jones Factiva news flows to triangulate company revenues, process yields, and capacity start-ups. These named sources are illustrative; many other references informed validation.
Market-Sizing & Forecasting
We first applied a top-down reconstruction that links global installed capacity, typical utilization, and net exports to estimate 2025 demand. Selective bottom-up supplier revenue checks confirmed consistency. Five variables, phosphate-free detergent penetration, average calcium D-glucarate dosage in supplements, fermentation yield per ton of glucose, bio-based price premium, and strength of EPA / EU directives, feed a multivariate regression that projects value through 2030. When a plant's output was undisclosed, we benchmarked against similar organic acids and adjusted the delta after expert review.
Data Validation & Update Cycle
Every model pass moves through variance checks against historic organic-acid price indices and a double analyst review. Reports refresh yearly, and we trigger interim updates when capacity or regulatory events move assumptions by five percent or more before sharing the latest view with clients.
Why Mordor's Glucaric Acid Baseline Stands Firm
Published estimates often diverge because firms adopt different product mixes, reference years, and currency treatments. We flag these gaps so readers see why totals vary.
Large spreads appear when other publishers roll experimental derivatives into core sales, ignore downtime in Chinese plants, or convert currencies at spot rates. Our study, anchored in 2025 data and refreshed annually, avoids those pitfalls.
Benchmark comparison
| Market Size | Anonymized source | Primary gap driver |
|---|---|---|
| USD 0.78 B (2025) | Mordor Intelligence | |
| USD 1.12 B (2023) | Regional Consultancy A | Included low-purity technical grades and no currency averaging |
| USD 1.34 B (2025) | Global Consultancy B | Based on a single capacity expansion without trade reconciliation |
| USD 1.14 B (2024) | Trade Journal C | List-price averages, volumes not weighted |
This comparison shows that, by selecting a disciplined scope, tracking key variables, and refreshing data on a set cadence, Mordor Intelligence delivers a balanced baseline decision-makers can rely on.


Key Questions Answered in the Report
What is the current size of the glucaric acid market and how fast is it growing?
The market stands at USD 0.84 billion in 2026 and is projected to reach USD 1.22 billion by 2031, reflecting a 7.78% CAGR over 2026-2031.
Which region holds the largest glucaric acid market share?
North America leads with 30.74% share in 2025, supported by EPA regulations and a well-established biotechnology base.
Why is Calcium-D-Glucarate the fastest-growing product segment?
Clinical studies linking calcium glucarate to metabolic health benefits are driving nutraceutical adoption, pushing the segment toward a 9.01% CAGR.
How do new detergent regulations affect demand?
EU and US phosphate bans and digital product passports create structural incentives for formulators to switch to glucaric acid, sustaining near-term growth in cleaning applications.
Page last updated on:


