Market Overview
| Study Period | 2020 - 2031 |
|---|---|
| Market Size (2026) | USD 9.46 Billion |
| Market Size (2031) | USD 11.35 Billion |
| Growth Rate (2026 - 2031) | 3.72% CAGR |
| Fastest Growing Market | Asia Pacific |
| Largest Market | North America |
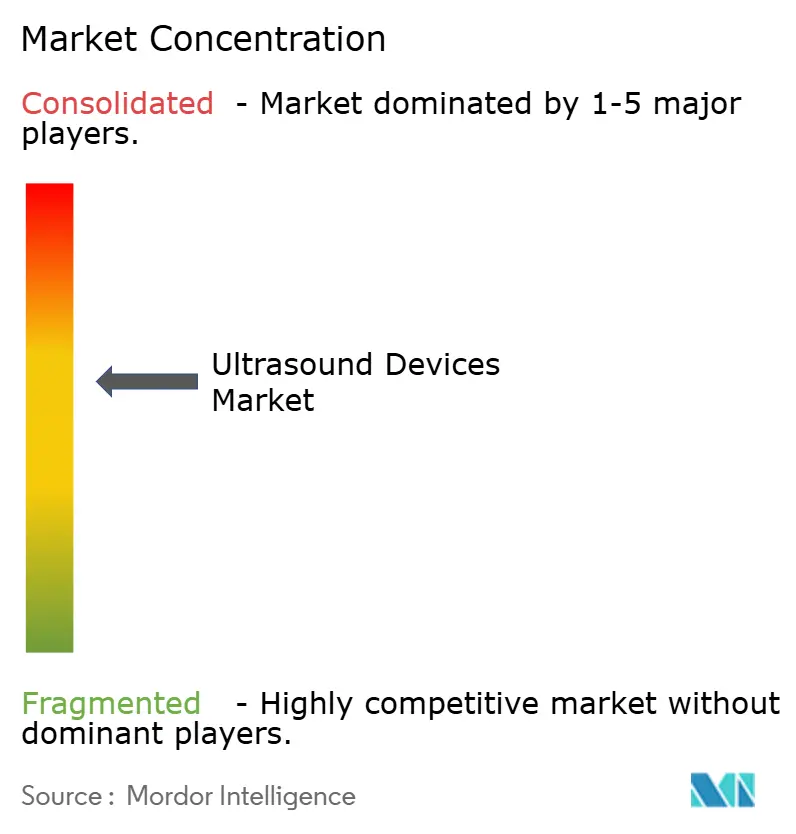
| Market Concentration | Medium |
Major Players*Disclaimer: Major Players sorted in no particular order Image © Mordor Intelligence. Reuse requires attribution under CC BY 4.0. | |
Ultrasound Devices Market Analysis by Mordor Intelligence
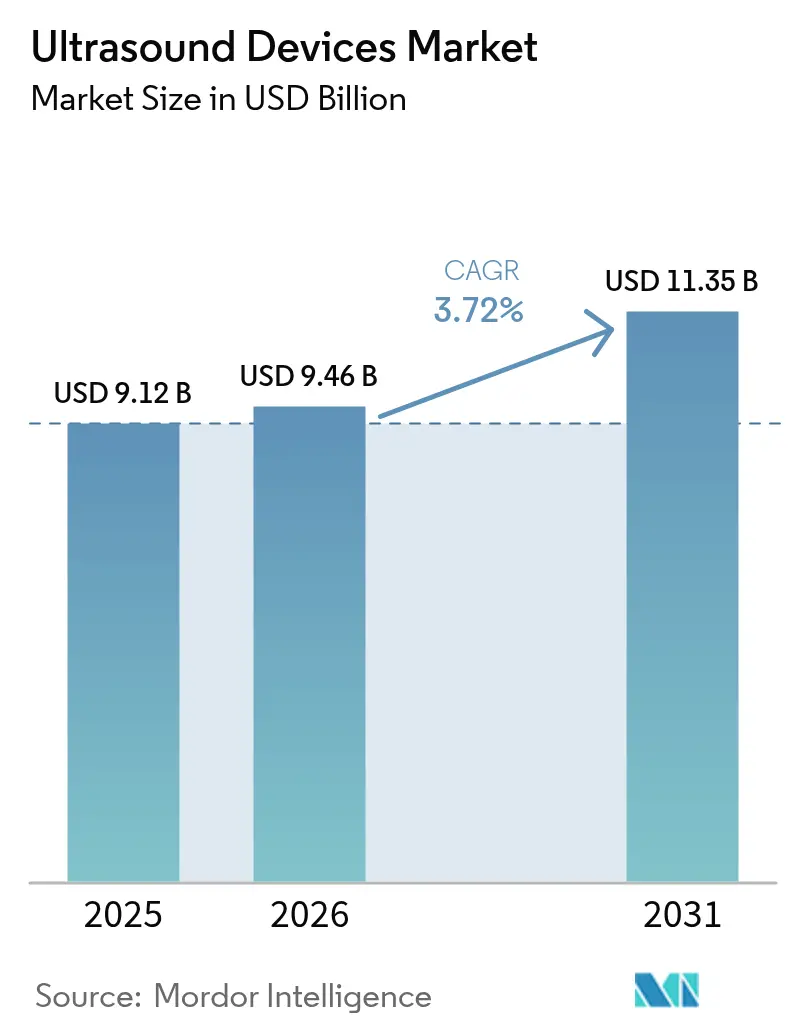
The Ultrasound Devices Market size is expected to grow from USD 9.12 billion in 2025 to USD 9.46 billion in 2026 and is forecast to reach USD 11.35 billion by 2031 at 3.72% CAGR over 2026-2031.
Consistent demand for real-time, radiation-free imaging, rapid uptake of artificial intelligence (AI) in image acquisition and interpretation, and widening use of handheld probes in primary care underpin this growth. Clinical evidence shows AI guidance can lift the diagnostic quality of scans performed by non-experts to 98.3%, matching specialist performance. Mature markets keep driving replacement demand for premium 3D & 4D systems, while emerging economies propel first-time purchases through public health programs. A pivot toward minimally invasive procedures, combined with multimodal fusion platforms that overlay real-time ultrasound on CT or MRI, broadens the technology’s procedural role. At the same time, persistent reimbursement gaps for point-of-care devices in the United States and tightening global quality-system regulations temper momentum.
Key Report Takeaways
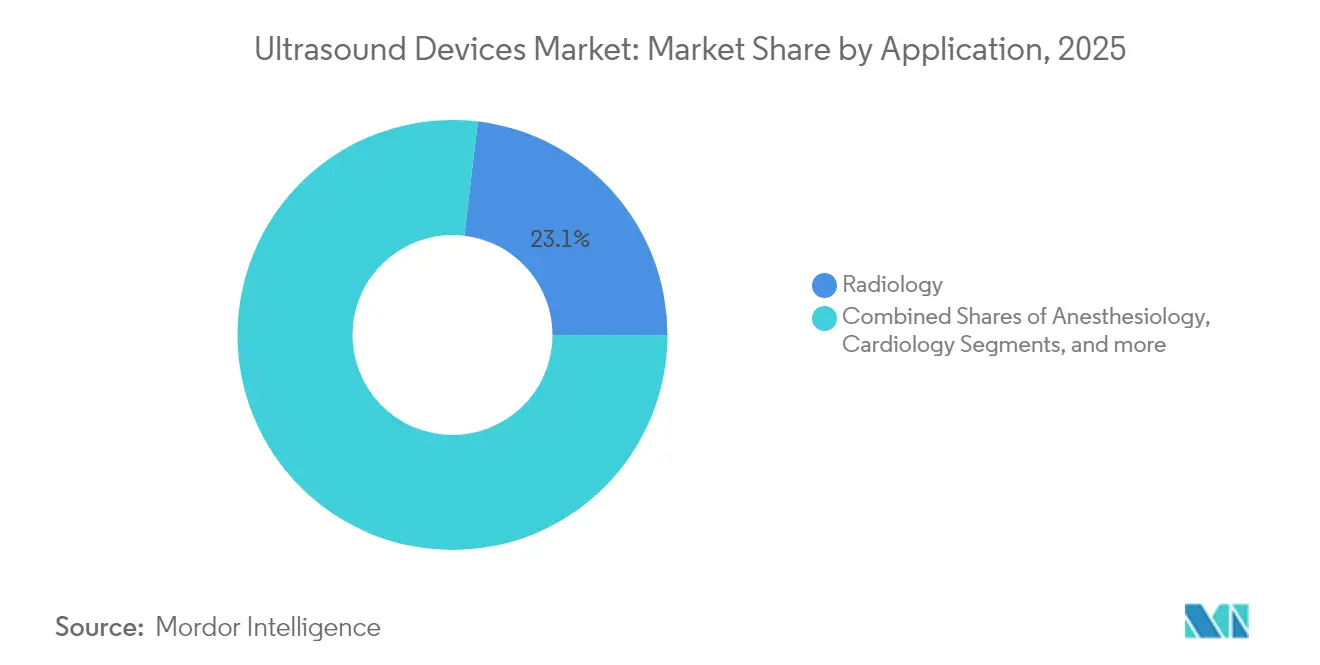
- By application, radiology accounted for a 23.12% share of the ultrasound devices market size in 2025, while anesthesiology is poised to accelerate at a 4.75% CAGR to 2031.
- By technology, 3D & 4D imaging held 45.05% of the ultrasound devices market share in 2025, whereas high-intensity focused ultrasound (HIFU) is forecast to post the fastest 4.98% CAGR to 2031.
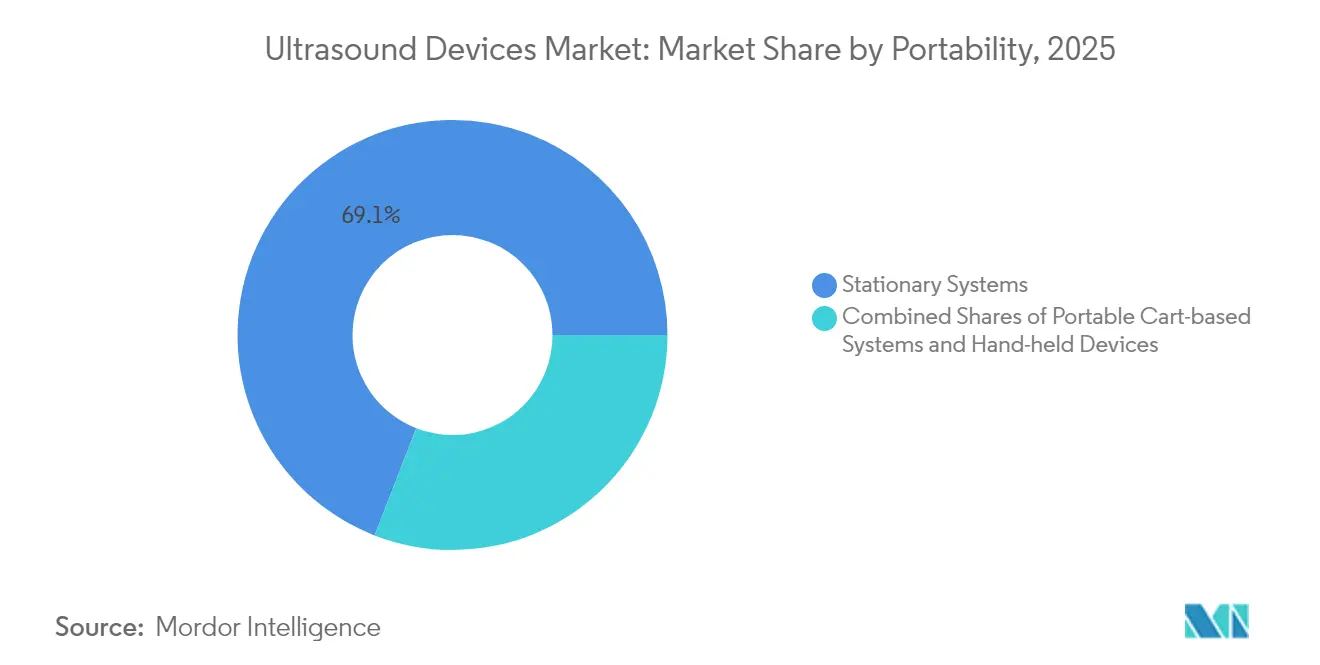
- By portability, stationary consoles dominated with 69.10% revenue share in 2025; handheld units are set to record an 7.88% CAGR through 2031.
- By end user, hospitals commanded 54.62% of the ultrasound devices market size in 2025; home-care settings are projected to expand at a 10.02% CAGR.
- By region, North America led with 37.85% revenue in 2025; Asia-Pacific is the fastest-growing region at a 4.66% CAGR for 2026-2031.
Note: Market size and forecast figures in this report are generated using Mordor Intelligence’s proprietary estimation framework, updated with the latest available data and insights as of 2026.
Global Ultrasound Devices Market Trends and Insights
Drivers Impact Analysis*
| Driver | (~) % Impact on CAGR Forecast | Geographic Relevance | Impact Timeline |
|---|---|---|---|
| Increasing incidences of chronic diseases | +1.3% | Global | Long term (≥ 4 years) |
| Growing minimally-invasive diagnostics and imaging facilities | +0.9% | Asia-Pacific, North America | Medium term (2-4 years) |
| Home-based pregnancy monitoring uptake | +0.6% | North America, Europe | Short term (≤ 2 years) |
| Expansion of tele-ultrasound networks | +0.5% | Emerging markets | Medium term (2-4 years) |
| Growing adoption of point-of-care ultrasound | +0.8% | Global | Short term (≤ 2 years) |
| AI-enhanced image reconstruction demand | +0.7% | North America, Europe | Medium term (2-4 years) |
| Source: Mordor Intelligence | |||
Increasing Incidences of Chronic Diseases
Cardiovascular, oncologic, and respiratory disorders account for most ultrasound referrals, making chronic-disease management a structural demand catalyst. An AI model for ovarian-tumor detection achieved an F1 score of 83.5%, surpassing expert radiologists. Similarly, deep-learning tools pinpoint the median nerve in carpal-tunnel scans with high accuracy. The American Cancer Society projects 2.04 million new cancer cases in the United States in 2025, up from 2.00 million in 2024, reinforcing long-term imaging demand. As AI accelerates workflow and elevates accuracy, it compensates for shortages of trained sonographers, broadening the user base and sustaining the ultrasound devices market.
Growing Minimally-Invasive Diagnostics and Imaging Facilities
A global pivot toward needle-guided biopsies, regional anesthesia, and musculoskeletal injections is deepening ultrasound’s procedural relevance. Fusion platforms that marry live ultrasound with CT, MRI, or PET scans are improving lesion targeting in complex cases. Facility growth reinforces the installed base: India counted 5,200 NABL-accredited labs in February 2024, 44% of which were radiology units.[1]National Accreditation Board for Testing and Calibration Laboratories, “Accredited Labs List,” nabl-india.org Australia listed 4,462 accredited imaging practices by December 2023, 81% clustered in three populous states.[2]Australian Commission on Safety and Quality in Healthcare, “Accredited Imaging Practices 2024,” safetyandquality.gov.au New centers such as ColumbiaDoctors/NY-Presbyterian’s Manhattan site opened in January 2025 to serve high-density urban catchments. This geographic spread of facilities feeds steady demand for both premium and mid-range ultrasound consoles, bolstering the ultrasound devices market.
Home-Based Pregnancy Monitoring Uptake
Handheld probes such as Vscan Air translate premium image quality into a cordless form factor, enabling prenatal scans outside hospitals. AI-embedded obstetric platformsexemplified by GE HealthCare’s Voluson series auto-measure fetal biometrics, shortening exam times while raising confidence. In underserved areas, early-risk detection via home scans triggers timely referrals and improves outcomes, a dynamic that broadens the ultrasound devices market beyond institutional boundaries.
Expansion of Tele-Ultrasound Networks
Cloud-connected software now streams live imaging feeds to specialists who guide novice operators in real time, reducing geographic barriers. Systems such as Philips Lumify with Reacts, Clarius Live and Butterfly iQ’s remote guidance gained traction during the COVID-19 public-health emergency. Research prototypes for robot-assisted ultrasound promise further reach once connectivity and reimbursement hurdles ease. These tele-consult platforms enlarge clinical reach without proportional capital outlays, reinforcing growth in the ultrasound devices market.
Restraints Impact Analysis*
| Restraint | (~) % Impact on CAGR Forecast | Geographic Relevance | Impact Timeline |
|---|---|---|---|
| Limited reimbursement for hand-held scanners | -0.7% | United States | Short term (≤ 2 years) |
| Strict regulation for approval | -0.5% | Global | Medium term (2-4 years) |
| Portable device battery-life fatigue | -0.3% | Emerging markets | Medium term (2-4 years) |
| Acoustic attenuation in obese patient imaging | -0.2% | Global | Long term (≥ 4 years) |
| Source: Mordor Intelligence | |||
Limited Reimbursement for Hand-Held Scanners
Point-of-care ultrasound (POCUS) lacks dedicated billing codes for many primary-care indications. Fee-for-service models discourage broad deployment, constraining the ultrasound devices market in outpatient and home settings. Recent CMS proposals hint at progress, yet policy fragmentation across private payers persists, delaying return-on-investment for providers.
Strict Regulation for Approval
The U.S. FDA’s revised Quality-System Regulation, effective February 2026, harmonizes with ISO 13485 but raises short-term compliance costs. Concurrently, new pathways such as predetermined change-control plans streamline post-market tweaks. Device reclassification e.g., ultrasound cyclo destructive systems moving to class II reduces submission burdens. Outside the United States, India’s PCPNDT Act mandates strict center registration and record-keeping, circumscribing prenatal scan volumes. Collectively, these measures elongate time-to-market and elevate operating risk.
*Our forecasts treat driver/restraint impacts as directional, not additive. The impact forecasts reflect baseline growth, mix effects, and variable interactions.
Segment Analysis
By Application: Radiology Sustains Scale as Anesthesiology Accelerates
Radiology applications generated 23.12% of the ultrasound devices market revenue in 2025, fueled by multi-organ imaging needs. AI modules that flag ovarian malignancies now surpass human expertise, pushing hospitals to upgrade radiology workstations. Elastography refinements have also sharpened liver-fibrosis staging, widening non-invasive screening libraries.
Procedure-guided anesthesiology is fleetingly smaller but expanding at a 4.75% CAGR. Nerve-block adoption benefits from color-overlay aids such as ScanNav Anatomy PNB, which simplifies landmark recognition for trainees. Hospitals keen to cut anesthetic drug volumes and postoperative pain are buying specialized linear probes, scaling the ultrasound devices market in perioperative suites.
Growing hospital budgets for point-of-care scanners, together with national-level guidance encouraging opioid-sparing analgesia, will likely sustain double-digit equipment refresh rates in anesthesia departments. As AI curates preset imaging protocols, clinicians gain confidence to extend ultrasound-guided blocks beyond orthopedics into emergency and intensive-care environments. This cross-departmental spillover lifts utilization rates, reducing per-scan costs and reinforcing the economic case for investing in advanced platforms within the broader ultrasound devices market.


By Technology: 3D & 4D Imaging Holds Leadership, HIFU Builds Momentum
3D and 4D systems contributed 45.05% of the ultrasound devices market share in 2025. They are favored for obstetrics, pediatrics, and cardiology cases that need volumetric visualization. They are supported by machine-learning algorithms that auto-render fetal facial features in real time. Such automation frees clinicians to focus on counseling rather than knobology.
HIFU addresses niche but fast-scaling therapeutic areas from uterine fibroids to pancreatic tumors and is projected to grow at 4.98% CAGR. Academic trials indicate meaningful symptom relief with minimal recovery time, prompting payers in China and Europe to evaluate reimbursement frameworks. As surgical departments integrate HIFU into tumor boards, they diversify revenue streams while staying within radiology budgets, reinforcing the ultrasound devices market trajectory.
Integrated AI dashboards that quantify ablation zones instantaneously reduce intraoperative uncertainty. This precision complements oncology’s shift to outpatient day-care models, where rapid turnover and reduced infection risk are premiums. Consequently, technology vendors that meld high-frame-rate imaging with therapy beams will likely capture outsized share of incremental capital spending within the ultrasound devices market.
By Portability: Stationary Consoles Reign While Handheld Probes Surge
Hospital departments still favor cart-based consoles for their superior harmonics, dynamic-range depth, and integration with PACS; these units made up 69.10% of 2025 revenue. Yet purchasing committees are adding compact carts that dock tablets, bridging the stationary performance with mobility. A comparative study across six leading handheld devices crowned Vscan Air for usability and Lumify for superficial imaging. Such findings nudge clinicians to adopt portable probes for line placements and bedside lung assessments, expanding the ultrasound devices market.
Handhelds are forecast to compound at 7.88% annually, spurred by pricing that slips below USD 3,000 and subscription models bundling software updates. Wearable patches that capture continuous organ motion for 48 hours already show feasibility in cardiopulmonary monitoring.Once commercialization matures, these patches could redefine chronic-care protocols, representing the next disruption in the ultrasound devices market.
Manufacturers must balance ruggedness, battery longevity, and heat dissipation, especially in tropical climates. Cloud synchronization compliant with HIPAA and GDPR remains a design imperative as tele-ultrasound workflows proliferate. Firms that secure cybersecurity certifications will enjoy a trust premium, potentially tilting procurement decisions in favor of their offerings.
By End User: Hospitals Lead, Home-Care Expands Rapidly
Hospitals accounted for 54.62% of global spending in 2025, benefiting from multi-department utilization. The newest installations feature AI-powered preset optimization, as illustrated by Samsung Medison’s Z20 system for obstetrics. Hospitals also appreciate enterprise licensing that aligns ultrasound modalities with electronic medical records for seamless billing.
Home-care settings are projected to log the fastest 10.02% CAGR. Butterfly iQ3 combines a whole-body probe with automated measurements, aiding self-managed chronic-disease patients. Tele-ultrasound links connect nurses in community health centers to subspecialists, mitigating rural-care gaps. As reimbursement evolves from procedure-based to outcome-based models, payers acknowledge cost savings from early detection, further legitimizing at-home ultrasound pathways in the ultrasound devices market.
Digital-platform interoperability remains critical. Vendors offering software development kits for third-party integration with telehealth dashboards will likely capture disproportionate mindshare among home-health agencies. Education also matters: quick-start tutorials embedded in apps shorten learning curves, accelerating practitioner confidence and usage frequency.
Geography Analysis
North America retained a 37.85% revenue share in 2025 owing to strong payor coverage, a high chronic-disease burden, and steady technology refresh cycles. Launches such as Vave Health’s whole-body wireless device and GE HealthCare’s Automated Breast Ultrasound Premium illustrate the domestic appetite for AI-embedded innovation. Regulatory clarity and CPT codes for breast density screening underpin the quick onboarding of these solutions. Hospitals increasingly equip emergency departments with handheld probes, trimming triage times and improving bed flow, thus lifting the ultrasound devices market.
Asia-Pacific ranks as the fastest-growing region at a 4.66% CAGR. China dominates regional volume through procurement programs favoring domestically made consoles like Mindray’s Consona series. India’s “Make in India” ethos echoes through Wipro GE’s Versana Premier R3, an AI-ready system assembled in Bengaluru. Adoption of point-of-care ultrasound in overcrowded primary-care centers accelerates first-time purchases, though the PCPNDT Act restrains obstetric volumes. Nevertheless, public insurers increasingly reimburse liver and cardiac scans, sustaining the ultrasound devices market’s regional ascent.
Europe remains a technology-focused market. Agencies such as the European Medicines Agency require robust clinical data, prompting vendors to showcase evidence on dose-free imaging and interoperability with electronic health records. Focused-ultrasound milestones Insightec’s MRgFUS for essential tremor winning NUB status 1 reimbursement in Germany highlight innovation’s role in neurology and oncology insightec.com. WONCA Europe is rolling out structured ultrasound training for general practitioners, widening the community-care footprint. Collectively, these dynamics keep Europe a vital contributor to the ultrasound devices market.


Regulatory Landscape
Regulatory requirements are tightening around quality systems, software change management, and device traceability, which is increasing compliance workloads for ultrasound OEMs and their supply chains. In the United States, the FDA has guidance for marketing clearance of diagnostic ultrasound systems and transducers, and the revised Quality System Regulation becomes effective in February 2026, aligning quality management expectations more closely with ISO 13485 and reinforcing design controls, validation, and post-market processes for both cart-based and handheld platforms.
In Europe, MDR implementation continues to shape technical documentation, Notified Body capacity planning, and nomenclature alignment. Updated MDCG guidance released in April 2026 on classification, EMDN assignment, and borderline determinations adds another layer of documentation discipline, and the European Commission mandates specific EUDAMED transition modules (including Actor, UDI/Device, Notified Body certificates, and Market Surveillance) from May 2026. In China, NMPA and CMDE are reinforcing standards and review depth, including a 2026 industry standards revisions plan affecting medical device standards, and an April 2026 registration review guideline for intravascular ultrasound (IVUS) diagnostic systems and catheters that treats IVUS as Class III, raising evidence and technical-file expectations for specialized ultrasound modalities.
Competitive Landscape
The ultrasound devices market hosts a moderately concentrated cohort. The key players, such as GE HealthCare, Philips, and Siemens Healthineers, form the top tier, together accounting for a significant share of the global revenue. GE HealthCare advances segmentation with its SonoSAMTrack AI model that yields better accuracy, and Philips reinforces ecosystem stickiness through Reacts tele-consult software. At the same time, Siemens leverages Syngo Dynamics across modalities to lock in enterprise deals.
Mid-tier challengers Fujifilm, Canon Medical, and Mindray differentiate via cost-effective consoles for value segments and targeted acquisitions. Samsung Medison’s 2024 purchase of Sonio added explainable AI for obstetrics, positioning the brand to court women’s health chains. Fujifilm’s Arietta 850 launch in India marked an entry into the gastroenterology ultrasound niche.
Disruptors such as Butterfly Network enlarge the handheld category through semiconductor-based probes linked to subscription analytics. Butterfly booked 35% Q4 2024 revenue growth on the back of health-system deals and veterinary accounts. Clarius and Exo pursue similar chip-based strategies, promising margin benefits over piezoelectric transducers. As AI becomes table stakes, competitive advantage shifts to data curation, workflow integration, and payor advocacy within the ultrasound devices market.
Intellectual property portfolios are expanding: GE HealthCare filed over 200 AI-ultrasound patents in 2024, focusing on auto-detection algorithms. Regional players in China aggressively patent HIFU energy-control circuits, while European small caps chase niche applications in neuro-oncology. Cost pressure is spurring partnerships with semiconductor foundries to drive economies of scale in handheld categories. Mergers for data-science talent, rather than hardware, will likely characterize the next consolidation wave.
Ultrasound Devices Industry Leaders
GE Healthcare
Mindray Medical International Ltd
Koninklijke Philips NV
Siemens Healthineers
Canon Medical Systems Corporation
- *Disclaimer: Major Players sorted in no particular order

Market Opportunities and Future Outlook
Near-term opportunity is concentrated in software-defined upgrades and regulatory-enabled refresh cycles that convert installed base demand into recurring workflow and automation adoption. In June 2026, the FDA finalized a Class II (special controls) classification for real-time ultrasound anatomy visualization and labeling devices under 21 CFR 892.1550, supporting a 510(k) pathway that reduces friction for commercialization of guidance and labeling capabilities embedded into ultrasound workflows. The report context also points to multiple 2026 clearances for AI and automation layers, including Philips Elevate Plus for EPIQ Elite and Affiniti (FDA 510(k) clearance, June 2026), indicating that differentiation is increasingly delivered through software packages, structured reporting, and cloud-connected review rather than hardware alone.
Decentralized care is a workable whitespace for handheld and compact systems, but monetization depends on training, governance, and reimbursement mechanics rather than device availability alone. The report context also highlights persistent reimbursement gaps for handheld scanners in the United States, while tele-ultrasound platforms, such as Philips Lumify with Reacts, have already demonstrated remote guidance workflows that extend use beyond radiology departments. Public programs and localization initiatives in Asia-Pacific, including China procurement preferences and India-focused manufacturing and assembly activity, support broader access and first-time purchases, particularly where facility footprints and accredited imaging capacity are expanding. Vendors that combine handheld adoption with standardized protocols, cybersecurity-compliant cloud synchronization, and enterprise integration are positioned to capture more value from point-of-care expansion.
Recent Industry Developments
- July 2026: Philips launched the Alturion ultrasound system, positioning AI-powered workflows for high-volume clinical environments. The launch highlights how vendors are using workflow automation and standardization features to compete for large hospital and imaging network replacements, not only incremental unit growth.
- August 2025: GE HealthCare unveiled the Vivid Pioneer cardiovascular ultrasound system with AI-powered capabilities, supported by major regulatory milestones (including CE mark and FDA clearance referenced in the announcement). This release reinforced premium segment refresh cycles in cardiology where image quality, quantification, and productivity tools influence capital equipment decisions.
- July 2024: GE HealthCare entered an agreement to acquire the clinical AI software business from Intelligent Ultrasound for about USD 51 million. The acquisition strengthened GE HealthCare’s ultrasound-adjacent AI pipeline and signaled a continued shift toward acquiring software assets that can be embedded across ultrasound product lines.


Research Methodology Framework and Report Scope
Market Definition and Coverage
This market is defined as revenues from ultrasound imaging and therapeutic ultrasound equipment sold worldwide, including cart-based systems, compact/portable units, and handheld scanners used across hospital and non-hospital care settings.
Scope exclusions: Refurbished ultrasound systems, stand-alone software, replacement probes sold as spare parts, and post-warranty service contracts are excluded.
Segmentation Overview
- By Application
- Anesthesiology
- Cardiology
- Gynecology / Obstetrics
- Musculoskeletal
- Radiology
- Critical Care
- Urology
- Vascular
- Other Applications
- By Technology
- 2D Ultrasound Imaging
- 3D & 4D Ultrasound Imaging
- Doppler Imaging
- Contrast-Enhanced Ultrasound
- Elastography
- High-Intensity Focused Ultrasound
- By Portability
- Stationary Systems
- Portable Cart-based Systems
- Hand-held / Pocket Devices
- By End User
- Hospitals
- Diagnostic Imaging Centers
- Ambulatory Surgical Centers
- Maternity & Fertility Clinics
- Home-care Settings
- Veterinary Hospitals
- By Geography
- North America
- United States
- Canada
- Mexico
- Europe
- Germany
- United Kingdom
- France
- Italy
- Spain
- Rest of Europe
- Asia-Pacific
- China
- Japan
- India
- Australia
- South Korea
- Rest of Asia-Pacific
- Middle East & Africa
- GCC
- South Africa
- Rest of Middle East & Africa
- South America
- Brazil
- Argentina
- Rest of South America
- North America
Data Sources, Market Sizing, and Validation
Desk Research
We start by mapping the installed healthcare base and procedure demand that typically drives ultrasound purchasing, and then we connect it to shipment and pricing signals available in public data. Foundational inputs are taken from sources such as the World Health Organization for health system indicators, the World Bank for macro and spend context, the OECD for hospital and diagnostic statistics, and the US FDA and the European Commission for device approvals and regulatory cues.
To pressure-test demand drivers, we also scan peer-reviewed clinical journals for utilization trends in areas like obstetrics, cardiology, and emergency care, followed by trade association publications and publicly available tender notices from hospitals and health systems. Company annual reports, investor presentations, and reputable press releases help confirm product mix shifts such as portable adoption and AI-enabled feature bundling. Select paid subscriptions are used only for company financials and news intelligence, plus patent databases and global contracts and tenders where it adds clarity on pipeline and procurement timing. The desk sources listed here are illustrative only, and many other public references are used during data collection, validation, and clarification.
Primary Interviews and Surveys
Next, we validate the desk assumptions through expert interviews and structured surveys with device manufacturers, distributors, hospital procurement teams, radiology and cardiology users, and service engineers who see real replacement cycles. Coverage is balanced across major regions so the model reflects differences in reimbursement strength, public procurement patterns, and point-of-care adoption, and then the feedback is used to adjust pricing ladders and unit growth assumptions where gaps are found.
Distribution of primary research fieldwork respondents
| Company type | Respondent position | Region |
|---|---|---|
| Top tier: 35% | CXOs: 14% | APAC: 44% |
| Mid tier: 49% | Functional/Unit leaders: 35% | EMEA: 36% |
| Smaller Players: 16% | Managers: 51% | Americas: 20% |
Market-Sizing & Forecasting
Our core sizing uses a top-down build where healthcare activity indicators are translated into an equipment demand pool by application, and then scaled using replacement cycles and penetration of ultrasound by care setting. Key inputs that guide the model include imaging procedure growth in high-use departments, maternal and cardiovascular care volumes, hospital and diagnostic center capacity additions, the split between cart-based and portable shipments, and average selling price bands by system class and region.
Those totals are then corroborated with selective bottom-up approximations so the output stays realistic, including sampled vendor revenue disclosures, channel checks on unit movement, and ASP times volume calculations for a short list of representative system types. When bottom-up visibility is uneven, gaps are handled by using proxy ratios such as portable share, public tender mix, and installed base aging, which are then validated again during follow-up calls. For forecasting, scenario analysis is used because replacement timing, capital budgets, and portable adoption can move differently across regions, and the final trajectory is aligned to what primary respondents describe as most likely under current reimbursement and procurement conditions.
Data Validation & Update Cycle
We run several checks before sign-off so the model does not drift away from real-world buying signals. Outputs are compared against independent metrics such as healthcare capex direction, regulatory approvals flow, and observed price compression or premium feature bundling by system class, and then any outliers are investigated in detail.
A multi-step internal review is completed, and re-contact is triggered when a region, application, or system class shows a variance that cannot be explained by utilization or pricing logic. Reports are refreshed annually, and interim updates are made when material events occur such as policy changes, major product launches, or sudden procurement slowdowns. Right before delivery, a final analyst pass is done so clients receive the most current view possible.
Mordor Intelligence's Global Ultrasound Devices Market Market Size Compared With Other Published Estimates
Different sources often show different market sizes for ultrasound devices because the scope lines are not the same, and because pricing, currency timing, and forecast scenarios are treated differently. In practice, even small differences in what gets counted as equipment revenue can move the total by a noticeable amount.
Refurbished ultrasound scanners sit outside Mordor Intelligence's scope, and that single exclusion can widen the gap versus estimates that mix new system sales with secondary-market equipment value. Other differences usually come from whether therapeutic systems are fully included, how portable and handheld ASP erosion is modeled, and whether currency conversion uses a single-year average or a period average during volatile exchange-rate years.
Benchmark comparison
| Source | Market Size | Gaps in Research Methodology |
|---|---|---|
| Mordor Intelligence | USD 9.12 B (2025) | |
| Global Consultancy A | USD 13.36 B (2025) | Often reflects a broader equipment revenue envelope where refurbishment and resale channels may be implicitly captured, and the growth curve can be lifted by using more aggressive adoption assumptions for point-of-care deployments. |
| Industry Publisher B | USD 8.70 B (2025) | May apply a narrower device definition or a more conservative ASP path for portable systems, which can suppress the base year when price compression is assumed to happen faster across regions. |
Taken together, the spread is mainly explained by whether secondary-market equipment and adjacent revenue buckets are counted, plus differences in how portable pricing is projected. By keeping the inputs tied to observable procedure demand, replacement timing, and system-class price bands, the final number stays traceable to clear steps that can be reviewed and repeated.


Key Questions Answered in the Report
What is the forecasted Ultrasound Devices Market size by 2031?
The global Ultrasound Devices Market size is expected to reach approximately USD 11.35 billion by 2031.
Which ultrasound technology segment is growing fastest?
High-Intensity Focused Ultrasound (HIFU) shows the highest growth momentum with a projected 4.98 % CAGR between 2026 and 2031.
How quickly are handheld ultrasound devices gaining market share?
Handheld and pocket-sized ultrasound devices are forecast to expand at about 7.88 % CAGR over 2026-2031, outpacing other portability segments.
Why is Asia-Pacific considered the most attractive growth region?
Expanding healthcare access, policy support for local manufacturing, and rising chronic disease incidence contribute to Asia-Pacific’s estimated 4.66 % CAGR through 2031.
How is artificial intelligence impacting ultrasound adoption?
AI improves diagnostic accuracy, reduces operator variability, and accelerates workflows, thereby broadening ultrasound use in both hospital and home-care settings.
Page last updated on:


