
Scuba Diving Equipment Market Size and Share
Market Overview
| Study Period | 2020 - 2031 |
|---|---|
| Market Size (2026) | USD 0.86 Billion |
| Market Size (2031) | USD 1.17 Billion |
| Growth Rate (2026 - 2031) | 6.32 % |
| Fastest Growing Market | Asia Pacific |
| Largest Market | North America |
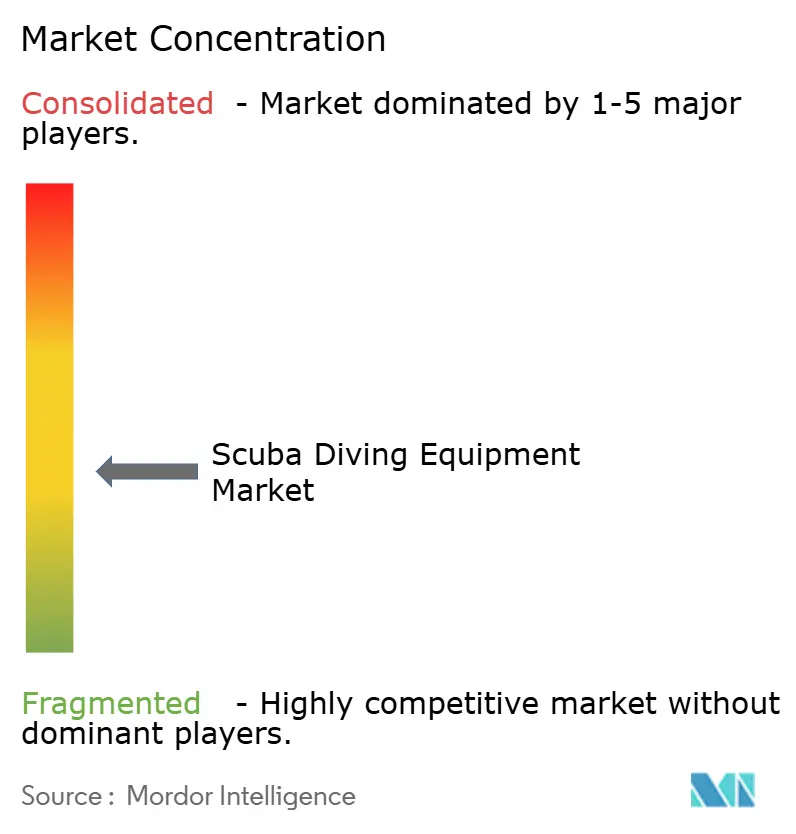
| Market Concentration | Medium |
Major Players *Disclaimer: Major Players sorted in no particular order Image © Mordor Intelligence. Reuse requires attribution under CC BY 4.0. | |
Scuba Diving Equipment Market Analysis by Mordor Intelligence
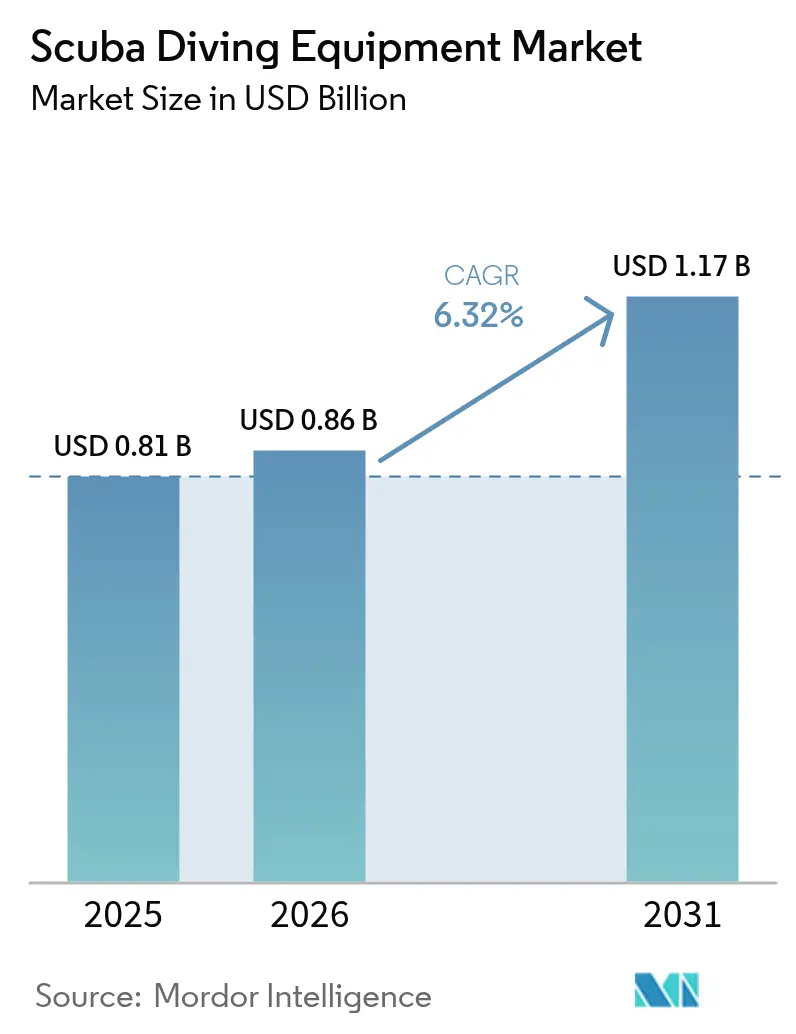
The global scuba diving equipment market size was valued at USD 0.81 billion in 2025 and estimated to grow from USD 0.86 billion in 2026 to reach USD 1.17 billion by 2031, at a CAGR of 6.32% during the forecast period (2026-2031). This growth outlook anchors the current optimism around the market size and the many forces that shape demand and supply. Post-pandemic recovery in coastal tourism, wider adoption of artificial-intelligence-enabled dive computers, and a rebound in disposable incomes among avid adventurers form the backbone of expansion. Continuous product innovation, especially around recycled materials and integrated wearables, keeps replacement cycles short and average selling prices firm. Consolidation activity, most notably HEAD Group’s takeover of Aqua Lung International, signals a maturing yet still fragmented competitive landscape where scale advantages become pivotal. Supply-side pressures such as raw-material inflation and logistic bottlenecks have eased compared with 2024, yet vigilance is necessary because any resurgence may hurt profitability.
Key Report Takeaways
- By product, regulators & rebreathers led with 36.78% of the scuba diving equipment market share in 2025, and gauges & dive computers are projected to grow at a 6.53% CAGR through 2031, the fastest among product categories.
- By distribution channel, dive-specialty stores held 39.85% of the scuba diving equipment market share in 2025, while e-commerce is advancing at an 8.12% CAGR to 2031.
- By end user, recreational divers captured 63.62% of the scuba diving equipment market share in 2025; the professional & technical divers segment is set to expand at 5.08% CAGR over the same horizon.
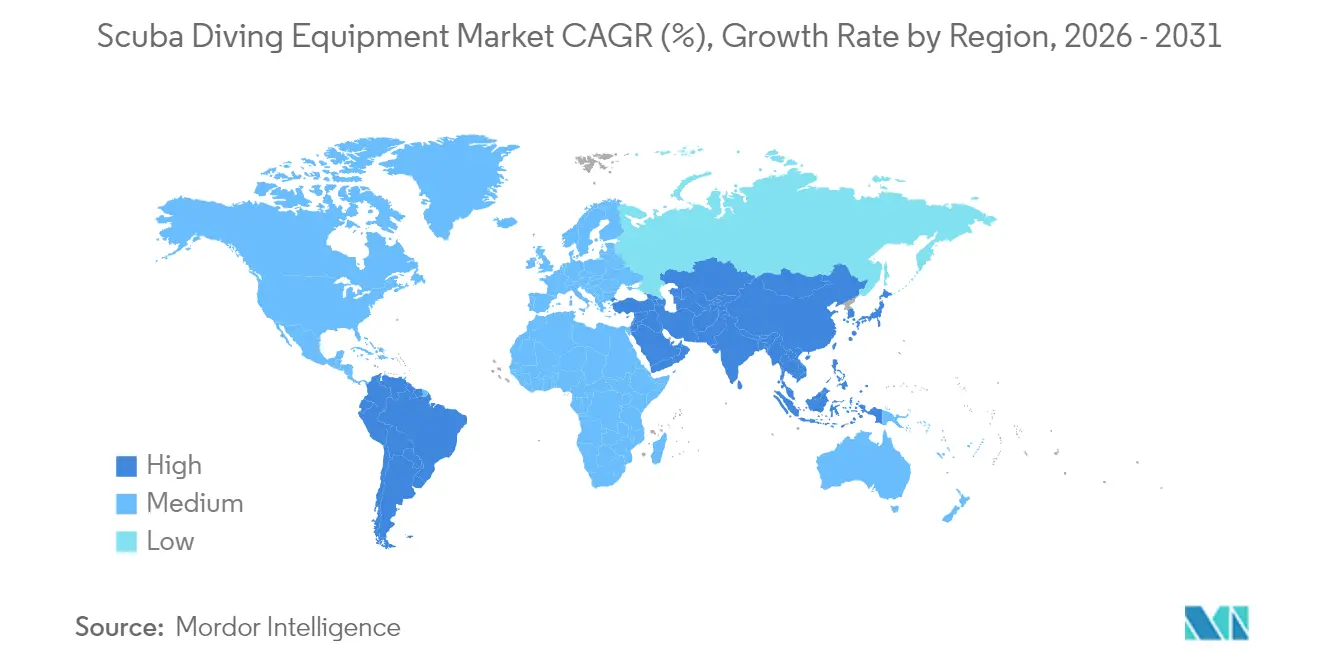
- By geography, North America commanded 31.02% of the scuba diving equipment market share in 2025; Asia-Pacific is the fastest-growing region with a 6.05% CAGR through 2031.
Note: Market size and forecast figures in this report are generated using Mordor Intelligence’s proprietary estimation framework, updated with the latest available data and insights as of 2026.
Market Trends and Insights
Drivers Impact Analysis of Scuba Diving Equipment Market*
| Driver | (~) % Impact on CAGR Forecast | Geographic Relevance | Impact Timeline |
|---|---|---|---|
| Rising coastal-tourism expenditure | +1.2% | Global, strongest in Asia-Pacific and Middle East | Medium term (2-4 years) |
| Expansion of dive-training certification | +1.8% | Asia-Pacific core; spill-over to South America | Long term (≥ 4 years) |
| Underwater photography & social-media pull | +0.9% | Global, early adoption in North America & Europe | Short term (≤ 2 years) |
| Advanced dive computers & wearables | +1.5% | North America & Europe lead; Asia-Pacific follows | Medium term (2-4 years) |
| Eco-friendly gear materials | +0.7% | Europe and North America expanding worldwide | Long term (≥ 4 years) |
| Artificial reef projects | +0.4% | Asia-Pacific, Middle East, selected U.S. sites | Long term (≥ 4 years) |
| Source: Mordor Intelligence | |||
Rising Coastal-Tourism Expenditure
Coastal destinations reopened fully in 2024, and spending momentum carried into 2025 as revenge-travel effects kept resort occupancies robust. Government tourism boards in Turkey, Western Australia, and Malta rolled out diver-focused itineraries that bundle training, certification, and equipment purchases, thereby converting leisure travelers into first-time divers[1]Republic of Türkiye Ministry of Culture and Tourism, “Diving Tourism Strategy,” goturkiye.gov.tr. . Infrastructure upgrades marinas, hyperbaric facilities, and dive-operator clusters, further lift the spending ceiling. Equipment-rental shortages at emerging sites compel visitors to buy entry-level masks, snorkels, and fins, creating a direct link between tourism arrivals and unit shipments. Destination diversity also matters; locales boasting a mix of coral reefs, wreck dives, and artificial sites record higher basket sizes. Lastly, social-media exposure of pristine waters and megafauna has converted aspirational interest into actual bookings, sealing the demand loop.
Growing Popularity of Underwater Photography & Social-Media Influence
High-definition action cameras and smartphone housings have mainstreamed underwater content creation. Influencers highlight night dives, wreck penetrations, and manta interactions, driving aspirants to replicate the visuals. Divers now look for buoyancy-control devices with accessory-mount points, wide-angle lens adapters, and lighting kits integrated into their primary setup. Camera-driven purchases tend to be higher value and replaced more often as optics and sensor tech evolve. Manufacturers respond with quick-swap light arms, neutral-buoyancy housings, and app-based dive logs that auto-share to Instagram. The net effect is a richer upsell environment, where even casual divers gravitate toward mid-range computers to chronicle depth and GPS tracks. The mini ecosystem around photography, extra batteries, SD cards, and protective cases adds incremental revenue to core equipment sales.
Increasing Adoption of Advanced Dive Computers & Integrated Wearables
The analog-to-digital migration has entered a second phase where AI algorithms deliver personalized decompression advice based on biometrics. Garmin’s Descent G2 leverages a recycled-plastic housing and an AMOLED panel, offering multi-sport utility that extends its value proposition beyond diving [2]Garmin Ltd., “Garmin Introduces Descent G2,” garmin.com. . Apple Watch Ultra users can access full recreational profiles through subscription software, introducing newcomers to diving without a standalone console. These devices pair with cloud platforms, allowing instructors to review logs remotely and certify skill mastery. Predictive maintenance alerts encourage timely regulator servicing, improving safety and ancillary revenues for service centers. Although higher unit prices can be a hurdle, installment-plan options on e-commerce sites reduce adoption friction. As ecosystems mature, data portability will become a selling point, locking users into specific brands and software subscriptions.
Emergence of Eco-Friendly Dive Gear Materials
Sustainability moves from differentiator to hygiene factor as divers often staunch ocean advocates scrutinize carbon footprints. Apeks launched regulators containing bioplastic parts sourced from ocean-bound waste, while several wetsuit brands replaced solvent-based glue with water-borne alternatives[3].Apeks Marine Equipment Ltd., “EVX Series Regulators,” apeksdiving.com. Early adopters pay premiums because environmental stewardship aligns with personal values. European Union directives on single-use plastics and extended producer responsibility tighten over the next four years, effectively nudging laggards toward greener supply chains. Recycled nylon webbing, solvent-free neoprene, and bio-rubber become standard in premium lines, with trickle-down expected as costs amortize. Manufacturers with verified life-cycle assessments gain a head start in eco-label eligibility, widening shelf space in specialty retailers. As material recycling technologies scale, price differentials are projected to narrow, bringing eco gear to the mass segment by 2028.
Restraints Impact Analysis of Scuba Diving Equipment Market*
| Restraint | (~) % Impact on CAGR Forecast | Geographic Relevance | Impact Timeline |
|---|---|---|---|
| High upfront cost of premium equipment | -1.1% | Global, strongest in emerging markets | Short term (≤ 2 years) |
| Seasonal demand volatility | -0.8% | Temperate regions in North America, Europe, Asia | Medium term (2-4 years) |
| Stringent safety regulations increasing certification barriers | -1.0% | Global, strongest in developed markets | Medium term (2-4 years) |
| Environmental concerns over reef degradation limiting dive spots | -0.7% | Coastal regions with sensitive marine ecosystems (e.g., Great Barrier Reef, Caribbean) | Medium to long term (3-5 years) |
| Source: Mordor Intelligence | |||
High Upfront Cost of Premium Dive Equipment
Complete entry-level kits run above USD 1,500, an obstacle for casual divers who account for a large share of new certifications. Survey data show technical divers allocate USD 970 annually to equipment, whereas recreational participants manage with USD 252, underscoring price segmentation. Rebreathers, often exceeding USD 8,000, see interest levels around 57% of surveyed divers, yet cost ranks highest among deterrents. Financing options remain limited in emerging economies, complicating adoption for young professionals with competing lifestyle expenses. Rental programs bridge gaps but postpone ownership, thereby flattening upgrade curves. Manufacturers explore modular pricing, allowing staged purchases of first and second stages separately to lower initial outlays and widen the addressable pool.
Seasonal Demand Volatility in Temperate Regions
Retailers in the Great Lakes or the Baltic Sea witness 60-80% volume drop-offs in the winter months. Extended low-season inventory tie-ups strain working capital for small shops that must also maintain service technicians year-round. Some operators diversify into skiing or kayaking gear, yet cross-merchandising dilutes brand focus and complicates inventory systems. Climate change complicates forecasting: milder winters might lengthen shoulder seasons, but storm intensities also rise, forcing unpredictable closures. Manufacturers react by offering just-in-time delivery contracts, but the approach shifts warehousing risk upstream. Electronic learning modules help centers generate off-season revenue, yet equipment purchases still cluster around peak travel periods, preserving cyclicality.
*Our forecasts treat driver/restraint impacts as directional, not additive. The impact forecasts reflect baseline growth, mix effects, and variable interactions.
Scuba Diving Equipment Market Segment Analysis
By Product:
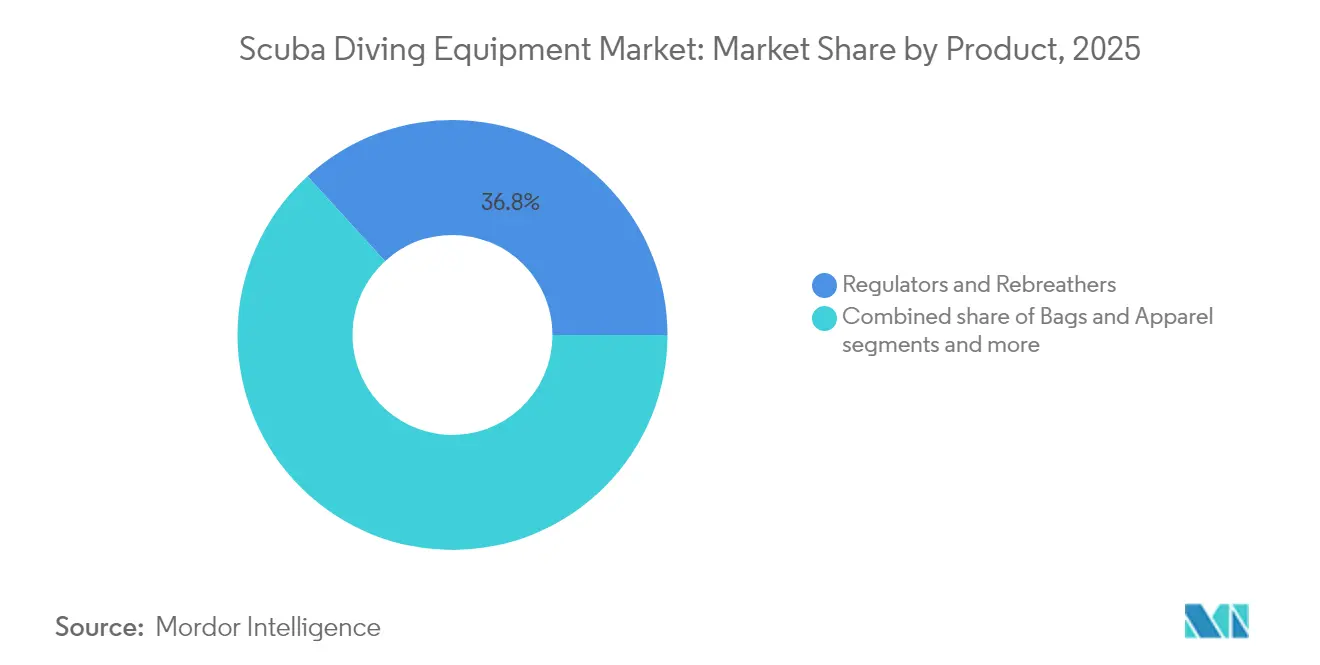
Technological Upgrades Power Computer AdoptionRegulators & Rebreathers held the largest slice of the scuba diving equipment market in 2025, accounting for 36.78% of revenue. The segment benefits from mandatory safety roles and consistent replacement intervals. Conversely, Gauges & Dive Computers chart the fastest trajectory at a 6.53% CAGR, propelled by AI functions and smartwatch interoperability. This dynamism introduces short upgrade cycles reminiscent of consumer electronics, lifting overall average selling prices. Limited-edition launches, such as commemorative regulators with ceramic coatings, sustain enthusiasm in a mature category. Meanwhile, Bags & Apparel remain price elastic; direct-to-consumer brands exploit social-media advertising to steal share from legacy players. Product bundling strategies, adding a basic dive computer to regulator packages, function as margin defenders for traditional manufacturers while easing adoption barriers for newcomers.



By Distribution Channel:
Online Platforms Reshape Buying JourneysDive-specialty Stores still generated 39.85% of sales in 2025 because personalized fitting and servicing remain non-replaceable value adds. However, lockdown-era shopping habits entrenched an e-commerce preference that now grows at 8.12% CAGR. Younger divers browse comparison sites, watch unboxing videos, and consult peer reviews before committing. Manufacturers increasingly deploy direct-to-consumer portals, bypassing intermediaries and capturing data for future product development. Traditional retailers respond by offering omnichannel experiences, reserve online, and pick up in-store to maintain relevance. Hypermarkets play at the entry-level, stocking masks and fins, but the depth of assortment remains minimal. As virtual-reality try-on tools improve, even specialized items like drysuit seals may gain online traction, further challenging brick-and-mortar economics.

By End User:
Professional Segment Commands PremiumsRecreational Divers dominated demand with 63.62% revenue share in 2025, supported by certification pipelines and tourism rebounds. The Professional & Technical Divers cohort, while smaller, posts a robust 5.08% CAGR, fueled by offshore wind construction and marine research requiring mixed-gas systems. Professional segments purchase higher-value gear, closed-circuit rebreathers, communication helmets, and follow stricter maintenance intervals, boosting after-sales service revenue. Military & Public Safety Divers purchase through tender processes tied to government fiscal cycles, making the segment stable but less responsive to consumer trends. Growing infrastructure projects in developing regions demand saturation diving services, further raising requisition volumes for specialized support systems such as decompression chambers. As drone inspections expand, demand for takeoff control of intervention will not vanish; rather, it will skew toward complex tasks needing advanced equipment.
Geography Analysis
North America Scuba Diving Equipment Market
North America captured a strong 31.02% share of the 2025 revenue, driven by established certification organizations, diverse dive locations, and high disposable incomes. Key retail hubs in Florida, California, and British Columbia offer integrated services including training, equipment maintenance, and travel booking, enhancing customer loyalty and encouraging premium purchases. The popularity of cold-water diving in the Great Lakes and Pacific Northwest increases demand for specialized gear like drysuits and advanced regulators, boosting average sales value. Additionally, local manufacturing in the U.S. and Canada reduces delivery times, ensuring better product availability. These factors collectively reinforce North America's leading position in the scuba diving equipment market.
APAC Scuba Diving Equipment Market
Asia-Pacific represents the fastest-growing cluster with a 6.05% CAGR through 2031, an outcome of rising middle-class affluence and aggressive tourism campaigns. Indonesia, the Philippines, and Thailand collectively issue hundreds of thousands of certifications annually, with local governments investing in artificial reefs that add fresh sites and sustain repeat visits. Additionally, Japan records 9.70% dive participation, with interest among non-divers signalling a promising funnel. Lower costs of entry-level equipment, coupled with installment plans, make ownership attainable for a broader audience. Branded training schools have begun franchising models in Vietnam and India, reinforcing certification-driven demand.
Europe Scuba Diving Equipment Market
Europe shows moderate growth, yet sustainability regulations make it a test bed for eco-friendly innovations. Extended producer responsibility rules reward early movers that integrate recycled materials, enabling price premiums without alienating eco-conscious buyers. Marine-protected-area expansion under the EU Biodiversity Strategy preserves dive site quality while enforcing stricter operator guidelines, boosting sales of low-impact anchors and biodegradable lubricants. Cold-water adventure tourism in Norway and Iceland also spurs demand for heated undergarments and high-performance regulators suited to sub-5 °C environments.

Regulatory Landscape
Regulation for scuba diving equipment and services combines equipment safety standards, occupational safety rules, and destination-level operator and environmental requirements, shaping product design, servicing intervals, and operator procurement. On the equipment side, widely referenced standards include EN 250 for open-circuit regulators and ISO 24803 for recreational diving service providers, while the United States applies OSHA 29 CFR 1910.424 for occupational SCUBA activities (including depth limits for employer-directed diving), which influences demand for compliant regulators, gauges, and maintenance documentation.
Recent policy actions in major dive-tourism corridors are tightening oversight of operators and reef-protection practices, which can affect equipment purchases and usage rules. Thailand implemented stricter national measures for diving activities effective 22 April 2025 under its marine and coastal resources framework, reinforcing reef-contact prohibitions and operating requirements for supervised dives. In 2026, governments and industry bodies moved toward more formalized frameworks: Cyprus progressed legislation toward mandatory licensing for recreational dive providers (March 2026), Southeast Asian delegates from seven nations convened in Bali to align Green Fins environmental standards (March 2026), and Egypts Ministry of Tourism and Antiquities initiated a sector regulatory overhaul discussion on 22 April 2026 aimed at modernizing safety, environmental protection, and governance. These developments raise the value of traceable servicing, environmentally oriented product claims, and operator-compliance support.
Value Chain Analysis
The scuba diving equipment value chain begins with upstream inputs, including metals and alloys for first and second stages, polymers for housings and BCD components, textiles and foams for exposure suits, and electronics and batteries for computers. Design and certification testing follow to meet EN/ISO requirements and national safety rules. Manufacturing is split between brand holders that shape product roadmaps and marketing, and specialized component makers and OEM/ODM factories, with a meaningful share of production outsourced to Asia for hard goods and soft goods. Final assembly, kitting, and quality checks may also be performed closer to key demand centers to reduce lead times and improve serviceability.
Downstream, products move through regional distributors, dive-specialty stores and service centers, which act as a key node for regulator servicing, fit, and training-linked sales. Fast-growing e-commerce and direct-to-consumer channels add new dynamics, bundling financing, digital fitting guidance, and software subscriptions for computers. Training agencies and industry bodies (for example, SDI/TDI for training standards and ADCI for commercial-diving consensus standards) influence equipment specifications and maintenance practices via curriculum and compliance expectations, while trade associations such as DEMA support industry coordination and demand sensing through its Manufacturing Purchase Index updates shared with members. Persistent friction points include tariff and trade-policy exposure for imported products, and the need for diversified sourcing and hybrid assembly models to stabilize availability across seasonal peaks in major tourism markets.
Competitive Landscape
The scuba diving equipment market shows a moderate level of concentration, where a handful of key players hold considerable influence, yet ample room remains for smaller brands and new entrants to grow. These dynamic supports both consolidation plays and niche specialization strategies. A major shift occurred in June 2025, when HEAD Group acquired Aqua Lung International, marking one of the most impactful consolidation moves in the industry. The merger brought together complementary brands and expanded distribution networks, creating greater pricing leverage and innovation capabilities, especially in the premium segment. This newly formed multi-brand powerhouse now competes across all product categories and global markets, setting the stage for further consolidation as other players seek similar scale advantages.
Technology integration is emerging as a critical factor in shaping competitive advantage. Companies like Garmin and Apple are leveraging their consumer electronics expertise, particularly in battery life and display technologies, to challenge traditional dive computer makers. This trend is reshaping the competitive landscape into strategic clusters: legacy brands focusing on technical precision and reliability, tech firms pushing smart connectivity and integration, and agile direct-to-consumer startups appealing to budget-conscious consumers through digital channels. These distinct approaches offer multiple pathways to success depending on the target audience and brand positioning. E-commerce and social media have further empowered newer brands to reach global audiences without relying on traditional retail infrastructure.
White-space opportunities in the market are expanding, particularly in areas tied to innovation and sustainability. There is growing demand for diving gear made with eco-friendly materials, as well as smart equipment offering AI-powered safety features. Integrated surface-support systems that enhance diver monitoring and communication are also gaining interest, both from individual divers and professional operators. These innovations not only improve user experience and safety but also open recurring revenue models for equipment makers and service providers. As the industry evolves, companies that align with these trends are likely to capture untapped value and differentiate themselves in a crowded market.
Scuba Diving Equipment Industry Leaders
Aqua Lung International
Johnson Outdoors – SCUBAPRO
Mares (HEAD Sport GmbH)
Cressi Sub SpA
Huish Outdoors (Atomic, Oceanic, Zeagle, Hollis)
- *Disclaimer: Major Players sorted in no particular order
Scuba Diving Equipment Market Companies Covered in this Report
- Aqua Lung International
- Johnson Outdoors (Scubapro)
- Mares (HEAD Sport GmbH)
- Cressi Sub SpA
- Huish Outdoors (Atomic Aquatics, Oceanic, Zeagle, Hollis)
- TUSA (Tabata Co., Ltd.)
- Sherwood Scuba
- Poseidon Diving Systems
- Apeks Marine Equipment
- Seacsub S.p.A.
- Suunto Oy
- Shearwater Research
- Garmin Ltd. (Descent Series)
- Dive Rite
- BARE Sports
- Beuchat International
- OMS (Ocean Management Systems)
- Ocean Reef Group
- Fourth Element
- XS Scuba

Market Opportunities and Future Outlook
Product and channel white space is opening around sustainability-led materials, verified environmental practices, and digitally connected equipment ecosystems that can shorten replacement cycles and add recurring software and service revenue. A clear proof point is the shift in exposure protection toward lower-impact materials: Fourth Element launched the Xenos ARC wetsuit in February 2026 using natural rubber and recycled textiles, and brands across apparel and accessories are expanding recycled inputs to match diver preferences and retailer requirements in eco-sensitive destinations.
Another opportunity area sits at the intersection of regulation and destination management, where operator licensing and environmental programs influence what gear gets recommended, rented, and serviced. The Green Fins program, supported by UNEP and partners, is being harmonized across multiple Southeast Asian countries following a March 2026 regional workshop in Bali. Destination regulators such as Thailand (measures effective 22 April 2025) and Egypt (CDWS operating as the sectors inspection and auditing body, aligned to ISO 24803 and related standards) are raising the bar on operational compliance. These shifts support demand for equipment with auditable servicing records, low-impact consumables (including biodegradable lubricants referenced in European sustainability-oriented practices), and connected dive computers and surface safety systems that help operators document safer, more standardized dive operations across high-traffic tourism hubs.
Recent Industry Developments in Scuba Diving Equipment Market
- May 2026: SCUBAPRO launched a regulator promotion program offering a free R105 OCTOPUS with qualifying regulator system purchases through June 30, 2026. The campaign supported sell-through of core life-support equipment via retail and dealer networks while reinforcing bundled purchasing behavior around regulator setups.
- July 2025: HEAD Group completed its takeover of Aqua Lung International, consolidating major scuba brands under one owner and broadening global distribution reach. The deal strengthened scale advantages in premium regulators, BCDs, and training-linked channels, and it intensified competitive pressure on independent legacy manufacturers.
- August 2024: Queensland introduced the Recreational Diving, Recreational Technical Diving and Snorkelling Code of Practice 2024 under the Safety in Recreational Water Activities Act 2011, effective August 1, 2024. The code formalized operational safety expectations for commercial providers, supporting demand for compliant equipment, servicing, and documentation through local dive operators and training partners.


Scuba Diving Equipment Market Report Scope and Research Methodology
Market Definition and Coverage
This market covers scuba diving equipment that is purchased or replaced for underwater diving activities and is tracked as revenue generated across key product groups and sales channels globally.
Scope exclusions: We exclude non-equipment services such as dive training, travel packages, resort fees, and boat charters, and we also exclude general swim gear that is not meant for scuba use.
Segments Covered in This Report
- By Product
- Regulators and Rebreathers
- Bags and Apparel
- Gauges and Dive Computers
- By Distribution Channel
- E-commerce
- Hypermarkets and Supermarkets
- Specialty Stores
- By End-User
- Recreational Divers
- Professional & Technical Divers
- Military & Public Safety Divers
- By Geography
- North America
- United States
- Canada
- Mexico
- South America
- Brazil
- Peru
- Chile
- Argentina
- Rest of South America
- Europe
- United Kingdom
- Germany
- France
- Spain
- Italy
- BENELUX (Belgium, Netherlands, Luxembourg)
- NORDICS (Denmark, Finland, Iceland, Norway, Sweden)
- Rest of Europe
- Asia-Pacific
- India
- China
- Japan
- Australia
- South Korea
- South East Asia (Singapore, Malaysia, Thailand, Indonesia, Vietnam, Philippines)
- Rest of Asia-Pacific
- Middle East and Africa
- United Arab Emirates
- Saudi Arabia
- South Africa
- Nigeria
- Rest of Middle East and Africa
- North America
Data Sources, Market Sizing, and Validation
Desk Research
Desk research was used to build the base structure for the model and to set realistic boundaries around what should be counted as scuba diving equipment revenue. We referenced public, non-paywalled sources such as the World Tourism Organization (UNWTO), the World Bank, national tourism boards (for coastal and dive tourism indicators), the U.S. Bureau of Labor Statistics (for inflation signals used in price normalization), and International Trade Centre (ITC) trade statistics (for directional import and export trends tied to equipment categories).
We also reviewed company filings, investor presentations, product catalogs, and association or event websites tied to diving and watersports, since these sources help confirm what product lines are actively sold and how channels are evolving. Where needed, paid subscriptions for company financials and intelligence, patent databases, and shipment-level import export data were used to sanity-check product mix and pricing direction without relying on a single disclosure. The sources listed above are illustrative, and many other public references were also used for data collection, validation, and clarification during the study.
Primary Interviews and Surveys
Primary interviews and surveys were used to pressure-test what we saw in published sources, especially around product replacement cycles, channel margins, and the demand split between recreational versus professional and technical users. We spoke with a mix of manufacturers, distributors, specialty retailers, service centers, and diving instructors across APAC, EMEA, and the Americas so assumptions could be checked against real buying behavior and seasonality patterns.
Distribution of primary research fieldwork respondents
| Company type | Respondent position | Region |
|---|---|---|
| Top tier: 39% | CXOs: 12% | APAC: 43% |
| Mid tier: 45% | Functional/Unit leaders: 31% | EMEA: 31% |
| Smaller Players: 16% | Managers: 57% | Americas: 26% |
Market-Sizing & Forecasting
For sizing, a top-down build was first created by mapping the global demand pool through participation and travel-related diving activity signals, which were then translated into equipment demand using replacement and adoption rates discussed in interviews. Once the demand pool was constructed, it was split across major equipment groups such as regulators and rebreathers, bags and apparel, and gauges and dive computers, followed by channel-level allocation across specialty stores, e-commerce, and mass retail.
To keep the totals realistic, we corroborated outputs with selective bottom-up approximations, including sampled price points by product category, check calculations using volume proxies from trade flows where relevant, and channel checks on typical sell-through patterns. Key model inputs included certified diver base and active diver frequency, dive tourism intensity by region, average replacement cycles for core life-support equipment, mix shifts toward AI-enabled dive computers, and inflation-adjusted average selling price movement for gear refreshes. Forecasting was run using scenario analysis supported by expert views on tourism recovery and discretionary spending, and the scenarios were converted into a single base case after variance checks. Where direct volume indicators were missing for a country or channel, gaps were handled using proxy ratios from similar markets and then re-validated with primary feedback before finalization.
Data Validation & Update Cycle
Outputs are validated through cross-checks against independent signals, such as regional tourism flow direction, trade trend direction for relevant equipment groupings, and observed pricing movement in retail listings. If a country or segment result looks out of line, the assumptions are reworked and we re-contact selected respondents to confirm whether the variance is a real market shift or a modeling issue.
Before sign-off, the model goes through multi-step analyst reviews so calculation logic, conversions, and trend assumptions are consistent across regions and years. The report is refreshed annually, and interim updates are made when material events occur that can change demand or pricing assumptions, such as sharp travel disruptions or major channel shifts. Right before delivery, a final pass is done to align the outputs with the latest available public indicators and interview feedback.
Mordor Intelligence's Global Scuba Diving Equipment Market Size Compared With Other Published Estimates
Published market sizes for scuba diving equipment can look far apart because each publisher counts a different product set, uses different time frames, and applies its own price and replacement assumptions. Currency conversion timing and how online sales are treated also influence the final number, even when the topic name looks the same.
The main gap comes from whether adjacent categories such as exposure suits and general waterwear are counted inside the total, where Mordor Intelligence treats the core scuba equipment scope around regulators and rebreathers, bags and apparel, and gauges and dive computers, and keeps the market tied to equipment revenue rather than broader watersports spend.
Benchmark comparison
| Source | Market Size | Gaps in Research Methodology |
|---|---|---|
| Mordor Intelligence | USD 0.86 B (2026) | |
| Industry Publisher A | USD 5.17 B (2025) | Uses a broader equipment definition that can roll in cylinders, decompression chambers, and other adjacent gear, and it reports a different base year and forecast window, which changes implied replacement and pricing paths. |
| Industry Publisher B | USD 2.20 B (2025) | Often includes exposure suits, masks, fins, and other accessories as a large share of spend, and the longer forecast horizon relies on a smoother CAGR path that can dilute near-term travel and seasonality swings. |
Taken together, the spread mainly reflects scope choices and how price and replacement behavior are translated into revenue by year. When scope is kept consistent and the assumptions are tied back to observable activity signals and channel reality, the estimate becomes easier to replicate and to use for planning.


Key Questions Answered in the Report
How large is the scuba diving equipment market in 2026?
The sector generated USD 0.86 billion in 2026 and is on track to hit USD 1.17 billion by 2031.
What is the projected CAGR for scuba diving equipment through 2031?
The market is forecast to expand at an annualized 6.32% up to 2031.
Which product category is growing fastest?
Gauges & Dive Computers lead with a 6.53% CAGR, driven by AI integration and smartwatch compatibility.
Why is Asia-Pacific considering the most attractive growth region?
Rising middle-class incomes, expanding certification programs, and government-funded artificial reefs underpin a 6.05% CAGR.
How are sustainability trends influencing product innovation?
Manufacturers are moving to recycled plastics, solvent-free neoprene, and bio-rubber, often commanding price premiums in Europe and North America.
What impact did HEAD Group’s acquisition of Aqua Lung have on competition?
The deal created the first multi-brand powerhouse, giving the combined entity greater pricing power and cross-category innovation capability.
Page last updated on:


 Your data is secure and never sold or shared.


