Market Overview
| Study Period | 2021 - 2031 |
|---|---|
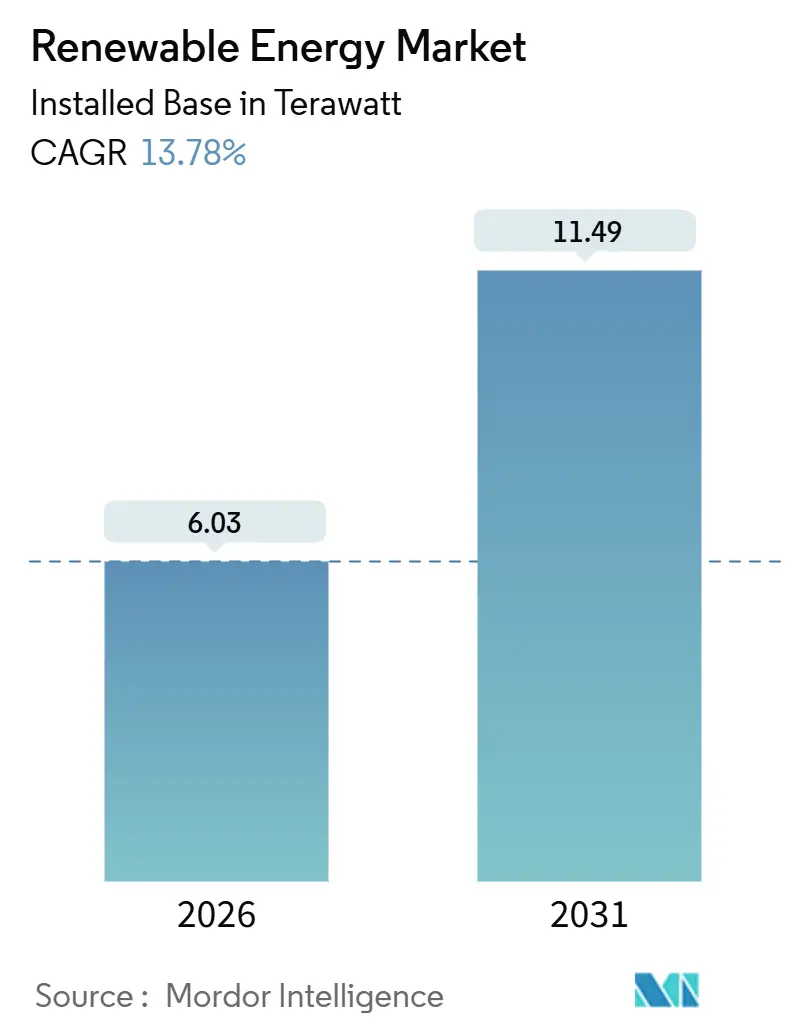
| Market Volume (2026) | 6.03 Terawatt |
| Market Volume (2031) | 11.49 Terawatt |
| Growth Rate (2026 - 2031) | 13.78% CAGR |
| Fastest Growing Market | Asia Pacific |
| Largest Market | Asia Pacific |
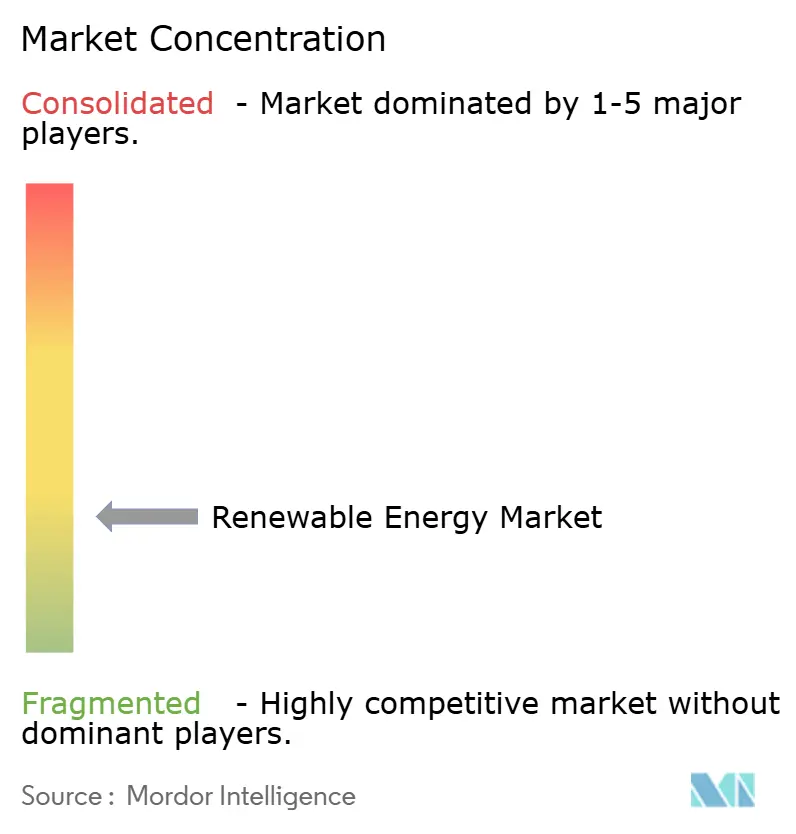
| Market Concentration | Low |
Major Players *Disclaimer: Major Players sorted in no particular order Image © Mordor Intelligence. Reuse requires attribution under CC BY 4.0. | |
Renewable Energy Market Analysis by Mordor Intelligence
The Renewable Energy Market size in terms of installed base is expected to grow from 6.03 Terawatt in 2026 to 11.49 Terawatt by 2031, at a CAGR of 13.78% during the forecast period (2026-2031).
This expansion is anchored by multi-gigawatt corporate power-purchase agreements that pull projects forward, alongside green-hydrogen ventures that create demand unlinked to traditional grids. Module cost compression, faster permitting, and electrolyzer-driven offtake are converging to make incremental capacity economically attractive even in saturated markets. Competitive dynamics are shifting as independent power producers combine low cost of capital with turnkey EPC offerings, steadily eroding the position of vertically integrated utilities. Meanwhile, hybrid solar-wind-storage systems are emerging as a hedge against curtailment, offering dispatchable renewable electricity that accelerates long-duration storage adoption. In this context, the renewable energy market will see rising margin pressure on legacy developers but expanded opportunity for OEMs that integrate downstream.
Key Report Takeaways
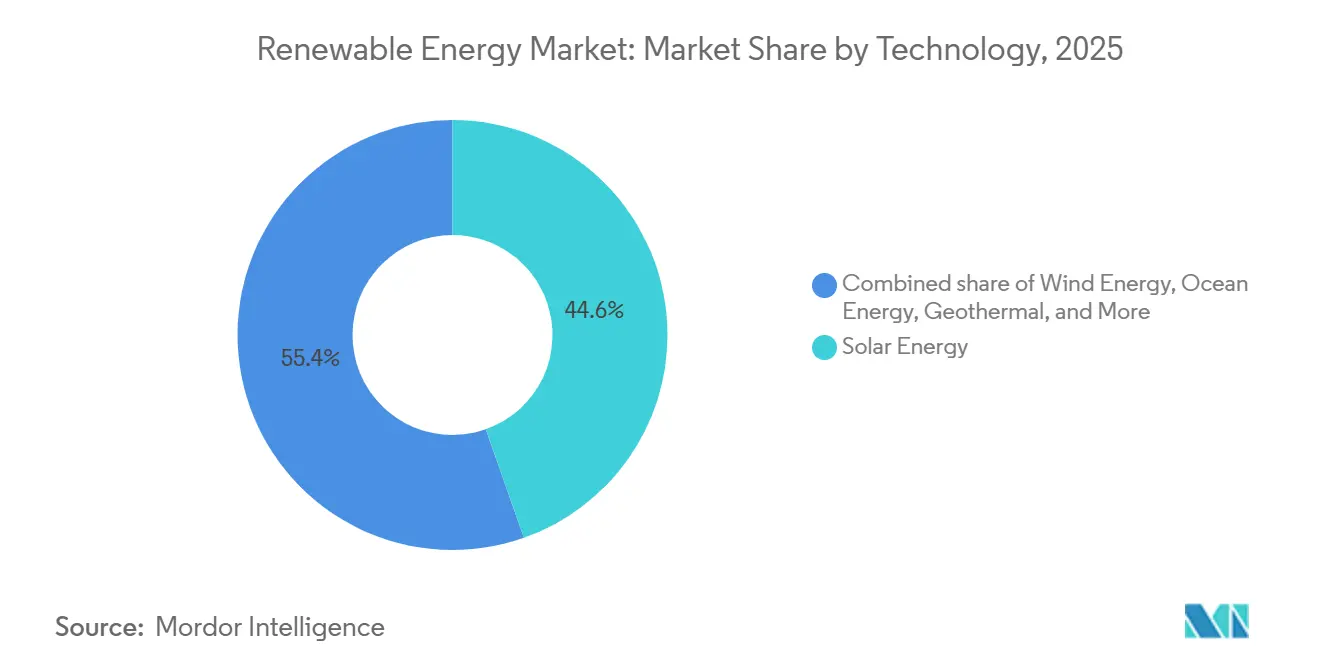
- By technology, Solar Energy accounted for 44.61 of % renewable energy market share in 2025, while Ocean Energy is forecast to advance at a 36.95% CAGR to 2031.
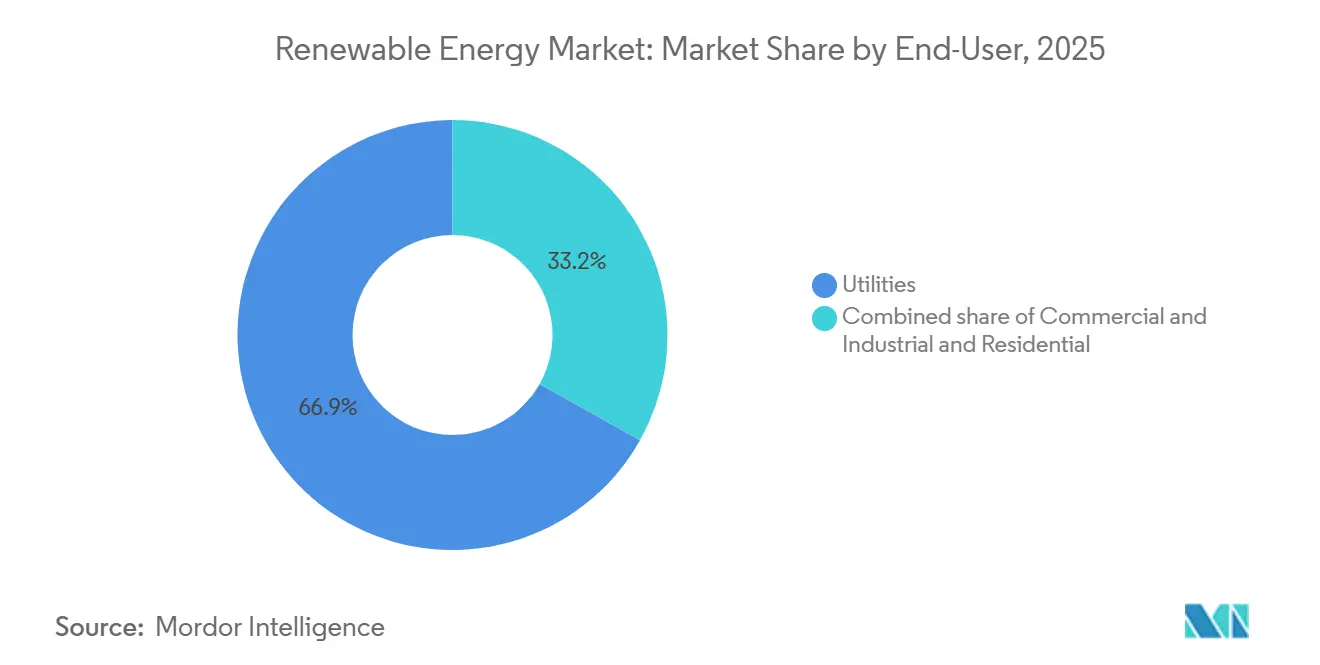
- By end-user, Utilities held 66.85% share of the renewable energy market size in 2025, whereas the Commercial and Industrial segment is growing at 16.73% CAGR through 2031.
- By geography, Asia-Pacific commanded 57.23% of installed capacity in 2025, and is accelerating at a 16.19% CAGR between 2026 and 2031.
Note: Market size and forecast figures in this report are generated using Mordor Intelligence’s proprietary estimation framework, updated with the latest available data and insights as of January 2026.
Global Renewable Energy Market Trends and Insights
Drivers Impact Analysis
| Driver | (~) % Impact on CAGR Forecast | Geographic Relevance | Impact Timeline |
|---|---|---|---|
| Corporate PPAs accelerating utility-scale builds | +2.8% | North America, Europe, APAC spillover | Medium term (2-4 years) |
| Hyperscale data-center demand boosting solar-wind procurement | +1.9% | Nordics, Ireland, U.S. Pacific Northwest | Short term (≤ 2 years) |
| Green-hydrogen gigawatt pipelines driving capacity additions | +2.4% | MENA, Australia, Chile | Long term (≥ 4 years) |
| EU REPowerEU fast-track permitting cutting onshore-wind lead times | +1.6% | Southern Europe (Spain, Italy, Greece) | Short term (≤ 2 years) |
| Source: Mordor Intelligence | |||
Understand The Key Trends Shaping This Market
Download PDF
Corporate Power-Purchase Agreements Accelerating Utility-Scale Builds in North America & Europe
Corporate PPAs have matured into 15-20-year balance-sheet hedges that replace merchant risk with investment-grade credit, allowing developers to reach financial close more quickly than under traditional utility tenders. Meta’s 1.5 GW portfolio with RWE in 2024 exemplifies how data-center offtakers underwrite multi-country pipelines, compressing solar build cycles to under 24 months and onshore wind to roughly 30 months. Developers prioritize contracted projects over speculative assets, so the renewable energy market is now paced by large buyers rather than regulators. As more corporates set science-based targets, aggregate demand is expected to exceed 40 GW of new capacity annually through 2030, reinforcing the long-term trajectory of the renewable energy market. The resulting visibility lowers the weighted average cost of capital and lifts the deployment ceiling in high-penetration grids.
Hyperscale Data-Centre Demand Boosting Solar-Wind Procurement in the Nordics & Ireland
AI workloads are driving electricity growth at cloud campuses, pushing operators to lock in renewable generation in regions with surplus hydro and wind. Google’s 500 MW Norwegian wind deal illustrates how firms exploit the Nordics’ clean-power mix, whereas grid congestion around Dublin has shifted investment toward Sweden and Finland. The renewable energy market responds by developing on-site solar and storage that reduce dependence on transmission-constrained nodes. This dynamic channels capital into distributed assets, encouraging grid-forming inverters and microgrid architectures. Near-term demand elasticity remains high, and developers that can bundle generation with batteries gain preferred-supplier status with hyperscalers.
Green-Hydrogen Gigawatt Pipelines Driving Capacity Additions in MENA & Australia
Projects such as Saudi Arabia’s NEOM (4 GW wind-solar hybrid) and Fortescue’s 5 GW Pilbara complex are contracting renewable output directly for electrolyzers, circumventing grid offtake and spawning a vertically integrated value chain. Because hydrogen buyers sign 20-year supply agreements, developers secure revenue certainty comparable to PPAs, but with commodity upside if ammonia and e-methanol markets tighten. The renewable energy market, therefore, gains a second, parallel demand channel likely to represent 10-15% of global additions by 2030. Electrolyzer-linked renewables also favor high-capacity-factor sites, accelerating wind and solar build-outs in sparsely populated deserts and coastal zones.
EU REPowerEU Fast-Track Permitting Cutting Onshore-Wind Lead-Times in Southern Europe
Spain’s approval of 3.2 GW of projects in 2024 under the fast-track regime demonstrates the value of one-year environmental reviews.[1]European Commission, “REPowerEU permitting reforms,” europa.eu Developers in Italy and Greece report similar acceleration, shaving two to three years off pre-construction schedules. For the renewable energy market, this frees scarce EPC resources and heavy-lift cranes for additional projects, indirectly lowering balance-of-plant costs. Coupled with supportive auction floors, Southern Europe is emerging as a cost-competitive wind corridor, offsetting Northern Europe’s vessel bottlenecks. Over the next two years, an incremental 5 GW annually could come online sooner than prior baseline outlooks suggested, nudging the overall renewable energy market size higher than consensus.
Restraints Impact Analysis
| Restraint | (~) % Impact on CAGR Forecast | Geographic Relevance | Impact Timeline |
|---|---|---|---|
| Grid Congestion & Curtailment Risks in ERCOT and Inner Mongolia | -1.40% | US (Texas), China (Inner Mongolia, Gansu) | Short term (≤ 2 years) |
| End-of-Life Blade Waste Regulations Raising Costs in Germany & France | -0.80% | Germany, France, EU-wide spillover | Medium term (2-4 years) |
| Lack of Long-Duration Storage Slowing High VRE Penetration in SE-Asia | -1.10% | Southeast Asia (Vietnam, Thailand, Indonesia, Philippines) | Medium term (2-4 years) |
| Local-Content Mandates Inflating Offshore-Wind CAPEX in India & Brazil | -0.90% | India, Brazil, emerging offshore markets | Long term (≥ 4 years) |
| Source: Mordor Intelligence | |||
Grid Congestion & Curtailment Risks in ERCOT (US) and Inner Mongolia (CN)
ERCOT curtailed 3.2 TWh of renewable electricity in 2024 as West Texas output overwhelmed transmission to Houston. Interconnection queues now exceed five years, delaying projects such as Enel’s 300 MW Azure Sky wind farm until 2026. In China, Inner Mongolia’s curtailment still hovers near 4%, prompting price discounts of 15-20% to place power with eastern buyers. These factors trim internal rates of return and temporarily defer roughly 10 GW of high-resource wind and solar additions. While new HVDC lines will eventually alleviate constraints, short-term drag on the renewable energy market CAGR is inevitable.
End-of-Life Blade Waste Regulations Raising Costs in Germany & France
Germany’s Circular Economy Act and France’s parallel mandate now require 85% blade-mass recycling, lifting decommissioning costs to USD 16,000-27,000 per blade.[2]German Federal Ministry for the Environment, “Circular Economy Act,” bmuv.de For older 3 MW turbines nearing 20-year lifespans, this adds 2-3% to the levelized cost of energy, encouraging operators to retrofit rotors rather than repower wholesale. The ripple effect slows replacement demand for new turbines, marginally capping upside for the renewable energy market until recycling supply chains scale and unit costs fall.
Segment Analysis
By Technology: Ocean Energy Surges from Niche Base
Ocean Energy’s 36.95% CAGR from 2026 to 2031 makes it the fastest-growing slice of the renewable energy market. Orbital Marine Power’s 2 MW O2 tidal turbine in Orkney achieved a 74% capacity factor in its debut year, well above offshore wind norms, illustrating tidal predictability.[3]Orbital Marine Power, “O2 turbine performance,” orbitalmarine.com Minesto’s Dragon 12 kites convert low-velocity currents into useful electricity, expanding the resource base beyond high-flow straits. Solar Energy, at 44.61% renewable energy market share in 2025, maintains leadership thanks to crystalline-silicon panel prices that fell to USD 0.12 per watt in 2024 as polysilicon costs dropped below USD 8 per kilogram. Efficiency gains above 25% for TOPCon and heterojunction cells further compress balance-of-system expenses, sustaining competitive parity even in temperate zones.
Wind Energy contributes about 35% of 2025 capacity, benefiting from streamlined EU permitting and upgraded grid links in China. Offshore wind, however, faces escalating CAPEX for floating foundations that run USD 4-5 million per MW, compared with USD 3-4 million for fixed platforms. Hydropower expands modestly as site availability wanes, though China’s 2.4 GW Baihetan pumped-storage plant demonstrates the value of eight-hour storage in a variable-renewable grid.[4]China Three Gorges Corporation, “Baihetan project,” ctgpc.com Bioenergy and Geothermal remain niche at under 8%, constrained by feedstock price volatility and limited high-enthalpy reservoirs, yet Iceland’s 90 MW Theistareykir expansion shows geothermal’s baseload appeal. Collectively, technology diversification shields the renewable energy market from single-segment risk while offering investors multiple entry points.
Note: Segment shares of all individual segments available upon report purchase
Get Detailed Market Forecasts at the Most Granular Levels
Download PDF
By End-User: Commercial and Industrial Segment Outpaces Utilities
Commercial and Industrial buyers are expanding their share of the renewable energy market at a 16.73% CAGR, propelled by scope-2 emissions targets and inflation hedging. Amazon Web Services’ 250 MW Irish wind deal and Microsoft’s 10.5 GW Brookfield PPA illustrate hyperscalers’ pivot toward direct procurement. Virtual PPAs allow these buyers to detach from transmission constraints, aggregating generation from geographically dispersed assets to smooth intermittency. This structural shift reduces merchant risk and shortens payback periods for developers, catalyzing incremental gigawatts of capacity that expand the overall renewable energy market size.
Utilities still account for 66.85% of installed capacity in 2025, largely to meet renewable portfolio standards and replace aging fossil fleets. Yet growth is slowing in grids where variable renewables already exceed 30%; ERCOT, for instance, now channels capital toward storage and transmission upgrades rather than pure generation. NextEra Energy’s 2024 pivot toward co-located batteries exemplifies the changing investment mix. Residential adoption lags due to upfront costs ranging from USD 15,000-25,000 per rooftop system after incentives, combined with uncertain net-metering regimes. Community solar offers a partial remedy in U.S. states with supportive policy, but regulatory fragmentation tempers scale, leaving households a peripheral slice of the renewable energy market.
Note: Segment shares of all individual segments available upon report purchase
Get Detailed Market Forecasts at the Most Granular Levels
Download PDF
Geography Analysis
Asia-Pacific dominated with 57.23% of capacity in 2025 and is forecast to advance at a 16.19% CAGR, led by China’s 216 GW of 2024 installations and India’s 500 GW 2030 target. Chinese state-owned developers are also exporting capital and equipment into Southeast Asia, Latin America, and Africa through concessional loans that bundle modules, turbines, and EPC services. India’s offshore-wind tenders and production-linked incentives aim to localize manufacturing, curbing Chinese import reliance.
North America’s build-out accelerates under the Inflation Reduction Act, which extends tax credits to 2032 and has already catalyzed USD 150 billion in domestic manufacturing commitments. The United States deployed 32 GW of solar and 8 GW of wind in 2024, although ERCOT’s curtailments reveal transmission lag. Canada targets 90% renewable electricity by 2030 using hydropower and offshore wind, whereas Mexico’s regulatory changes have chilled private investment despite strong irradiance. Europe leverages REPowerEU to compress permitting, with Spain and Greece benefiting most; Germany still battles interconnection delays exceeding 24 months.
The Middle East and Africa emerge as hydrogen exporters, evidenced by Saudi Arabia’s NEOM (4 GW electrolyzer) and Egypt’s 10 GW Gulf of Suez wind plan. South America’s growth revolves around Brazil’s 4 GW wind auction and Chile’s USD 25/MWh solar corridor. Argentina co-locates solar with lithium mines to decarbonize processing. These regional dynamics collectively broaden the renewable energy market footprint and diversify supply chains.

Get Analysis on Important Geographic Markets
Download PDF
Competitive Landscape
The renewable energy market remains moderately fragmented, with the top 10 developers controlling about 35-40% of global capacity. Independent power producers such as Brookfield Renewable and Invenergy are gaining ground because institutional capital and lean organizations permit rapid execution outside regulated frameworks. Microsoft’s 10.5 GW multi-year PPA with Brookfield is a watershed, underscoring the pivot toward de-risked mega-pipelines. OEMs like Vestas are integrating downstream, purchasing 500 MW of Spanish projects in 2024 to guarantee turbine offtake and margin retention.
Hybrid solar-wind-storage packages are proliferating. Fluence and Powin partner with developers to embed battery systems that capture frequency and reserve revenue historically reserved for gas peakers. Floating offshore wind developers Equinor and Ørsted accumulate seabed leases before rivals master mooring technologies, raising entry barriers. Patent filings for grid-forming inverters rose 28% in 2024, signaling that control software and power electronics confer a competitive advantage. The net effect is escalating technology differentiation even as asset ownership fragments, shaping a renewable energy market where intellectual property and project pipeline depth both confer leverage.
Renewable Energy Industry Leaders
NextEra Energy, Inc.
Ørsted A/S
Iberdrola, S.A.
Vestas Wind Systems A/S
JinkoSolar Holding Co. Ltd.
- *Disclaimer: Major Players sorted in no particular order
Need More Details on Market Players and Competitors?
Download PDF
Recent Industry Developments
- May 2025: REplace raised USD 2.1 million for an AI site-selection platform that speeds renewable project development.
- May 2025: Toyota Boshoku America began a 5.7 MW solar build at its Kentucky plant.
- January 2025: The USD 1.2 billion Valmy Grassroots solar-plus-storage project was announced in Nevada.
- January 2024: The Hunter Hydrogen Infrastructure Masterplan launched in Australia, charting a path to a leading hydrogen hub.
Research Methodology Framework and Report Scope
Market Definitions and Key Coverage
Our study defines the global renewable energy market as the cumulative installed capacity of electricity-generating assets that employ sunlight, wind, flowing water, biomass, geothermal heat, or marine resources, expressed in gigawatts of name-plate capacity. We track new and operating utility-scale and distributed units recorded in national grid and regulator registers, while retired equipment is netted out.
Scope Exclusion: We omit nuclear facilities, fossil-based cogeneration, and conventional pumped-storage plants that are classified as storage.
Segmentation Overview
- By Technology
- Solar Energy (PV and CSP)
- Wind Energy (Onshore and Offshore)
- Hydropower (Small, Large, PSH)
- Bioenergy
- Geothermal
- Ocean Energy (Tidal and Wave)
- By End-User
- Utilities
- Commercial and Industrial
- Residential
- By Geography
- North America
- United States
- Canada
- Mexico
- Europe
- United Kingdom
- Germany
- France
- Spain
- Nordic Countries
- Russia
- Rest of Europe
- Asia-Pacific
- China
- India
- Japan
- South Korea
- Malaysia
- Thailand
- Indonesia
- Vietnam
- Australia
- Rest of Asia-Pacific
- South America
- Brazil
- Argentina
- Colombia
- Rest of South America
- Middle East and Africa
- Saudi Arabia
- United Arab Emirates
- South Africa
- Egypt
- Rest of Middle East and Africa
- North America
Detailed Research Methodology and Data Validation
Primary Research
We speak with project developers, OEM executives, utilities, grid planners, and multilateral financiers across five continents to test desk-research assumptions, refine average selling prices, and verify project-slippage rates that raw databases miss.
Desk Research
Mordor analysts begin with tier-one public datasets such as IEA Renewables Tracker, IRENA statistics, US EIA International Outlook, Eurostat energy balances, and World Bank indicators, then layer in regulatory gazettes, auction results, and customs shipment logs that clarify commissioning dates and price bands. We also license D&B Hoovers for company capacity disclosures and Dow Jones Factiva for finance news that confirm commercial-operation milestones.
The sources named are illustrative; many additional public and paid repositories support data collection, validation, and research clarification.
Market-Sizing & Forecasting
We employ a top-down reconstruction of every country's renewable fleet using official ledgers, which is then rolled forward with announced auction awards, construction-progress ratios, and historic target-to-commissioning conversion. Sampled supplier roll-ups (for example, exported solar modules multiplied by utilization) offer a bottom-up reasonableness check before figures are locked. Key variables like auction volumes, technology learning rates, grid-connection lead times, balance-of-system costs, and capacity-factor gains feed a multivariate regression with scenario analysis to extend forecasts through 2030, while clear rules address gaps in bottom-up evidence.
Data Validation & Update Cycle
Our outputs pass variance tests, peer reviews, and senior sign-off before publication. Models refresh annually, with interim updates triggered by policy shifts or project announcements that change the outlook by more than five gigawatts.
Why Mordor's Renewable Energy Baseline Commands Reliability
Published estimates often diverge because some firms value equipment sales, others bundle certificates or storage, and many freeze exchange rates at dated points. By focusing on on-grid capacity and refreshing each year, Mordor minimizes such noise.
Key gap drivers include mixed revenue and capacity metrics, inclusion of ancillary services, aggressive learning-rate multipliers, and slower update cadences found elsewhere.
Benchmark comparison
| Market Size | Anonymized source | Primary gap driver |
|---|---|---|
| 5.08 TW (2025) | Mordor Intelligence | - |
| USD 1.51 trillion (2024) | Global Consultancy A | Values hardware, EPC, and O&M revenues; mixes capacity and spending; constant 2021 dollars |
| USD 1.02 trillion (2024) | Industry Association B | Excludes off-grid micro-grids; biennial updates; single FX snapshot |
These contrasts show that when scope, units, and refresh cadence shift, totals naturally vary. Mordor's disciplined approach offers decision-makers a transparent, reproducible baseline they can trust.
Need A Different Region or Segment?
Customize Now
Key Questions Answered in the Report
How large is the global renewable energy market in 2026?
Installed capacity reaches 6,030.39 GW in 2026, rising toward 11,498.32 GW by 2031 at a 13.78% CAGR.
Which technology holds the largest share?
Solar Energy accounts for 44.61% of renewable energy market share in 2025, far ahead of other segments.
What region leads capacity additions?
Asia-Pacific commands 57.23% of 2025 capacity and grows at a 16.19% CAGR, driven by China and India.
Why are corporate PPAs important?
PPAs provide long-term revenue certainty that lowers financing costs and accelerates multi-gigawatt build-outs.
What is the fastest-growing end-user segment?
Commercial and Industrial buyers expand at 16.73% CAGR through 2031, propelled by behind-the-meter solar and virtual PPAs.


