Market Overview
| Study Period | 2021 - 2031 |
|---|---|
| Forecast Data Period | 2026 - 2031 |
| Historical Data Period | 2021 - 2024 |
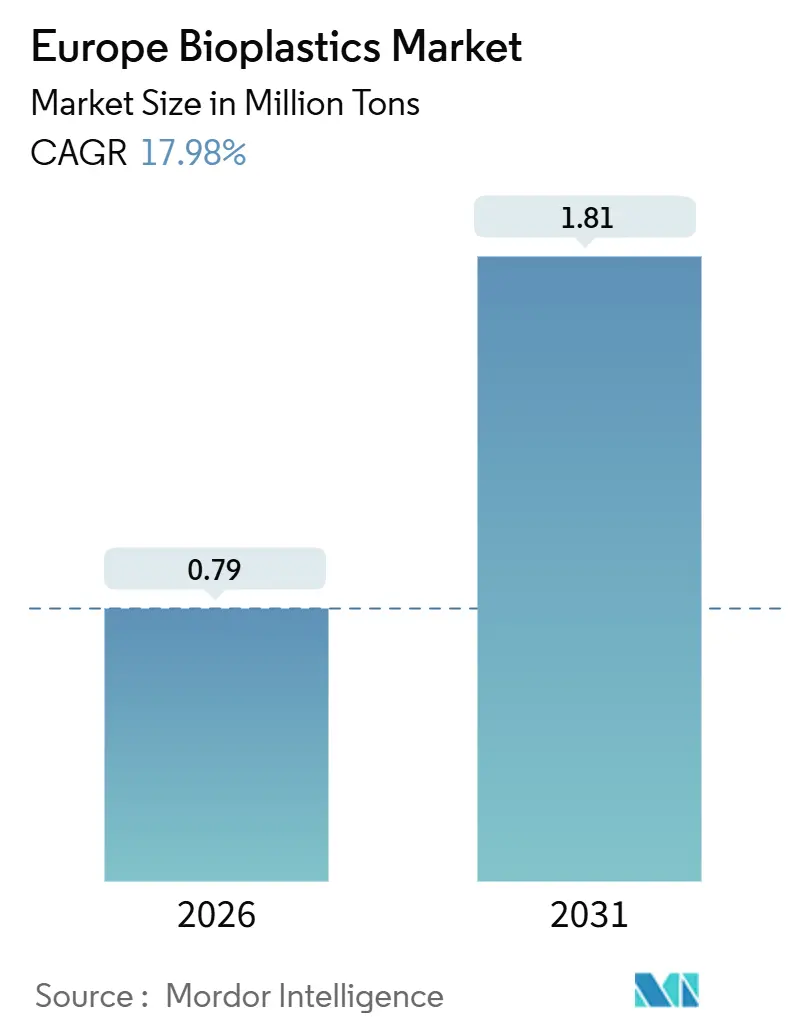
| Market Volume (2026) | 0.79 Million tons |
| Market Volume (2031) | 1.81 Million tons |
| Growth Rate (2026 - 2031) | 17.98% CAGR |
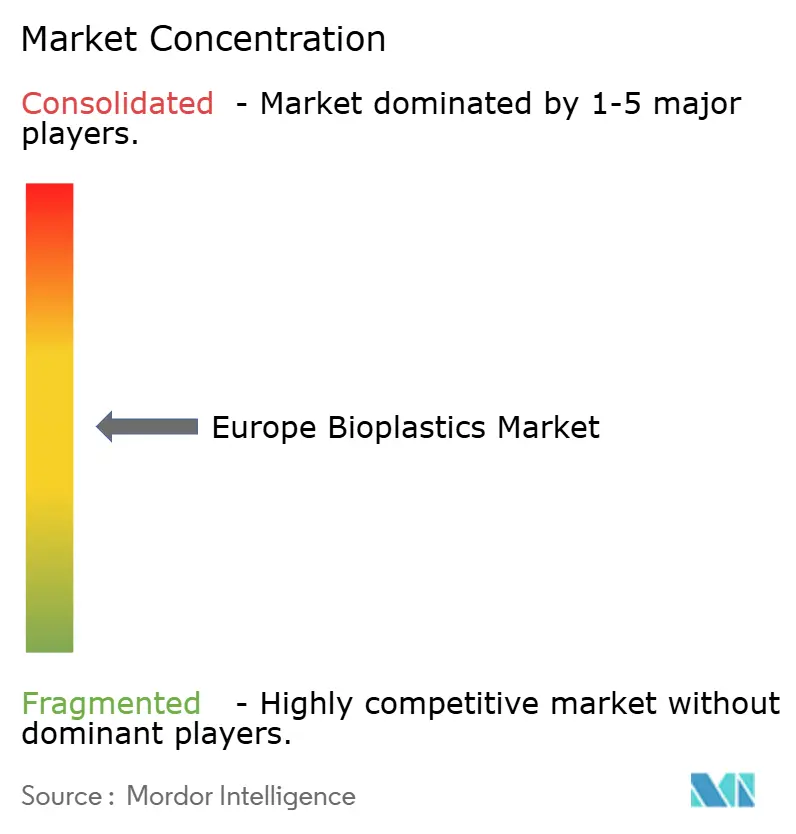
| Market Concentration | Medium |
Major Players *Disclaimer: Major Players sorted in no particular order Image © Mordor Intelligence. Reuse requires attribution under CC BY 4.0. | |
Europe Bioplastics Market Analysis by Mordor Intelligence
The Europe Bioplastics Market size is estimated at 0.79 million tons in 2026, and is expected to reach 1.81 million tons by 2031, at a CAGR of 17.98% during the forecast period (2026-2031). This steep climb is fueled by the European Union Carbon Border Adjustment Mechanism, brand-owner net-zero mandates, and the widening price discipline that now favors certified bio-content resins over fossil polymers. Strong policy signals accelerate drop-in adoption of bio-PE and bio-PET, while compostable grades enjoy a regulatory tailwind from the Single-Use Plastics Directive. Tightened Extended Producer Responsibility fees in the United Kingdom amplify the shift toward renewable inputs, whereas lignocellulosic integration inside Nordic pulp mills secures feedstock at lower cost. Commercial customers lock in multi-year offtake agreements that cushion producers against crude oil volatility, and patent activity around PHA and marine-degradable copolymers signals steady innovation momentum. Converters without long-term energy contracts face margin compression as German electricity rates run double the 2020 baseline, yet new capital still flows into PLA and PHA capacity because buyers prize carbon reductions over short-term price swings.
Key Report Takeaways
- By type, bio-based biodegradables held 59.81% of Europe bioplastics market share in 2025 and are anticipated to grow with a CAGR of 22.59% through 2031.
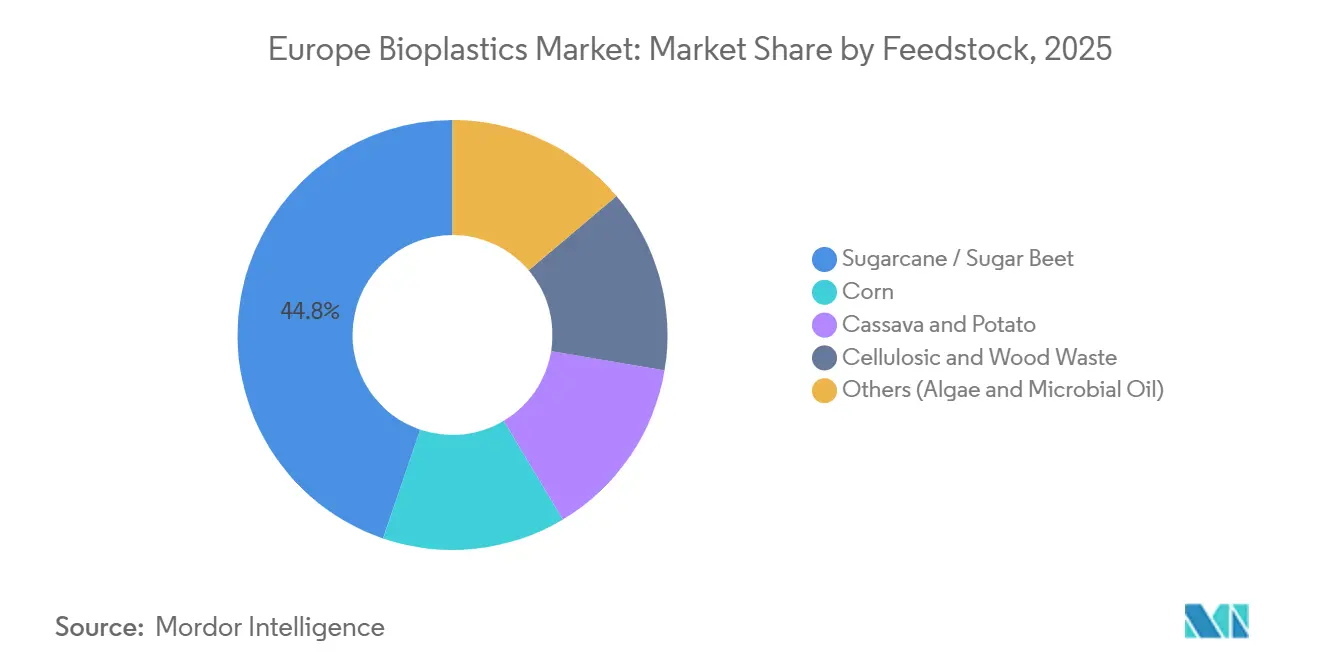
- By feedstock, sugarcane/sugar beet commanded 44.77% share of Europe bioplastics market size in 2025, while cellulosic and wood waste are forecast to expand at a 22.42% CAGR through 2031.
- By processing technology, extrusion led with 48.61% share in 2025, whereas 3D printing is poised for a 21.66% CAGR to 2031.
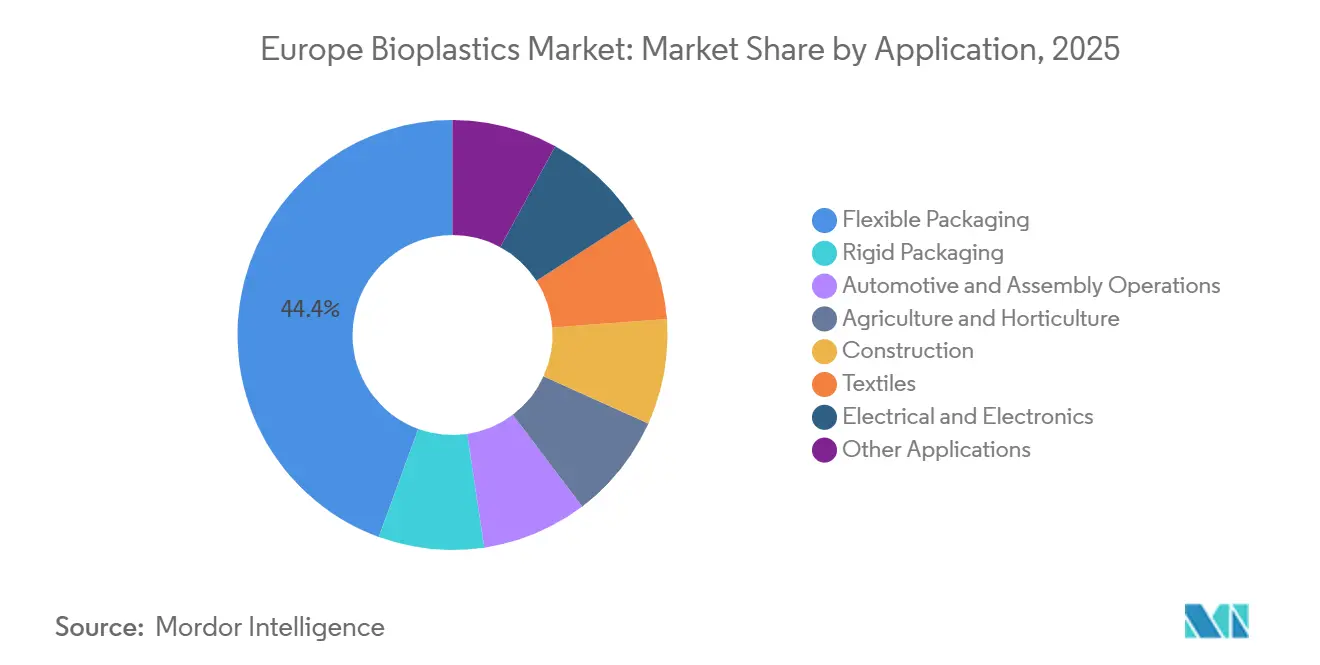
- By application, flexible packaging accounted for 44.42% of Europe bioplastics market size in 2025 and is projected to grow at a 22.95% CAGR during 2026-2031.
- By geography, Germany held a 26.64% share in 2025; the United Kingdom is expected to record a 19.75% CAGR through 2031.
Note: Market size and forecast figures in this report are generated using Mordor Intelligence’s proprietary estimation framework, updated with the latest available data and insights as of January 2026.
Europe Bioplastics Market Trends and Insights
Driver Impact Analysis*
| Drivers | (~) % Impact on CAGR Forecast | Geographic Relevance | Impact Timeline |
|---|---|---|---|
| EU Single-Use Plastics Directive accelerates compostable uptake | +4.2% | EU-27, with strongest enforcement in Germany, France, Italy | Short term (≤ 2 years) |
| Brand-owner sustainability commitments in packaging and textiles | +3.8% | Global, concentrated in Western Europe (Germany, UK, Netherlands, France) | Medium term (2-4 years) |
| Corporate net-zero targets favour bio-content substitution | +3.5% | EU-27, early adoption in Nordics and Benelux | Medium term (2-4 years) |
| Lignocellulosic sugar integration by EU pulp mills enables on-site PLA/PHA | +2.9% | Nordic countries, Germany, Austria, with spill-over to Central Europe | Long term (≥ 4 years) |
| CBAM cost on fossil polymer imports boosts EU bioplastics economics | +2.4% | EU-27 border-adjusted imports, strongest impact in Germany, Netherlands, Belgium ports | Medium term (2-4 years) |
| Source: Mordor Intelligence | |||
EU Single-Use Plastics Directive Accelerates Compostable Uptake
The directive that took effect in July 2024 prohibits polystyrene food containers, cups, and cutlery, forcing immediate substitution with EN 13432-compliant items. France extended this rule through the AGEC law and will require compostable or reusable food-service packaging in 2025, so quick-service outlets now specify PBAT–starch blends that degrade within 90 days in industrial facilities[1]French Ministry of Ecological Transition, “AGEC Law Implementation Report,” ecologie.gouv.fr. Italy’s 360 certified composters create a seamless loop for co-collecting food scraps and bioplastic packaging, a model that German municipalities replicate through public–private deals. Starch resins and PBAT copolymers dominate the switch because their melt-flow index matches polystyrene, allowing converters to keep legacy thermoforming lines. Eastern Europe lags, with only 28% municipal coverage, so brands use dual-spec compostable packaging for the West and recyclable bio-PE for the East.
Brand-Owner Sustainability Commitments in Packaging and Textiles
Consumer-goods leaders embed bio-content clauses in procurement, and cost premiums are now written into contracts. Danone disclosed that it paid EUR 12 million above spot PET to secure 45,000 tons of bio-PET in 2025. In apparel, H&M and Inditex pilot PLA fibers that cut cradle-to-gate carbon by 30% versus nylon 6,6, while Procter & Gamble released bio-PE bottles for Fairy dish soap in early 2025. These long agreements stabilize demand and justify capacity expansions that lenders once viewed as risky. As a result, the Europe bioplastics market receives durable price support.
Corporate Net-Zero Targets Favor Bio-Content Substitution
ISCC PLUS certification lets BASF distribute renewable feedstock credits across its cracker network, turning out bio-attributed polyamide without dedicated lines[2]BASF, “Biomass Balance Product Portfolio 2025,” basf.com. Automotive OEMs such as BMW claim bio-content for interior parts without altering tools, shortening validation cycles. TotalEnergies Corbion reached 75,000 tons of PLA in Thailand in 2024 and is weighing a European plant, provided that electricity costs drop below EUR 0.10 per kilowatt-hour. Agricultural films also benefit from net-zero rules because compostable mulch eliminates the diesel spent on retrieval.
Lignocellulosic Sugar Integration by Pulp Mills
Metsä Group will spend EUR 150 million for enzymatic hydrolysis at the Äänekoski biorefinery, targeting 30,000 tons of lactic acid by 2028. The project taps sawmill waste, removing food-crop pressure that tightened under RED III biofuel mandates. Lenzing pilots PHA fermentation using acetic acid from wood waste, shaving 40% from capital relative to greenfield plants. The European Forest Institute counts 18 million tons of residue that is still under-utilized, and Germany now subsidizes up to 25% of capex for lignocellulosic facilities.
Restraint Impact Analysis*
| Restraints | (~) % Impact on CAGR Forecast | Geographic Relevance | Impact Timeline |
|---|---|---|---|
| Limited industrial-composting capacity | -2.1% | Eastern Europe, Southern Europe (Spain, Portugal, Greece), gaps in rural Germany and France | Short term (≤ 2 years) |
| High EU energy prices inflate extrusion and conversion costs | -1.8% | Germany, Italy, Belgium, Netherlands - high natural-gas dependency | Medium term (2-4 years) |
| Feedstock competition from RED-III advanced-biofuel mandates | -1.3% | EU-27, concentrated in countries with large biofuel sectors (France, Germany, Spain) | Long term (≥ 4 years) |
| Source: Mordor Intelligence | |||
Limited Industrial-Composting Capacity
Only 42% of municipalities across the bloc run certified facilities, and those plants already operate at 78% utilization, leaving little spare capacity for the expected 340,000-ton surge in compostable waste by 2028. Madrid’s single composter cannot handle city volumes, so overflow swings to landfill, where anaerobic settings stall degradation. Germany enforces a 58 °C, 10-day rule for certification, a hurdle that small rural sites miss, sparking disputes over residual films. Though France earmarked EUR 300 million for new sites, permits, and buildings will not finish until 2028.
High EU Energy Prices Inflate Extrusion and Conversion Costs
German electricity averaged EUR 0.14 per kilowatt-hour in 2025, up from EUR 0.06 in 2020, lifting extrusion costs by about 23%. PLA needs barrel temperatures above 190 °C, plus desiccant dryers that eat 15% more power than polypropylene lines, so profit margins narrow for converters locked into spot electricity. Italian SMEs, which manage 68% of national capacity, delayed bioplastics trials because of price swings. Spot power hit EUR 0.22 in Belgium and the Netherlands during January 2025 cold snaps, forcing downtime. Only large producers with credit can secure sub-EUR 0.10 power purchase deals.
*Our forecasts treat driver/restraint impacts as directional, not additive. The impact forecasts reflect baseline growth, mix effects, and variable interactions.
Segment Analysis
By Type: Biodegradables Hold the Lead While Drop-In Grades Expand
Bio-based biodegradables held 59.81% of the Europe bioplastics market in 2025 and will post a 22.59% CAGR to 2031. Starch blends serve loose-fill and shopping bags at a cost of 15% below PLA. PLA commands the premium slice in rigid clamshells and 3D printing, where clarity matters. PHA stays below 3% share for now, yet new waste-oil capacity in Greece signals that economics can equal PBAT by 2029. PBAT, PBS, and PCL remain critical for flexibility, blended with starch to meet EN 13432.
Bio-based non-biodegradables also held a considerable market share in 2025. Bio-PET appeals to beverage brands such as Coca-Cola, which reported 22% of bottles with 30% bio-content in 2025. Bio-PE lets home-care brands shift without line changes, a gain in automotive fuel tanks and detergent bottles with long validation cycles. Arkema’s PA11 from castor oil keeps a foothold in high-abrasion parts despite a 40% price premium.
By Feedstock: Cellulosic Waste Ramps Up
Sugarcane/sugar beet supplied 44.77% of inputs in 2025, but cellulosic and wood waste will outpace at 22.42% CAGR. Corn prices averaged EUR 245 per ton in 2025 and continue upward due to bioethanol demand. Cassava and potato acreage expansion remains limited. By contrast, enzymatic hydrolysis of sawmill residue delivers sugars at EUR 180-210 per ton, 15% under corn glucose. Gas fermentation using CO₂ and hydrogen has pilot backing from Evonik and a EUR 25 million Innovation Fund grant, targeting 5,000 tons in 2027.


By Processing Technology: Additive Manufacturing Scales Fast
Extrusion kept a 48.61% share in 2025 yet grows at just a 16.8% CAGR. Injection molding also held a considerable market share and remains a staple for yogurt cups and cosmetic jars. Blow molding faces barrier concerns with bio-PET, which needs multilayer or coating fixes. Thermoforming retains niche territory in clamshells. Additive manufacturing is the headline gainer, rising at 21.66% CAGR as BMW printed 300,000 PLA parts in 2025, cutting lead time from 12 weeks to 3 days. BASF’s carbon-fiber PLA reaches 65 MPa tensile strength, moving prototypes into semi-structural roles.
By Application: Flexible Packaging Dominates Growth
Flexible packaging carved out 44.42% of the 2025 volume and will rise at a 22.95% CAGR through 2031. Brand owners substitute polyethylene pouches with PBAT–starch films that match existing line speeds. Automotive is witnessing rising bio-plastic demand as OEMs switch to bio-PA for under-hood parts. Agriculture and horticulture benefit from EN 17033 mulch films that save diesel retrieval. Construction, textiles, and electronics collectively show long-run promise once thermal, tensile, and flame requirements are met.

Geography Analysis
Germany owned 26.64% of regional throughput in 2025, buttressed by 128 certified composting plants and chemical clusters in North Rhine-Westphalia. The country co-funds 25% of lignocellulosic biorefinery capex, which pushes Europe bioplastics market supply closer to demand. The United Kingdom will log the fastest 19.75% CAGR to 2031 because Extended Producer Responsibility fees add GBP 200-500 per ton on virgin plastic packaging and tip the economic balance toward certified renewable resins.
Italy houses the continent’s most mature compost network with 360 plants that processed 7.2 million tons of organics in 2025. France’s market benefits from AGEC mandates and a EUR 300 million budget for new compost sites aiming at 80% municipal coverage by 2028. The Netherlands positions itself as an export hub, anchored by the Port of Rotterdam logistics and candidate sites for NatureWorks and Avantium.
Spain accelerates infrastructure with a EUR 180 million composter scheduled for 2027 start-up. Nordic countries are witnessing a rising demand for bioplastics driven by the coupling of pulp mills with PLA fermenters. The remaining Central and Eastern European states, including Poland and Czechia, hold a smaller share; slower uptake reflects smaller per-capita packaging consumption and sparse composting coverage.
Competitive Landscape
The European bioplastics market is moderately consolidated. The top five suppliers leave headroom for regional specialists that customize compounds for niche use cases. BASF scales biomass-balanced grades through ISCC PLUS, and Novamont leverages Italy’s composting density to expand PBAT blends. Small players such as FKuR and Rodenburg focus on customer-specific blends that large incumbents cannot serve economically. Patent filings around PHA jumped 34% year-on-year in 2025, led by RWDC and Danimer, both chasing marine-degradable premium segments. Additive manufacturing widens entry paths for new converters since the capital requirement is modest. Certifications from DIN CERTCO and TÜV Austria, however, create a compliance moat that favors established firms.
Europe Bioplastics Industry Leaders
NatureWorks LLC
Eni S.p.A. (Novamont)
BASF
TotalEnergies (Total Corbion)
Mitsubishi Chemical Group Corporation
- *Disclaimer: Major Players sorted in no particular order

Recent Industry Developments
- September 2025: Metsä Group committed EUR 150 million to add enzymatic hydrolysis at its Äänekoski biorefinery, targeting 30,000 tons of lactic acid by 2028.
- February 2025: NatureWorks began due diligence for a 150,000-ton PLA plant in the Netherlands, dependent on EUR 200 million in EU Innovation Fund support.
- December 2024: RWDC Industries started a 10,000-ton PHA facility in Greece using waste cooking oil feedstock and aims to scale to 25,000 tons by 2027.


Research Methodology Framework and Report Scope
Market Definitions and Key Coverage
According to Mordor Intelligence, the European bioplastics market covers all polymer materials whose carbon backbone is wholly or partly sourced from renewable biomass and that are processed into finished resins, compounds, or preforms within Europe before sale to converters. The study measures trade-corrected production volume in kilotons, capturing drop-in bio-based grades (bio-PET, bio-PE, bio-PA, etc.) and biodegradable families such as PLA, PHA, PBS, and starch blends.
Scope exclusion: post-consumer mechanical or chemical recycling streams and fossil-based biodegradable additives lie outside the boundary.
Segmentation Overview
- By Type
- Bio-based Biodegradables
- Starch-based
- Polylactic Acid (PLA)
- Polyhydroxyalkanoates (PHA)
- Polyesters (PBS, PBAT, PCL)
- Other Bio-based Biodegradables
- Bio-based Non-biodegradables
- Bio Polyethylene Terephthalate (PET)
- Bio Polyethylene
- Bio Polyamides
- Bio Polytrimethylene Terephthalate
- Other Bio-based Non-biodegradables
- Bio-based Biodegradables
- By Feedstock
- Sugarcane / Sugar Beet
- Corn
- Cassava and Potato
- Cellulosic and Wood Waste
- Others (Algae and Microbial Oil)
- By Processing Technology
- Extrusion
- Injection Molding
- Blow Molding
- 3D Printing
- Others (Thermoforming, etc.)
- By Application
- Flexible Packaging
- Rigid Packaging
- Automotive and Assembly Operations
- Agriculture and Horticulture
- Construction
- Textiles
- Electrical and Electronics
- Other Applications
- By Country
- Germany
- United Kingdom
- Italy
- France
- Netherlands
- Spain
- Nordic
- Rest of Europe
Detailed Research Methodology and Data Validation
Primary Research
Mordor analysts interviewed resin producers, compounders, packaging converters, retail sustainability leads, and regional policymakers across Germany, France, Italy, the UK, and the Nordics. These conversations clarified average selling prices, utilization rates, legislative timelines, and realistic adoption ceilings, allowing us to close gaps evident in secondary statistics and stress-test all model drivers.
Desk Research
Our analysts began with public datasets such as Eurostat PRODCOM, UN Comtrade shipment codes, and Eurozone chemical production indices, then cross-checked tonnage trends against trade association briefs from European Bioplastics, Plastics Europe, and the European Bioeconomy Alliance. Company 10-Ks, investor decks, and patent filings delivered resin capacity additions, while paid repositories like D&B Hoovers and Dow Jones Factiva helped validate corporate disclosures. This mosaic of sources framed baseline supply, feedstock cost curves, and regulatory inflection points.
Further desk work tapped standards bodies (EN 16785 and EN 13432) plus tender logs from Tenders Info to flag upcoming municipal compostable-bag mandates, enriching our demand cues. The list above is illustrative; many other public, commercial, and subscription materials supported fact-checking and assumption calibration.
Market-Sizing & Forecasting
We apply a top-down "production-plus-trade" build that reconstructs apparent consumption for each polymer family, followed by sampled ASP × volume roll-ups to sense-check value. Where production or import figures are missing, bottom-up supplier capacity roll-ups and channel checks bridge the void. Key variables include resin capacity announcements, mandated compostable-bag penetration, corn-starch price spreads, EU Single-Use Plastics Directive phase-in dates, bioplastic-fossil price parity, and average utilization rates. A multivariate regression anchored on GDP, food packaging output, and mandated collection tonnage informs the 2025-2030 forecast, with scenario analysis around feedstock shocks.
Data Validation & Update Cycle
Triangulation dashboards flag variances above two standard deviations; anomalies trigger re-contact with sources before sign-off. Every report receives a peer review, and we refresh the dataset annually, issuing interim updates when legislation or major capacity additions materially shift the outlook.
Why Mordor's Europe Bioplastics Baseline Commands Reliability
Published numbers diverge because firms mix revenue and volume, include or exclude drop-in grades, and update models at different cadences.
By anchoring on verifiable production tonnage and harmonized EU scope, Mordor delivers a dependable starting point for planners.
Benchmark comparison
| Market Size | Anonymized source | Primary gap driver |
|---|---|---|
| 0.67 million tons (2025) | Mordor Intelligence | - |
| 0.35 million tons (2024) | Regional Consultancy A | Omits non-compostable drop-in resins and models only five EU economies |
| USD 6.34 billion (2024) | Industry Association B | Reports sales value, blends EFTA with EU, and uses spot exchange rates without inflation normalization |
In short, while other publishers adopt narrower scopes or mixed metrics, Mordor's disciplined volume focus, transparent variables, and yearly refresh give decision-makers a balanced, repeatable baseline.


Key Questions Answered in the Report
How large is the Europe bioplastics market in 2026?
The Europe bioplastics market size is estimated at 0.79 million tons in 2026 and is on track to reach 1.81 million tons by 2031.
Which segment grows fastest within European bioplastics?
Flexible packaging is expected to post the fastest 22.95% CAGR because PBAT–starch blends can run on existing film lines.
Why is Germany the leading European bioplastics producer?
Germany hosts 128 certified composting plants, extensive chemical clusters, and subsidies covering 25% of lignocellulosic biorefinery capex.
What role does CBAM play in bioplastics adoption?
The Carbon Border Adjustment Mechanism adds EUR 80 per ton to imported fossil polyethylene, making certified bio-PE cost-competitive.
How are pulp mills contributing to future supply?
Nordic pulp mills retrofit enzymatic hydrolysis lines to create wood-based sugars, feeding integrated PLA and PHA production at lower cost.
Page last updated on:


