Protein-Based Sports Drinks Market Size and Share
Market Overview
| Study Period | 2021 - 2031 |
|---|---|
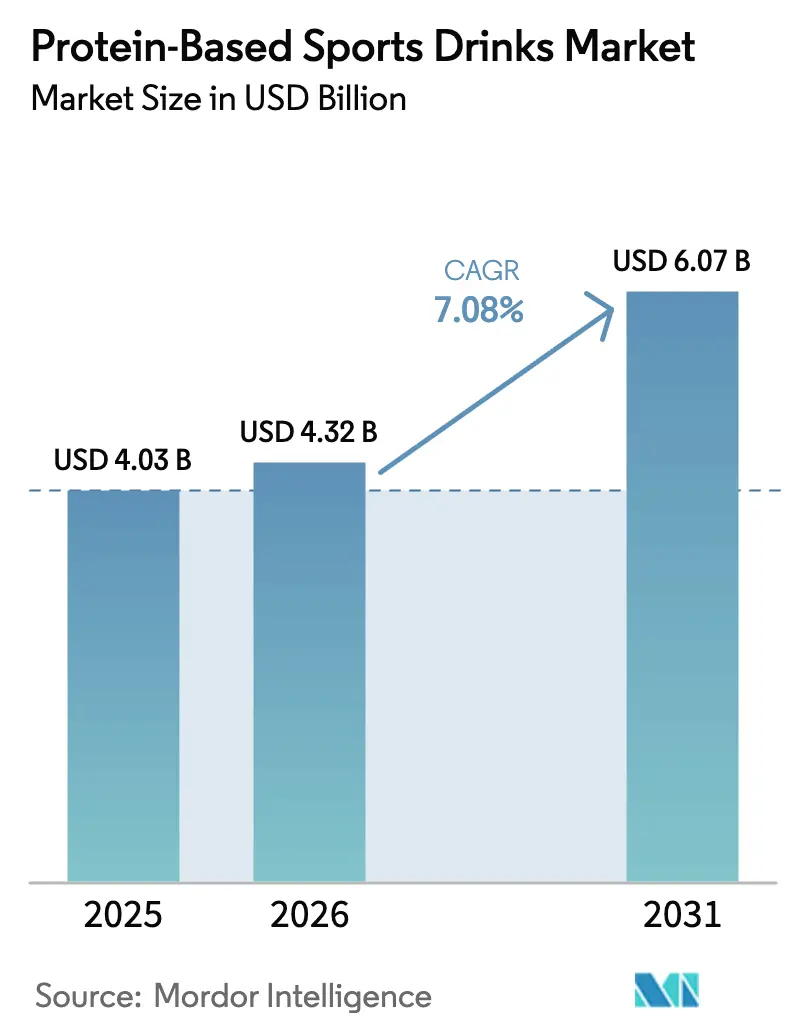
| Market Size (2026) | USD 4.32 Billion |
| Market Size (2031) | USD 6.07 Billion |
| Growth Rate (2026 - 2031) | 7.08% CAGR |
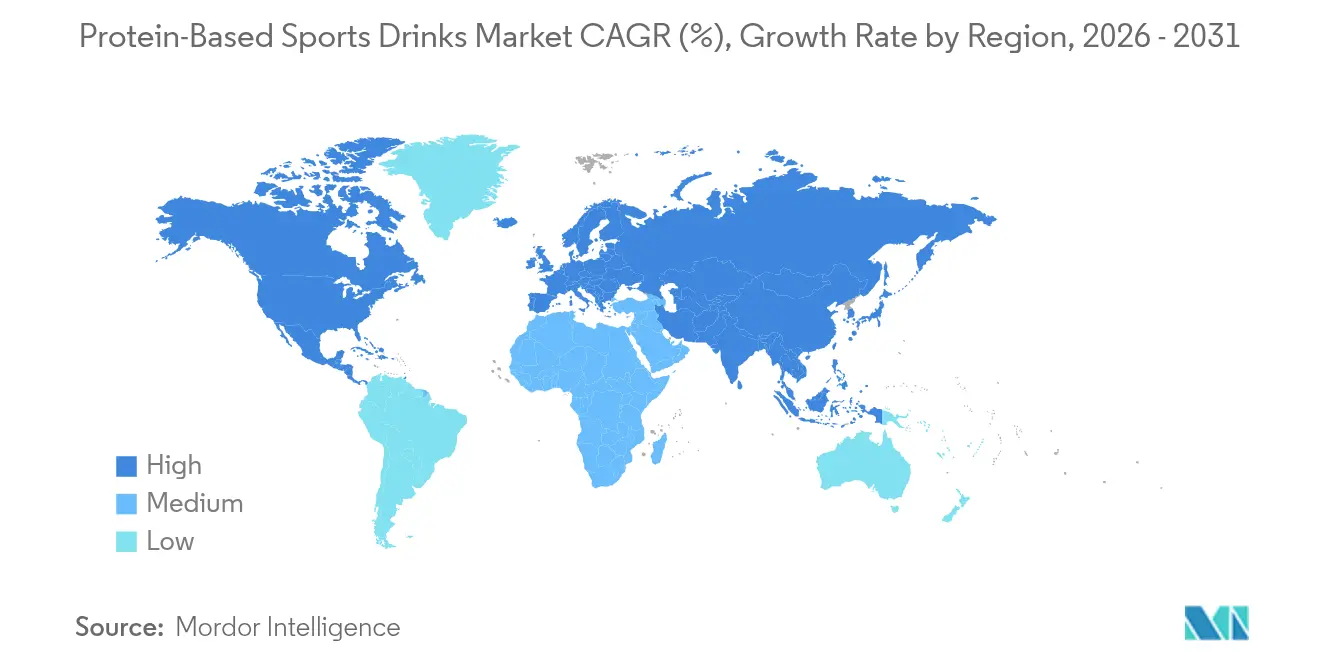
| Fastest Growing Market | Asia Pacific |
| Largest Market | North America |
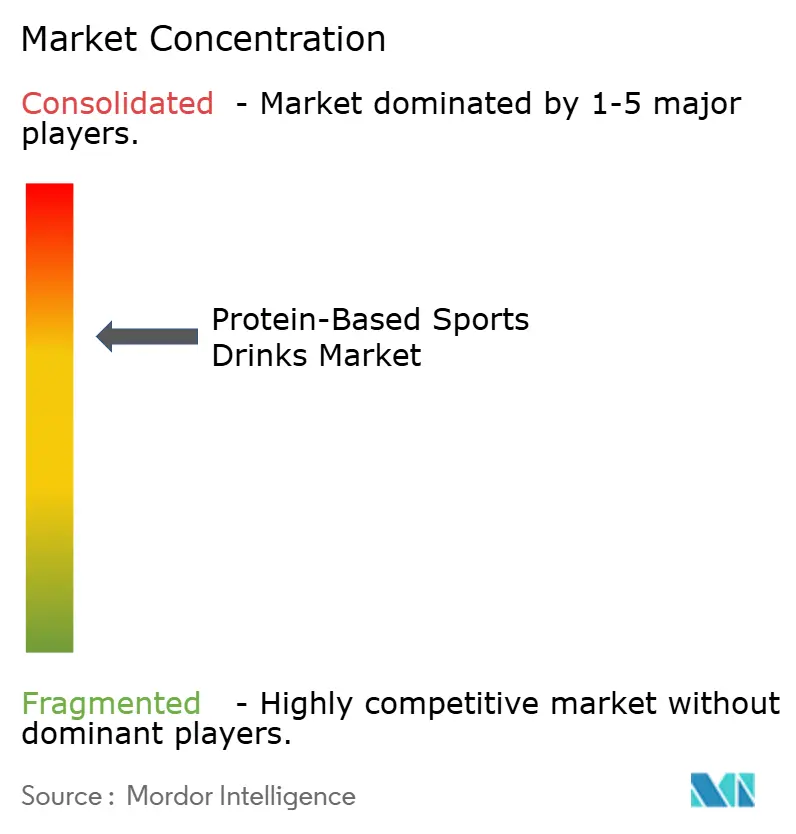
| Market Concentration | Medium |
Major Players
*Disclaimer: Major Players sorted in no particular order Image © Mordor Intelligence. Reuse requires attribution under CC BY 4.0. |
|
Protein-Based Sports Drinks Market Analysis by Mordor Intelligence
The global protein-based sports drinks market size was valued at USD 4.03 billion in 2025 and estimated to grow from USD 4.32 billion in 2026 to reach USD 6.07 billion by 2031, at a CAGR of 7.08% during the forecast period (2026-2031). Consumers are shifting from traditional scoop-and-mix powders to convenient grab-and-go servings that fit easily into commuter bags, gym lockers, and office desks. Although the on-the-go format comes with a higher cost per gram of protein, consumers, particularly dual-income households with limited spare time, are willing to pay the premium for convenience. Furthermore, advancements in plant-based technology, the adoption of lower-carbon packaging solutions, and the rise of direct-to-consumer delivery models are driving innovation and creating new opportunities for brands to address unmet consumer needs effectively.
Key Report Takeaways
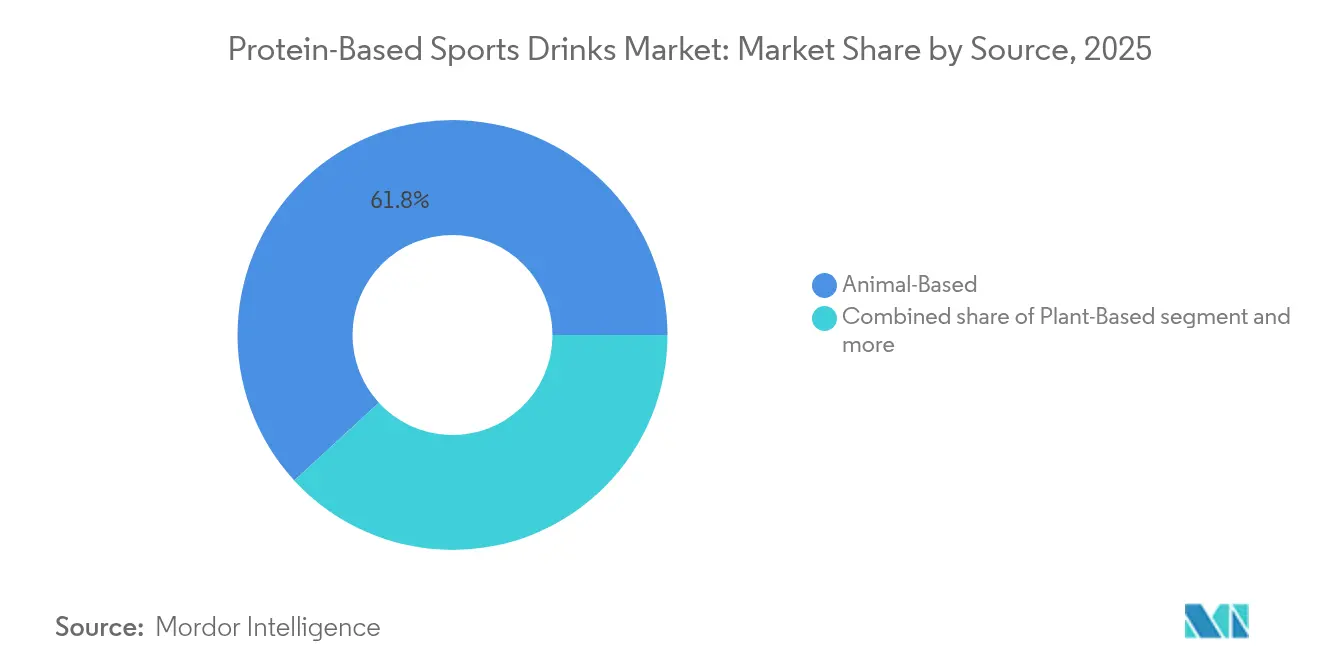
- By source, the animal-based segment led with 61.83% of the global protein-based sports drinks market share in 2025, while plant-based lines are forecast to expand at a 7.86% CAGR through 2031.
- By packaging, PET bottles held 53.55% revenue share in 2025; aseptic cartons and tetra packs are expected to grow at a 7.36% CAGR to 2031.
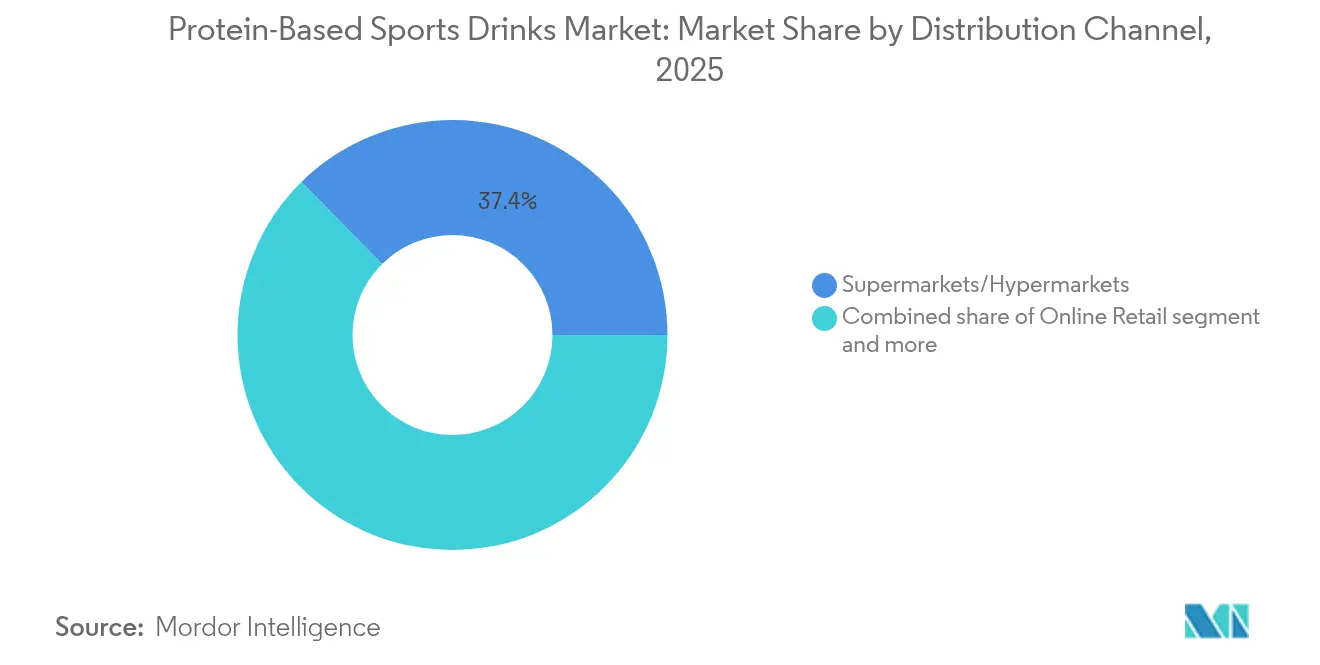
- By distribution channel, supermarkets/hypermarkets commanded 37.41% of 2025 sales, yet online retail is projected to post the fastest 8.29% CAGR between 2026-2031.
- By geography, North America captured 37.93% of the 2025 global value, whereas the Asia-Pacific is predicted to record the highest 7.19% CAGR.
Note: Market size and forecast figures in this report are generated using Mordor Intelligence’s proprietary estimation framework, updated with the latest available data and insights as of 2026.
Global Protein-Based Sports Drinks Market Trends and Insights
Drivers Impact Analysis*
| Driver | (~) % Impact on CAGR Forecast | Geographic Relevance | Impact Timeline |
|---|---|---|---|
| Rising focus on muscle recovery and functional performance | +1.2% | Global, with concentration in North America, Europe, and urban Asia-Pacific | Medium term (2-4 years) |
| Expansion of fitness and active lifestyles globally | +1.5% | Global, led by Asia-Pacific urbanization and North America gym penetration | Long term (≥ 4 years) |
| Shift toward convenient, ready-to-drink protein formats | +1.3% | Global, strongest in North America and Western Europe | Short term (≤ 2 years) |
| Increased awareness of protein's role in weight management | +0.9% | North America, Europe, and affluent Asia-Pacific metros | Medium term (2-4 years) |
| Expansion of plant-based protein tech and taste masking | +1.1% | Global, with early adoption in North America and Northern Europe | Medium term (2-4 years) |
| Rising demand for low-sugar and low-calorie sports nutrition | +0.8% | North America, Europe, and health-conscious Asia-Pacific segments | Short term (≤ 2 years) |
| Source: Mordor Intelligence | |||
Rising focus on muscle recovery and functional performance
Increasing consumer awareness of muscle recovery and functional performance is driving the growth of the global protein-based sports drinks market. Athletes and active consumers are seeking products that not only supply protein for muscle synthesis but also aid recovery, reduce fatigue, and support performance adaptation during both short-term and long-term training periods. Ready-to-drink (RTD) protein-based sports drink formats have become a significant innovation in this market, removing the need for mixing powders and offering immediate consumption, which is particularly beneficial in training and competitive settings. Formulations are becoming more functional, incorporating ingredients such as creatine monohydrate and beta-alanine to support both short-term recovery and long-term performance improvements. This has led to the development of a functional beverage category that directly competes with traditional sports drinks, combining hydration with protein delivery. Scientific evidence supports the efficacy of these formulations, particularly in endurance sports, where carbohydrate-protein co-ingestion at a 3:1 ratio has been shown to reduce muscle damage markers by 30% compared to carbohydrate-only solutions. Consequently, protein-based sports drinks are transitioning from simple supplementation products to multi-functional performance enhancers, driving their adoption among a wider range of fitness and athletic consumers.
Expansion of fitness and active lifestyles globally
The global rise in fitness and active lifestyles is a significant driver for the protein-based sports drinks market. An increasing number of consumers are participating in structured exercise, recreational sports, and wellness-focused routines. Factors such as growing health consciousness, the expansion of gyms and fitness clubs, and the popularity of endurance and functional training are collectively boosting the demand for convenient, performance-oriented nutrition solutions. Protein-based sports drinks are particularly benefiting from this trend, offering immediate post-workout consumption, eliminating preparation time, and providing both hydration and protein in a single, convenient format. Participation data highlights this growth: according to Sport England, approximately 213,400 individuals engaged in track and field athletics in England between November 2023 and November 2024 [1]Source: Sports England, "Adults aged 16+ who have taken part in sport and physical activity at least twice in the last 28 days," sportengland-prduction-files. This reflects sustained involvement in organized physical activities that require effective recovery and hydration strategies. As fitness cultures continue to expand globally, protein-based sports drinks are increasingly viewed as essential for exercise routines, appealing to both competitive athletes and casual exercisers seeking support for performance, muscle recovery, and overall wellness.
Shift toward convenient, ready-to-drink protein formats
The increasing consumer demand for convenience and on-the-go nutrition is driving the widespread adoption of ready-to-drink (RTD) protein products in the global sports drinks market. Unlike powdered protein supplements, which require shaker bottles, water, and preparation time, RTD beverages offer immediate consumption. This makes them particularly attractive to busy athletes, fitness enthusiasts, and active consumers. The convenience of RTD products not only simplifies post-workout nutrition but also promotes consistent protein intake, aiding muscle recovery, performance, and overall fitness objectives. RTD formats are also fostering innovation in formulation, with brands incorporating functional ingredients such as collagen peptides, creatine, beta-alanine, and natural sweeteners directly into the beverages. By combining hydration, protein, and performance-enhancing benefits in a single, convenient product, RTDs are positioned as both functional and lifestyle-oriented offerings.
Increased awareness of protein’s role in weight management
Increasing consumer awareness of protein's role in weight management and overall health is driving the global demand for protein-based sports drinks. Consumers are recognizing that adequate protein intake supports satiety, lean muscle maintenance, and metabolic efficiency, making protein-fortified beverages a preferred choice for those focused on fitness, weight management, and healthier lifestyles. This trend is evident in digital activity; according to Glanbia Nutritionals' 2025 report, a Google search for “diet” yields over 2.2 billion results, while “weight loss” generates an additional 2 billion, underscoring the strong consumer interest in nutrition-focused weight management [2]Source: Glanbia Nutritionals, "The Weight Loss Dilemma: Why the Real Goal is Metabolic Health," glanbianutritionals.com. The rising popularity of protein-based sports drinks is also encouraging manufacturers to innovate with new formulations that cater to diverse consumer preferences and dietary needs. Additionally, the growing availability of these products across various retail channels is further boosting their adoption. Consequently, the emphasis on weight control and healthier living is fostering product adoption, driving innovation in formulations, and contributing to category growth, establishing protein-based sports drinks as key tools for achieving fitness and dietary objectives.
Restraints Impact Analysis*
| Restraint | (~) % Impact on CAGR Forecast | Geographic Relevance | Impact Timeline |
|---|---|---|---|
| Price-sensitive emerging-market consumers | -0.7% | Asia-Pacific (excluding Japan, Australia), Latin America, Sub-Saharan Africa | Medium term (2-4 years) |
| Lactose intolerance constraints | -0.4% | East Asia, Southeast Asia, Sub-Saharan Africa, and lactase-deficient populations globally | Long term (≥ 4 years) |
| Shorter shelf life and stability issues | -0.5% | Global, particularly in regions with limited cold-chain infrastructure | Short term (≤ 2 years) |
| Competition from alternative protein formats | -0.6% | Global, strongest in cost-conscious and DIY-oriented consumer segments | Medium term (2-4 years) |
| Source: Mordor Intelligence | |||
Price-sensitive emerging-market consumers
Price sensitivity among consumers in emerging markets poses a significant challenge to the growth of the global protein-based sports drinks market. Although demand for sports nutrition products is increasing due to rising health awareness, greater fitness participation, and urbanization in regions such as South Asia, Southeast Asia, Latin America, and Africa, the high price of many protein-based sports drinks restricts their adoption, particularly among middle- and lower-income consumer groups. Protein-based sports drinks are often priced at a premium due to factors such as the high cost of raw materials (e.g., whey protein isolates, hydrolyzed proteins), research and development efforts for improving flavor and solubility, and branding associated with performance and sports nutrition. In emerging markets, where per capita disposable incomes are significantly lower compared to developed markets, these higher prices often make protein sports drinks unaffordable for average consumers. Consequently, price-sensitive buyers may delay purchases, opt for more affordable alternatives, or choose traditional beverages, thereby limiting market growth.
Lactose intolerance constraints
Lactose intolerance poses a significant challenge to the growth of the global protein-based sports drinks market. A considerable portion of the population struggles to digest lactose, the primary sugar in dairy-based protein formulations commonly used in sports nutrition products. For example, according to the Food Standards Agency (FSA) in 2024, approximately 12% of survey respondents in England, Wales, and Northern Ireland reported having a food intolerance, while around 5% reported experiencing a food allergy [3]Source: Food Standards Agency, "Food and You 2: Wave 8 Key Findings," food.gov.uk. As a type of food intolerance, lactose intolerance directly affects the consumption of dairy-based protein drinks, limiting their adoption among individuals with this condition. Additionally, the prevalence of lactose intolerance varies geographically, with higher rates observed in regions such as Asia-Pacific, Africa, and South America, influencing regional market trends. To address these challenges, manufacturers targeting these markets must focus on developing alternative protein formulations or enzyme-treated dairy proteins to reduce adverse effects and enhance consumer acceptance.
*Our forecasts treat driver/restraint impacts as directional, not additive. The impact forecasts reflect baseline growth, mix effects, and variable interactions.
Segment Analysis
By Source: Plant Proteins Close the Performance Gap
Animal-based protein-based sports drinks held a 61.83% market share in 2025, while plant-based protein-based sports drinks are expected to grow at an annual rate of 7.86% through 2031. This growth is driven by advancements in amino-acid fortification and fermentation-derived proteins that replicate the leucine density and digestion kinetics of whey. These innovations have made plant-based proteins more competitive in terms of functionality and nutritional value. While animal-based proteins continue to dominate performance-focused segments, where elite athletes prioritize incremental performance gains, the broader market increasingly perceives plant and animal proteins as interchangeable for general health purposes. This shift highlights the growing consumer preference for sustainable and health-conscious dietary options.
Whey protein concentrate and isolate formulations benefit from years of taste refinement and strong consumer familiarity, securing significant shelf space in mainstream grocery channels. In contrast, plant-based products are often confined to specialty sections. Casein-based sports beverages cater to overnight recovery needs, utilizing slow-digestion properties that provide sustained amino-acid release for 6-8 hours. However, this segment remains niche due to the thicker texture of these beverages, which can limit their appeal and drinkability. Despite this, casein-based products continue to attract a dedicated consumer base seeking prolonged recovery benefits.


By Packaging Type: Aseptic Formats Gain Sustainability Edge
PET bottles held a 53.55% market share in 2025, driven by consumer perceptions of premium quality and their resealability, which supports multi-occasion use. However, increasing regulatory pressure on single-use plastics, such as extended producer responsibility schemes in Europe and plastic-tax proposals in various regions, poses a challenge to PET's cost advantage as brands absorb end-of-life disposal costs. Metal cans, known for their infinite recyclability, appeal to outdoor enthusiasts due to their durability and portability. Despite these advantages, concerns about metallic taste transfer from aluminum contact limit their adoption in premium segments, where taste integrity is critical.
Aseptic cartons and Tetra Paks are expected to grow at a rate of 7.36% through 2031, supported by their 40% lower carbon footprint compared to PET bottles and the elimination of refrigeration requirements, which reduces energy consumption throughout the supply chain. These formats are increasingly favored in markets prioritizing sustainability, as they align with global efforts to reduce greenhouse gas emissions. Their lightweight design also contributes to lower transportation costs, further enhancing their appeal to manufacturers and distributors. Additionally, aseptic cartons and Tetra Paks offer extended shelf life for perishable products, making them suitable for regions with limited cold chain infrastructure.
By Distribution Channel: E-Commerce Unlocks Subscription Models
Supermarkets/hypermarkets accounted for a 37.41% market share in 2025, benefiting from high foot traffic and impulse-purchase behavior. However, these channels impose 25-35% margins and slotting fees, creating challenges for emerging brands. Online retail is projected to grow at an annual rate of 8.29% through 2031, driven by direct-to-consumer brands that avoid traditional retail markups and allocate savings toward customer acquisition and retention initiatives. Convenience stores cater to on-the-go consumers but offer a limited SKU assortment, favoring established brands with national distribution agreements.
Specialty stores, such as GNC and Vitamin Shoppe, provide knowledgeable staff and product education, which appeal to novice supplement users. However, declining mall traffic and competition from online platforms like Amazon are diminishing their relevance among digitally savvy consumers. Other distribution channels, including foodservice, vending, and travel retail, collectively hold a notable share and offer significant brand exposure in high-traffic environments. The growing emphasis on omnichannel strategies, where consumers research products online but purchase in-store, or vice versa, requires unified inventory management and consistent pricing. Many mid-sized brands face challenges in effectively implementing these strategies.
Geography Analysis
In 2025, North America accounted for 37.93% of global revenue, driven by an average protein intake of 102 grams per person daily, robust household income levels, and 68% adult supplement penetration. Canada demonstrates similar consumption trends but shows a stronger preference for plant-based formulations, influenced by environmental awareness and government dietary guidelines promoting plant protein sources. Mexico presents an emerging opportunity as urbanization rates near 80%, and middle-class growth encourages the adoption of Western dietary habits. However, affordability challenges limit the penetration of premium protein-based sports drink products. Regulatory alignment under FDA oversight ensures consistent labeling and safety standards across the region, simplifying compliance for brands operating in multiple markets.
The Asia-Pacific market is projected to grow at a compound annual growth rate (CAGR) of 7.19% through 2031, driven by urbanization rates exceeding 60% in China and gym membership growth surpassing 25% year-on-year in India. Australia and New Zealand exhibit consumption patterns similar to North America, with high sports-nutrition penetration and a preference for clean-label formulations. In Southeast Asia, including Indonesia, fragmented retail landscapes and price sensitivity in India favor smaller pack sizes and local manufacturing to reduce import duties. Regulatory oversight by the Food Safety and Standards Authority of India (FSSAI) enforces labeling requirements distinct from Western markets.
Europe strikes a balance between the market maturity of North America and the growth potential of Asia-Pacific. Germany, the United Kingdom, and France lead consumption due to well-established fitness cultures and high levels of protein awareness. The European Food Safety Authority (EFSA) regulations under Regulation 1924/2006 impose strict health-claims substantiation requirements, which limit marketing flexibility but enhance consumer trust in approved products.
South America and the Middle East and Africa remain nascent markets, collectively accounting for less than 10% of the global market share. Growth in these regions is constrained by affordability challenges and limited cold-chain infrastructure. However, urban centers in Brazil, South Africa, and the UAE are witnessing early adoption of products among affluent consumers.

Competitive Landscape
The global protein-based sports drinks market is moderately concentrated. Key players such as PepsiCo, Coca-Cola, and Nestlé employ portfolio strategies that cover various price tiers and protein sources, targeting both cost-conscious and premium consumers. These companies also utilize private-label manufacturing to supply retailer brands, leveraging their production scale advantages. Strategic initiatives focus on vertical integration into protein sourcing, as seen in dairy processor acquisitions and long-term whey supply contracts. These measures help protect margins from commodity price fluctuations and ensure consistent product quality.
Opportunities remain in functional niches, including sleep-recovery formulations with magnesium and tryptophan, pre-workout blends featuring caffeine and beta-alanine, and beauty-nutrition products incorporating collagen and biotin. These segments allow specialized brands to command premium pricing, often attracting acquisition interest from larger companies. Smaller competitors rely on co-manufacturing partnerships with Tetra Pak-certified facilities to access aseptic production capabilities without significant capital investment. However, this reliance on third-party capacity can limit production flexibility during periods of high demand.
Innovation in the market is evident through patent filings for new protein extraction methods and taste-masking compounds. These advancements reflect the industry's commitment to addressing evolving consumer demands and improving product offerings. By focusing on these innovations, companies aim to enhance the sensory appeal and nutritional value of their products. Such efforts are crucial for maintaining a competitive position in the market.
Protein-Based Sports Drinks Industry Leaders
-
Nestle S.A.
-
PepsiCo, Inc.
-
The Coca-Cola Company
-
BellRing Brands Inc.
-
Abbott Laboratories
- *Disclaimer: Major Players sorted in no particular order

Recent Industry Developments
- October 2025: Glanbia’s U.S. sports nutrition brand, Isopure, officially entered the UK market, marking its first significant expansion outside North America. Known for its minimal-ingredient whey protein isolate products, which provide 25 g of protein per serving, and Type 1 collagen with vitamin C, the brand is now available through major UK retailers, including Holland & Barrett, Boots UK, Amazon, Sainsbury’s, and Ocado Retail.
- July 2025: BENEO, in collaboration with California Natural Color and GELITA, introduced a new performance drink concept targeting active and health-conscious consumers. The drink was showcased for sampling at IFT First 2025 in Chicago. Designed as a clean-label, milk-based beverage, it aims to support endurance, performance, and body composition, offering benefits beyond traditional sports nutrition products that typically focus on muscle growth or quick energy.
- June 2025: BioSteel, a Canadian sports nutrition brand recognized for its clean hydration products, expanded into the protein beverage category with its first-ever Ready-to-Drink (RTD) protein drink. This launch represents a significant milestone in the company’s recovery following its bankruptcy in 2023. The product, distributed nationally at Costco in Canada, comes in 330ml bottles, each containing 30g of protein. It is formulated with no added sugar, no preservatives, zero lactose, natural sweeteners, and gluten-free ingredients, catering to athletes and active consumers seeking a clean-label performance option.


Global Protein-Based Sports Drinks Market Report Scope
Metal Can, PET Bottles are covered as segments by Packaging Type. Convenience Stores, Online Retail, Specialty Stores, Supermarket/Hypermarket, Others are covered as segments by Sub Distribution Channel. Africa, Asia-Pacific, Europe, Middle East, North America, South America are covered as segments by Region.| Animal-Based |
| Plant-Based |
| PET Bottles |
| Metal Cans |
| Aseptic Cartons and Tetra Packs |
| Others |
| Supermarkets/Hypermarkets |
| Convenience Stores |
| Specialty Stores |
| Online Retail |
| Other Distribution Channels |
| North America | United States |
| Canada | |
| Mexico | |
| Rest of North America | |
| Europe | Germany |
| United Kingdom | |
| Italy | |
| France | |
| Spain | |
| Netherlands | |
| Poland | |
| Belgium | |
| Sweden | |
| Rest of Europe | |
| Asia-Pacific | China |
| India | |
| Japan | |
| Australia | |
| Indonesia | |
| South Korea | |
| Thailand | |
| Singapore | |
| Rest of Asia-Pacific | |
| South America | Brazil |
| Argentina | |
| Colombia | |
| Chile | |
| Peru | |
| Rest of South America | |
| Middle East and Africa | South Africa |
| Saudi Arabia | |
| United Arab Emirates | |
| Nigeria | |
| Egypt | |
| Morocco | |
| Turkey | |
| Rest of Middle East and Africa |
| By Source | Animal-Based | |
| Plant-Based | ||
| By Packaging Type | PET Bottles | |
| Metal Cans | ||
| Aseptic Cartons and Tetra Packs | ||
| Others | ||
| By Distribution Channel | Supermarkets/Hypermarkets | |
| Convenience Stores | ||
| Specialty Stores | ||
| Online Retail | ||
| Other Distribution Channels | ||
| By Geography | North America | United States |
| Canada | ||
| Mexico | ||
| Rest of North America | ||
| Europe | Germany | |
| United Kingdom | ||
| Italy | ||
| France | ||
| Spain | ||
| Netherlands | ||
| Poland | ||
| Belgium | ||
| Sweden | ||
| Rest of Europe | ||
| Asia-Pacific | China | |
| India | ||
| Japan | ||
| Australia | ||
| Indonesia | ||
| South Korea | ||
| Thailand | ||
| Singapore | ||
| Rest of Asia-Pacific | ||
| South America | Brazil | |
| Argentina | ||
| Colombia | ||
| Chile | ||
| Peru | ||
| Rest of South America | ||
| Middle East and Africa | South Africa | |
| Saudi Arabia | ||
| United Arab Emirates | ||
| Nigeria | ||
| Egypt | ||
| Morocco | ||
| Turkey | ||
| Rest of Middle East and Africa | ||


Market Definition
- Carbonated Soft Drinks (CSDs) - Carbonated soft drinks (CSDs) refer to non-alcoholic beverages that are carbonated and typically flavored, containing dissolved carbon dioxide to create effervescence. These beverages commonly include cola, lemon-lime, orange, and various fruit-flavored sodas. Marketed in cans, bottles, or fountain dispense.
- Juices - We have considered packaged juices which encompass non-alcoholic beverages derived from fruits, vegetables, or a combination thereof, processed and sealed in various packaging formats such as bottles, cartons, or pouches. Excluding fresh juices, this market segment involves commercially prepared and preserved juices, often with added preservatives and flavors.
- Ready-to-Drink (RTD) Tea and RTD Coffee - Ready-to-Drink (RTD) tea and RTD coffee are pre-packaged, non-alcoholic beverages that are brewed and prepared for consumption without further dilution. RTD tea typically includes various tea varieties, infused with flavors and sweeteners, and comes in bottles, cans, or cartons. Similarly, RTD coffee involves pre-brewed coffee formulations, often mixed with milk, sugar, or flavorings, and is conveniently packaged for on-the-go consumption.
- Energy Drinks - Energy drinks are non-alcoholic beverages formulated to provide a quick boost of energy and alertness. Whereas, sports drinks are beverages designed to hydrate and replenish electrolytes, particularly after physical exertion, exercise, or intense activity
| Keyword | Definition |
|---|---|
| Carbonated Soft Drinks | Carbonated soft drinks (CSDs) are a combination of carbonated water and flavouring, sweetened by sugar or a non-sugar sweeteners. |
| Standard Cola | Standard Cola is defined as the original flavor of cola soda. |
| Diet Cola | A cola-based soft drink containing no or low amounts of sugar |
| Fruit Flavored Carbonates | A carbonated beverage prepared from fruit juice/fruit flavor with carbonated water and containing sugar, dextrose, invert sugar or liquid glucose either singly or in combination. It may contain peel oil and fruit essences. |
| Juice | Juice is a drink made from the extraction or pressing of the natural liquid contained in fruit and vegetables. |
| 100% Juice | Fruit/vegetable juice made from fruit in the form of its juice with no water added to make up the volume. It is not permitted to add sugars, sweeteners, preservatives, flavourings or colourings to fruit juice. |
| Juice Drinks (up to 24% Juice) | Fruit/vegetable juice drinks with up to 24% fruits/vegetable extract. |
| Nectars (25-99% Juice) | Juices that can have between 25 and 99% of fruit, with the minimum legal limits defined depending on the type of fruit |
| Juice concentrates | Juice Concentrates are those form of juices when most of this liquid is removed resulting in a thick, syrupy product known as juice concentrate. |
| RTD Coffee | Packaged coffee beverages that are sold in a prepared form and are ready for consumption at the time of purchase. |
| Iced Coffee | An iced coffee is a cold version of coffee, usually a combination of hot espresso and milk with ice added to it. |
| Cold Brew Coffee | Cold brew also called cold water extraction or cold pressing is made by steeping ground coffee in room-temperature water for several hours. |
| RTD Tea | Ready-to-drink (RTD) tea is a packaged tea product ready for immediate consumption without brewing or preparation |
| Iced Tea | Ice tea or iced tea is a drink made from tea without milk but with sugar and sometimes fruit flavourings, drunk cold. |
| Green Tea | Green tea is a tea beverage which promotes mental alertness, relieving digestive symptoms and promoting weight loss. |
| Herbal Tea | Herbal tea beverages are made from the infusion or decoction of herbs, spices, or other plant material in hot water. |
| Energy Drink | A type of drink containing stimulant compounds, usually caffeine, which is marketed as providing mental and physical stimulation. They may or may not be carbonated and may also contain sugar, other sweeteners, or herbal extracts, among numerous possible ingredients. |
| Sugar-free or Low-calories Energy Drinks | Sugar-free or Low-calories Energy Drinks are sugar-free, artificially sweetened energy drinks with few or no calories. |
| Traditional Energy Drink | Traditional Energy Drinks are functional soft drinks containing ingredients designed to boost the consumer's energy. |
| Natural/Oraganic Energy Drinks | Natural/Organic energy drinks are energy drinks free of artificial sweeteners and synthetic colorings. Instead, they contain naturally derived ingredients such as green tea, yerba mate, and botanical extracts. |
| Energy Shots | A small but highly concentrated energy drink that contains large amounts of caffeine and/or other stimulants. The quantity is comparatively smaller compared to energy drinks. |
| Sports Drink | Sports drinks are beverages designed specifically for the rapid supply of fluid, carbohydrates, and electrolytes before, during or after exercise. |
| Isotonic | Isotonic drinks contain similar concentrations of salt and sugar as in the human body, and are designed to quickly replace fluids lost during exercise but with an increase of carbohydrate. |
| Hypertonic | Hypertonic drinks have a higher concentration of salt and sugar than the human body. They are best drunk after exercise as it is important to replace glycogen levels quickly after exercise. |
| Hypotonic | Hypotonic drinks are designed to quickly replace fluids lost during exercise. They have very low carbohydrate content and a lower concentration of salt and sugar than the human body. |
| Electrolyte-Enhanced Water | Electrolyte water is water infused with electrically-charged minerals, such as sodium, potassium, calcium, and magnesium. |
| Protein-based Sport Drinks | Protein-based sports drinks are those sports drinks which has added protein in it that will improve performance and reduce muscle protein breakdown. |
| On-Trade | The on-trade refers to places that sell beverages for immediate consumption on the premises like bars, restaurants, and pubs |
| Off-Trade | Off-trade usually means places like liquor stores, supermarkets and other places where you don't consume the beverage right away. |
| Convenience Store | A retail business that provides the public with a convenient location to quickly purchase a wide variety of consumable products and services, generally food and gasoline. |
| Specialty store | A specialty store is a shop/store that carries a deep assortment of brands, styles, or models within a relatively narrow category of goods |
| Online Retail | Online retail is a type of eCommerce whereby a business sells goods or services directly to consumers from a website. |
| Aseptic Packaging | Aseptic packaging refers to the filling of a cold, commercially sterile product under sterile conditions into a presterilized container and closure under sterile conditions to form a seal that effectively excludes microorganisms. These includes tetra packs, cartons, pouches etc. |
| PET Bottle | PET bottle means a bottle made of polyethylene terephthalate. |
| Metal Cans | Metal containers made of aluminum or tin- plated or zinc-plated steel, which are commonly used for packaging food, beverages or other products. |
| Disposable Cups | Disposable Cup means a cup or other container designed for single use to serve beverages, such as water, cold drinks, hot drinks and alcoholic beverages. |
| Gen Z | A way of referring to the group of people who were born in the late 1990s and early 2000s. |
| Millenial | Anyone born between 1981 and 1996 (ages 23 to 38 in 2019) is considered a Millennial |
| Taurine | Taurine is an amino acid that supports immune health and nervous system function. |
| Bars & Pubs | It is a drinking establishment licensed to serve alcoholic drinks for consumption on the premises. |
| Café | It is a foodservice establishment serving refreshments (mainly coffee) and light meals. |
| On the go | It means doing / dealing with while busily engaged with something and not diverting plans in order to accommodate. |
| Internet Penetration | The Internet Penetration Rate corresponds to the percentage of the total population of a given country or region that uses the Internet. |
| Vending Machine | A machine that dispenses small articles such as food, drinks, or cigarettes when a coin or token is inserted |
| Discount store | A discount store or discounter offers a retail format in which products are sold at prices that are in principle lower than an actual or supposed "full retail price". Discounters rely on bulk purchasing and efficient distribution to keep down costs. |
| Clean Label | Clean label on the beverage market are drinks that are made from few ingredients of natural origin and are not or only slightly processed. |
| Caffeine | An alkaloid compound which is a stimulant of the central nervous system. It is mainly used recreationally, as a mild cognitive enhancer to increase alertness and attentional performance. |
| Extreme sport | Action sports, adventure sports or extreme sports are activities perceived as involving a high degree of risk. |
| High-intensity interval training | It incorporates several rounds that alternate between several minutes of high intensity movements to significantly increase the heart rate to at least 80% of one's maximum heart rate, followed by short periods of lower intensity movements. |
| Shelf life | The length of time for which an item remains usable, fit for consumption, or saleable. |
| Cream Soda | Cream soda is a sweet soft drink. Generally flavored with vanilla and based on the taste of an ice cream float |
| Root Beer | Root beer is a sweet North American soft drink traditionally made using the root bark of the sassafras tree Sassafras albidum or the vine of Smilax ornata as the primary flavor. Root beer is typically, but not exclusively, non-alcoholic, caffeine-free, sweet, and carbonated. |
| Vanilla Soda | A carbonated soft drink flavoured with vanilla. |
| Dairy-Free | A product that does not contain any milk or milk products from cows, sheep or goats. |
| Caffeine-Free Energy Drinks | Caffeine-free energy drinks rely on other ingredients to boost the energy. Popular choices include amino acids, B vitamins, and electrolytes. |


Research Methodology
Mordor Intelligence follows a four-step methodology in all our reports.
- Step-1: IDENTIFY KEY VARIABLES: In order to build a robust forecasting methodology, the variables and factors identified in Step 1 are tested against available historical market numbers. Through an iterative process, the variables required for market forecast are set, and the model is built on the basis of these variables.
- Step-2: Build a Market Model: Market-size estimations for the forecast years are in nominal terms. Inflation is not a part of the pricing, and the average selling price (ASP) is kept constant throughout the forecast period for each country.
- Step-3: Validate and Finalize: In this important step, all market numbers, variables, and analyst calls are validated through an extensive network of primary research experts from the market studied. The respondents are selected across levels and functions to generate a holistic picture of the market studied.
- Step-4: Research Outputs: Syndicated reports, custom consulting assignments, databases & subscription platforms


