Prebiotics Market Size and Share
Market Overview
| Study Period | 2021 - 2031 |
|---|---|
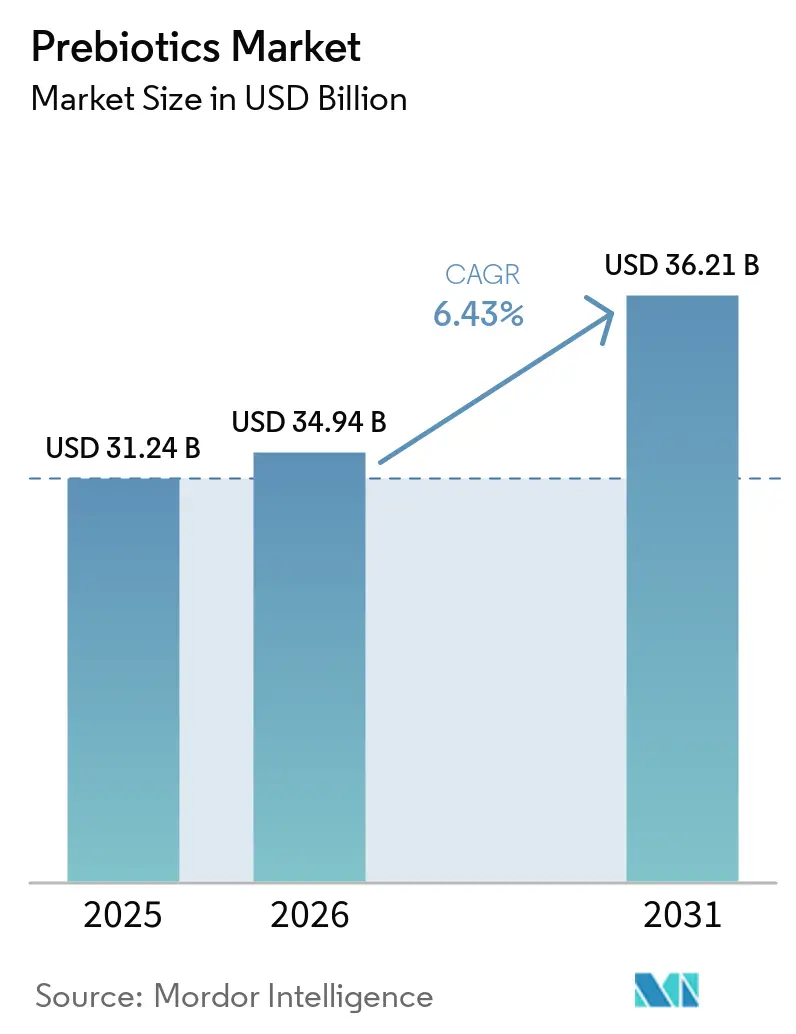
| Market Size (2026) | USD 34.94 Billion |
| Market Size (2031) | USD 36.21 Billion |
| Growth Rate (2026 - 2031) | 6.43% CAGR |
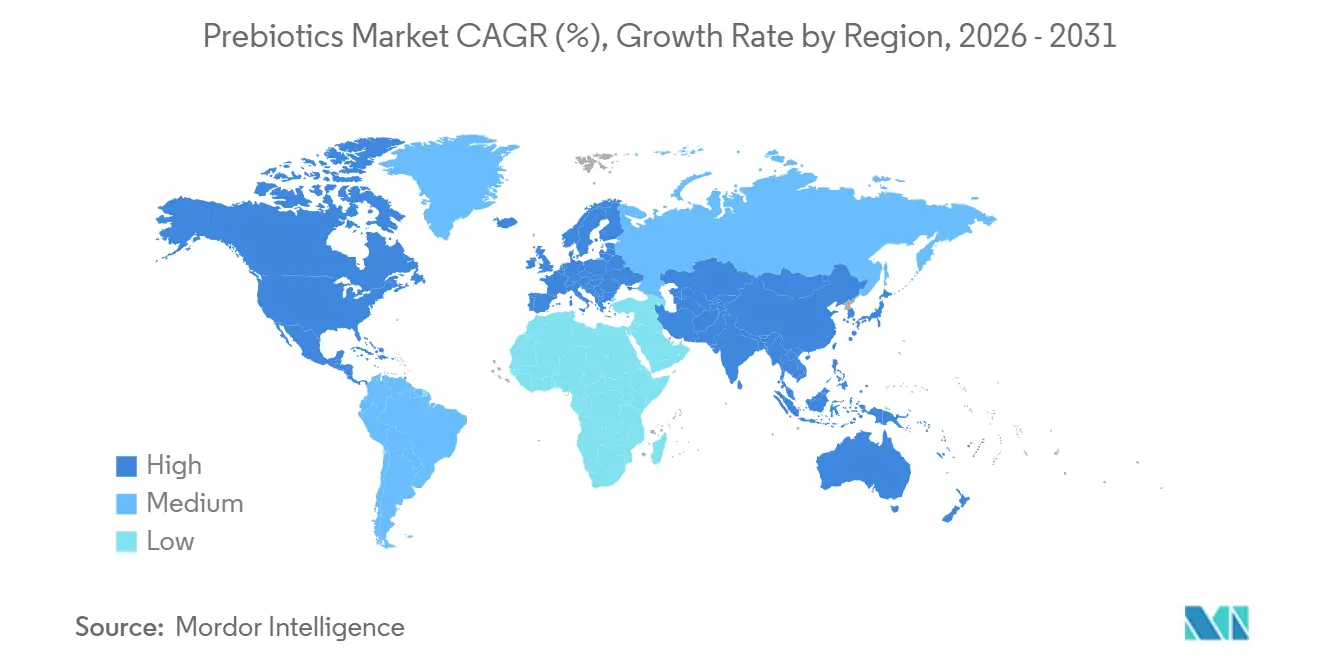
| Fastest Growing Market | Asia-Pacific |
| Largest Market | North America |
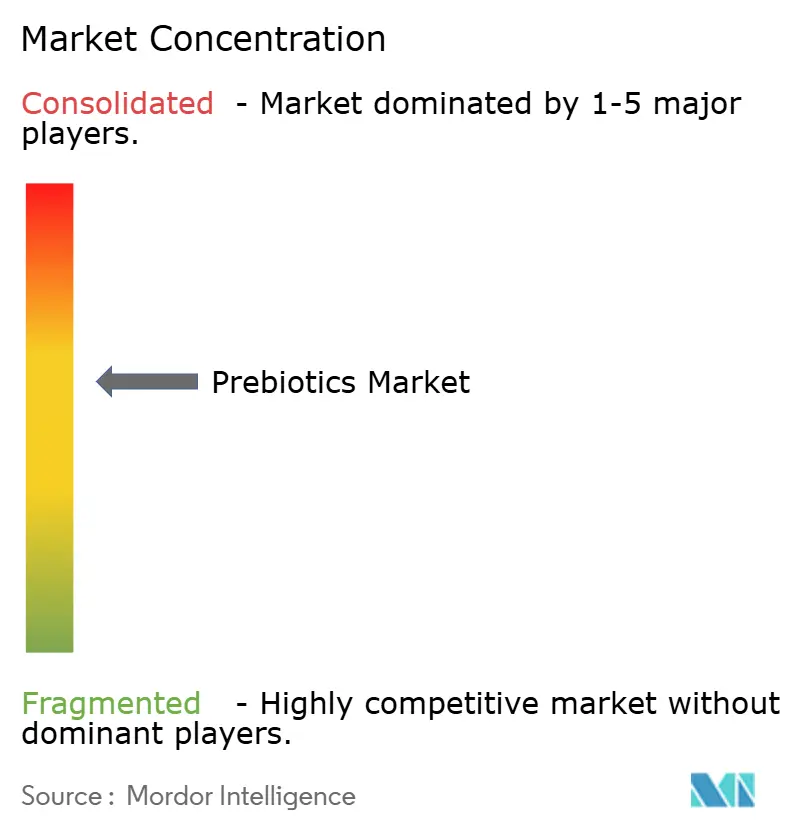
| Market Concentration | Medium |
Major Players
*Disclaimer: Major Players sorted in no particular order Image © Mordor Intelligence. Reuse requires attribution under CC BY 4.0. |
|
Prebiotics Market Analysis by Mordor Intelligence
The prebiotics market size is projected to expand from USD 31.24 billion in 2025 and USD 34.94 billion in 2026 to USD 36.21 billion by 2031, registering a CAGR of 6.43% between 2026 and 2031. The prebiotics market is being supported by a stronger consumer focus on digestive health, preventive wellness, and everyday nutrition formats that fit into normal eating habits rather than occasional supplement use. Large food and beverage companies have also moved the prebiotics market into more visible retail categories, especially through prebiotic soda launches and broader functional product positioning in grocery channels. Ingredient demand is also benefiting from sugar reduction and cleaner label reformulation because fibers such as inulin and oligosaccharides can support both texture and gut health claims in the same formulation. The prebiotics market is also attracting more upstream investment as ingredient companies and nutrition players position themselves for wider use across beverages, infant nutrition, dairy, snacks, and supplements. Competitive activity remains broad rather than concentrated, with large multinationals, specialist supplement brands, and digital-first challengers all pushing different routes to growth.
Key Report Takeaways
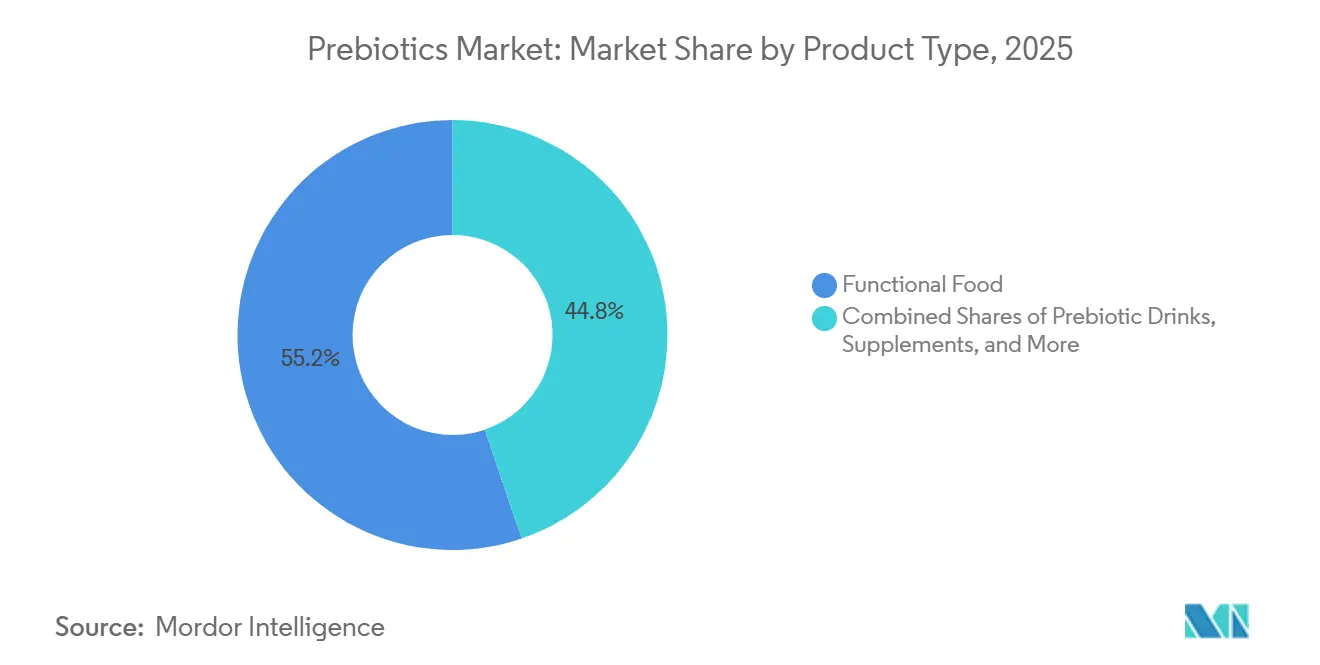
- By type, prebiotic foods held 55.21% of the market in 2025, while prebiotic drinks are forecast to grow at a 7.54% CAGR through 2031.
- By ingredient, inulin accounted for 33.46% of the market in 2025, while GOS is projected to expand at a 7.67% CAGR through 2031.
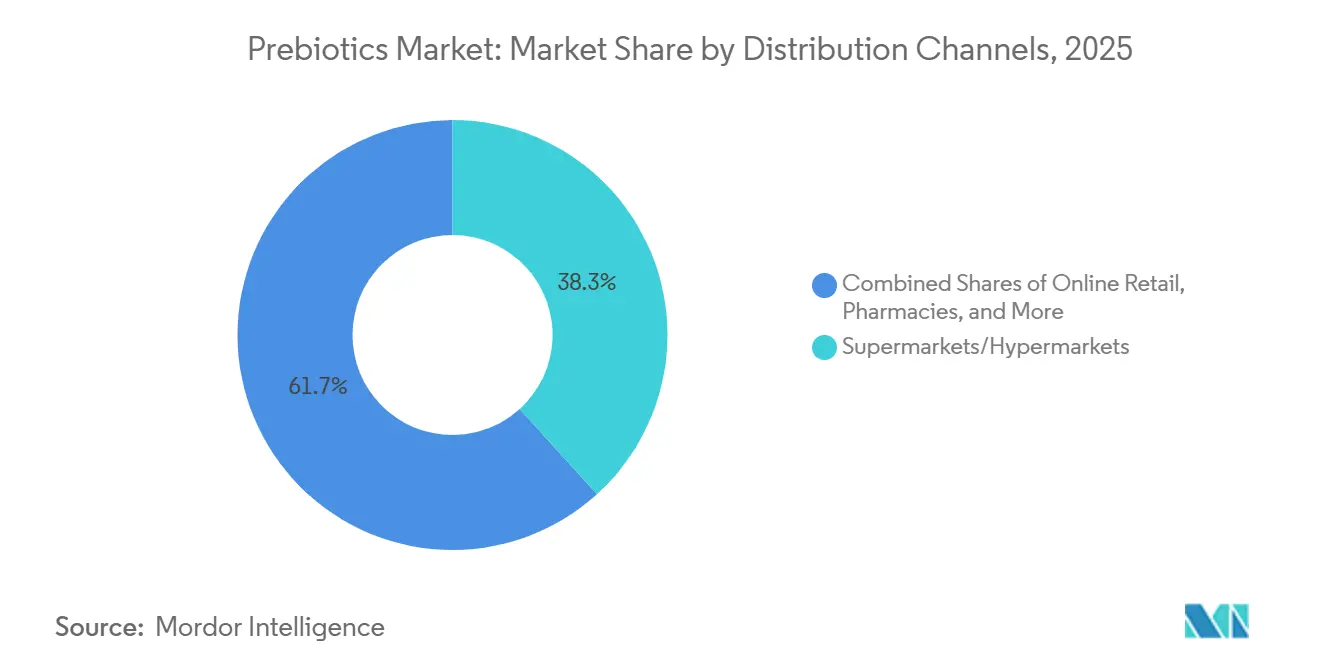
- By distribution channel, supermarkets and hypermarkets represented 38.27% of the market in 2025, while online retail is projected to grow at a 7.78% CAGR through 2031.
- By geography, Asia Pacific held 38.31% of the prebiotics market share in 2025, while North America is expected to grow at an 8.02% CAGR through 2031.
Note: Market size and forecast figures in this report are generated using Mordor Intelligence’s proprietary estimation framework, updated with the latest available data and insights as of January 2026.
Global Prebiotics Market Trends and Insights
Drivers Impact Analysis*
| Drivers | (~) % Impact on CAGR Foreasts | Geographic Relevance | Impact Timeline |
|---|---|---|---|
| Rising Demand for Gut Health and Preventive Wellness | +1.4% | Global | Short term (≤ 2 years) |
| Expansion of Functional Food and Beverage Reformulation | +1.2% | Global, particularly North America & EU | Medium term (2-4 years) |
| Premiumization of Branded Digestive Health Products | +0.8% | North America, Western Europe, APAC urban centres | Medium term (2-4 years) |
| Growth of Direct-to-Consumer Supplement Commerce | +0.7% | North America, Europe | Short term (≤ 2 years) |
| Clean-Label and Plant-Based Ingredient Preference | +0.6% | North America & EU, with growing APAC spillover | Medium term (2-4 years) |
| Product Innovation in Synbiotic and Microbiome-Targeted Formats | +0.5% | Global, early gains in North America & EU | Long term (≥ 4 years) |
| Source: Mordor Intelligence | |||
Rising Demand for Gut Health and Preventive Wellness
Gut health remains one of the strongest consumer entry points for the prebiotics market, because buyers are now treating digestive balance as part of a broader daily wellness routine rather than a short-term response to discomfort. This shift favors products that can be consumed through routine meals and beverages, which keeps the prebiotics market closely tied to regular food and drink occasions instead of only specialist supplement use. In Japan, the long-standing Food for Specified Health Uses framework has helped normalize gut health-related food claims and has supported steady acceptance of functional foods that target intestinal health[1]Source: Japan Consumer Affairs Agency, “Food for Specified Health Uses,” Consumer Affairs Agency of Japan, caa.go.jp. Japan also continued to show momentum in functional ingredients tied to dietary fiber and oligosaccharides during 2025, which reinforces the durability of demand in an established preventive nutrition market. The result is a demand base that is less dependent on one-time health concerns and more aligned with regular consumption behavior in mass retail channels.
Expansion of Functional Food and Beverage Reformulation
Food and beverage reformulation is one of the clearest structural supports for the prebiotics market, because it expands demand without requiring consumers to adopt an entirely new category. PepsiCo pushed this trend further when it announced Pepsi Prebiotic Cola in 2025 and then widened retail availability in 2026, which helped move prebiotic positioning into a mainstream soda format. Coca-Cola also entered the category with Simply Pop in February 2025, which showed that major beverage companies see room for prebiotic claims in widely distributed consumer products. Every large-scale reformulation event of this kind increases upstream ingredient demand because fibers that were once sold mainly into supplements begin to move through much larger packaged food and beverage volumes. That is why the prebiotics market is increasingly linked to reformulation strategies in mainstream categories such as beverages, dairy, cereal, and infant nutrition.
Clean Label and Plant Based Ingredient Preference
Clean label expectations are shaping the prebiotics market by pushing manufacturers toward recognizable, plant-based, and minimally processed ingredient stories. According to the Ingredion report from 2025, 56% of consumers paid more for recognizable ingredients in the United States[2]Source: Ingredion Inc., "Clean label ingredients: From buzzword to business driver", ingredion.com. Chicory root inulin and naturally sourced FOS benefit from this shift because they fit both consumer label expectations and food technology needs in reformulated products. Ingredion’s 2024 acquisition of Benicaros, a prebiotic fiber developed from upcycled carrot pomace, also showed that clean-label positioning can be combined with circular sourcing and clinically supported benefits in one ingredient platform. That combination gives suppliers a stronger premium case in parts of the prebiotics market where simple fiber fortification is no longer enough to stand out. It also supports wider use in packaged foods and supplements where consumers increasingly look for ingredient familiarity, traceability, and product claims that feel easy to understand.
Product Innovation in Synbiotic and Microbiome Targeted Formats
Synbiotic and microbiome-targeted products are adding a more clinically differentiated layer to the prebiotics market, especially in premium supplements and specialized nutrition. This matters because prebiotic-only products do not always create noticeable short-term benefits for consumers, while combination formats can make outcomes feel more tangible and easier to explain. In 2026, peer-reviewed evidence linked Seed Health’s DS-01 synbiotic to improved microbiome recovery after antibiotic exposure, with increases in beneficial bacterial diversity and metabolites such as butyrate and urolithin A. Lallemand Health Solutions and FrieslandCampina Ingredients also reported stronger microbiota activity and short-chain fatty acid production for a synbiotic concept built around Biotis GOS-OP, which added commercial support for higher-value targeted formulations. These developments do not replace mainstream fiber demand, but they do raise the ceiling for premium applications across the prebiotics market.
Restraints Impact Analysis*
| Restraints | (~) % Impact on CAGR Forecasts | Geographic Relevance | Impact Timeline |
|---|---|---|---|
| Consumer Confusion Between Prebiotics and Probiotics | -0.5% | Global, particularly Emerging Markets | Short term (≤ 2 years) |
| Digestive Tolerance Limits and Dosage Sensitivity | -0.3% | Global | Short term (≤ 2 years) |
| Health-Claim and Labeling Complexity Across Regions | -0.5% | EU, North America | Medium term (2-4 years) |
| Raw Material Variability and Formulation Stability Constraints | -0.2% | Global, Asia-Pacific supply chains | Medium term (2-4 years) |
| Source: Mordor Intelligence | |||
Consumer Confusion Between Prebiotics and Probiotics
The prebiotics market still faces a basic education problem, because many buyers understand gut health in general but do not clearly separate prebiotics from probiotics. This confusion weakens conversion into dedicated prebiotic products and often pushes first time buyers toward blended synbiotic formats instead of standalone fiber based options. Product naming also adds to the problem, because some brands highlight fiber names such as inulin or FOS without explaining the functional role, while others use the word prebiotic without clarifying the mechanism or ingredient basis. That creates extra marketing and education costs for brands across the prebiotics market, especially for smaller players that lack the scale to sustain dietitian outreach, content programs, and repeated labeling support. The commercial effect is slower category learning and less efficient customer acquisition, even while overall interest in digestive wellness remains strong.
Health Claim and Labeling Complexity Across Regions
Regulation remains a meaningful constraint on the prebiotics market because brands cannot use the same claim strategy across major regions. In Europe, ILSI Europe noted that the term prebiotic has not been authorized as a standalone health claim, which means companies must rely on approved claims for specific non-digestible carbohydrates rather than the broader scientific concept. A peer-reviewed roadmap from researchers linked to the University of Reading and ILSI Europe also emphasized the need for more standardized trial design and stronger EFSA-compatible documentation before broader authorization can be achieved. In the United States, the FDA’s 2024 final rule on the implied nutrient content claim healthy created an updated pathway but also set a compliance transition that stretches into 2028[3]Source: U.S. Food and Drug Administration, “Updating the Definition of the Implied Nutrient Content Claim Healthy,” Federal Register, govinfo.gov. This kind of variation forces multinational companies in the prebiotics market to manage multiple claim sets, regulatory files, and product communication strategies at the same time.
*Our forecasts treat driver/restraint impacts as directional, not additive. The impact forecasts reflect baseline growth, mix effects, and variable interactions.
Segment Analysis
By Type: Prebiotic Foods Lead as Prebiotic Drinks Accelerate
Prebiotic foods held 55.21% of the market in 2025, which kept this segment at the center of the prebiotics market because consumers still prefer products that fit into ordinary meals and routines. Yogurts, fortified cereals, breads, and functional dairy beverages continue to benefit from that habit-based consumption pattern, since they do not require the user to remember a separate supplement occasion. Prebiotic drinks are the fastest-growing type at a 7.54% CAGR through 2031, and that momentum reflects the visibility created by new beverage launches from major companies. PepsiCo’s nationwide expansion of Pepsi Prebiotic Cola in 2026 and Coca-Cola’s Simply Pop launch in 2025 helped create a familiar entry point for consumers who might never have looked for prebiotic products in the supplement aisle. That shift matters because it brings the prebiotics market into high-traffic beverage shelves and normalizes purchase through everyday retail behavior.
The lead position of foods also reflects supply-side economics rather than only consumer preference. Many manufacturers can add inulin or FOS to existing packaged foods more easily than they can build a new supplement brand, which keeps formulation costs and distribution complexity lower. That gives food based formats a durable advantage in the prebiotics market, even as drinks gain speed. Yakult Honsha’s 2026 renewal of Yakult 400 and Yakult 400 LT into immune gut care labeled functional foods showed how established food brands can refresh category relevance without creating a new format from scratch. Supplements still retain a premium role through more specialized positioning, while pet food and nutrition remain an emerging type opportunity as digestive health logic spreads into companion animal products.


By Ingredient: Inulin Anchors the Base While GOS Gains Momentum
Inulin held 33.46% of the market in 2025, giving it the largest role in the ingredient structure of the prebiotics market because it benefits from an established chicory supply chain, wide regulatory familiarity, and broad use in food formulation. Its value comes from serving more than one purpose, since it can support fiber fortification, texture, and fat replacement in addition to digestive health positioning. FOS continues to hold an important supporting role in beverages, infant nutrition, and reduced-calorie products where sweetness and functionality matter together. GOS is the fastest-growing ingredient at a 7.67% CAGR through 2031, and that performance is closely tied to stronger clinical relevance in infant formula and growing use in adult synbiotic products. In this context, GOS is one of the clearest areas where the prebiotics market size at the ingredient level is being pulled upward by higher-value science-led applications rather than only by bulk volume demand.
Newer fibers and blended systems are widening the innovation range around the prebiotics market, even though they still sit behind inulin in scale. Lallemand Health Solutions and FrieslandCampina Ingredients showed this direction with a synbiotic concept that paired GOS with probiotic strains and generated stronger microbiota activity in controlled work, which supports a higher performance positioning for selected formulations. MSP Starch Products also expanded European distribution for its Solnul resistant potato starch in 2026, which points to rising commercial interest in non inulin prebiotic platforms. The likely result is a two speed ingredient landscape where inulin and FOS remain volume workhorses, while GOS and other novel fibers capture more premium and condition specific demand. That pattern keeps the prebiotics market broad enough to support both mainstream food reformulation and more targeted clinical nutrition strategies.
By Distribution Channel: Supermarkets Retain Scale While Online Retail Expands Faster
Supermarkets and hypermarkets accounted for 38.27% of the market in 2025, which kept them as the largest channel in the prebiotics market because daily shopping habits still drive most packaged food and functional beverage purchases. Their strength is especially clear in dairy, cereal, and beverage aisles where prebiotic claims can be added to products that already belong in regular household baskets. This channel also benefits from established shelf programs and private label participation, which help broaden consumer access across price points. Online retail is the fastest-growing channel at a 7.78% CAGR through 2031, showing how the prebiotics market is shifting toward repeat purchase models and more targeted customer acquisition. That growth is being supported by direct-to-consumer subscriptions, marketplace discovery, and brand-owned websites that can explain digestive health products in more detail than crowded physical shelves.
Digital growth is also changing who can compete effectively in the prebiotics market. Specialist brands such as The Nue Co., Superguts Prebiotics, and Uplift Foods can now reach consumers without paying for premium supermarket placement, which lowers the threshold for entry in supplements and premium wellness products. Pharmacies and drug stores still remain important for clinically framed prebiotic products, because practitioner proximity and trust continue to matter in higher priced supplement formats. At the same time, the shift toward online channels gives brands more direct access to purchase data, repeat order patterns, and personalized recommendation systems. That makes distribution less about physical presence alone and more about how well a company can combine education, retention, and digital engagement in the prebiotics market.
Geography Analysis
Asia Pacific held 38.31% of the market in 2025, giving the region the largest position in the prebiotics market because functional food habits are better established there than in many Western markets. Japan remains the strongest anchor in this regional structure, supported by the Food for Specified Health Uses system that gives companies a recognized path for approved health positioning in foods. That regulatory continuity has helped normalize long-term consumption of bifidogenic and fiber-enriched products in the country. Japan also recorded continued growth in the domestic distribution value of functional ingredients tied to dietary fiber and oligosaccharides during 2025, which supports the region’s leadership in the prebiotics market. China adds another large demand base through rising health spending, growing functional dairy and infant nutrition interest, and stronger consumer attention to preventive wellness.
North America is the fastest-growing region at an 8.02% CAGR through 2031, and that pace reflects how quickly the prebiotics market has moved into visible consumer categories such as prebiotic soda and digital supplements. PepsiCo and Coca-Cola both helped accelerate awareness in 2025 and 2026 by bringing prebiotic claims into high profile beverage launches that reached mainstream shoppers. That visibility is important because it reduces the education burden that smaller digestive health brands once carried alone. The region also benefits from strong direct to consumer habits, high supplement literacy, and a consumer base that is comfortable paying for premium wellness products. Europe remains important in the prebiotics market, but claim complexity is a bigger challenge there because brands cannot lean on the term prebiotic as freely in packaging and communication. Even so, awareness of gut health remains high in Germany, France, and the Nordic countries, which sustains demand under alternative fiber and digestive health positioning.
South America and the Middle East and Africa remain smaller in absolute value, but they extend the geographic runway for the prebiotics market from a lower base. Brazil and Argentina lead South America through stronger urban demand for functional dairy, infant nutrition, and branded packaged foods. Peru, Chile, and Colombia also present nearer term room for expansion as modern retail and premium food demand continue to improve. In the Middle East and Africa, the most accessible demand centers are the UAE and Saudi Arabia, where organized retail, pharmacy channels, and e commerce are making premium functional products easier to reach.

Competitive Landscape
The prebiotics market remains moderately fragmented, with large food and nutrition companies competing alongside ingredient specialists and digitally native supplement brands. Danone, Nestlé, Abbott, Yakult, and PepsiCo hold advantages in formulation resources, clinical backing, and broad distribution reach across food, infant nutrition, and beverages. Danone strengthened its gut health positioning in 2025 through the acquisition of The Akkermansia Company, which showed a clear interest in next-generation biotic science beyond traditional fiber formats. PepsiCo also raised the competitive bar when it acquired Poppi and then extended prebiotic positioning into its core cola franchise, which brought much larger brand visibility to the prebiotics market. These moves show that category leadership is increasingly tied to how well companies combine scale, consumer visibility, and microbiome-related product development.
Upstream ingredient control is becoming more important as the prebiotics market expands into more packaged food applications. Ingredion’s recommended acquisition of Tate and Lyle in 2026 highlighted that point by combining sweetening, fortification, texture, and fiber-related capabilities in one broader ingredient platform. Nestlé’s 2026 partnership with Helaina pointed in a similar direction from the branded nutrition side, with a focus on advanced early life ingredients and stronger differentiation in infant nutrition. These actions matter because scientific credibility is no longer optional for premium positions in the prebiotics market. Companies that can link formulation science with strong regulatory and brand execution are better placed to defend margins as basic fiber formats become more common.
Digital first brands remain the most disruptive challengers in the prebiotics market because they can build loyalty through subscriptions, social proof, and targeted formulation stories without relying on mass retail shelf space. Bloom Nutrition, Superguts Prebiotics, The Nue Co., and Thorne HealthTech all reflect this pattern through premium positioning and more direct consumer relationships. White space still exists in targeted products tied to metabolic health, skin health, and cognitive performance, where microbiome science is advancing faster than broad commercial rollout. Emerging companies such as Ora Biotics are also exploring lower dose targeted fibers for specific beneficial bacteria, which could help address tolerance issues that still limit repeat use at higher dosages
Prebiotics Industry Leaders
-
Yakult Honsha Co., Ltd.
-
Danone S.A.
-
NOW Health Group, Inc.
-
Nestlé S.A.
-
Abbott Laboratories
- *Disclaimer: Major Players sorted in no particular order

Recent Industry Developments
- March 2026: Perfect Snacks expanded its functional snack portfolio with the launch of Protein + Prebiotics, a refrigerated protein bar range combining 20 grams of protein with prebiotic fiber to support digestive wellness. The new products are positioned as clean-label offerings, free from artificial sweeteners, sugar alcohols, artificial colors, flavors, and preservatives.
- July 2025: PepsiCo announced the launch of Pepsi Prebiotic Cola, marking the company's first entry into the traditional prebiotic cola category and one of the most significant innovations in its flagship cola portfolio in over two decades. The product contains 3 grams of prebiotic fiber, 5 grams of cane sugar, 30 calories, and no artificial sweeteners, and is available in Original Cola and Cherry Vanilla flavors.
- February 2025: The Coca-Cola Company expanded its functional beverage portfolio with the launch of Simply Pop, its first prebiotic soda brand under the Simply beverage platform. The new range debuted in five fruit-forward flavors- Strawberry, Pineapple Mango, Fruit Punch, Lime, and Citrus Punch- and contains 6 grams of prebiotic fiber, along with vitamin C and zinc to support digestive and immune health.


Global Prebiotics Market Report Scope
| Prebiotic Foods |
| Prebiotic Drinks |
| Supplements |
| Pet Food and Nutrition |
| Inulin |
| Fructo-Oligosaccharides |
| Galacto-Oligosaccharides |
| Blended Prebiotics |
| Others |
| Supermarkets/Hypermarkets |
| Pharmacies/Drug Stores |
| Online Retail Stores |
| Other Distribution Channels |
| North America | United States |
| Canada | |
| Mexico | |
| Rest of North America | |
| Europe | Germany |
| United Kingdom | |
| France | |
| Italy | |
| Spain | |
| Netherlands | |
| Sweden | |
| Poland | |
| Belgium | |
| Rest of Europe | |
| Asia-Pacific | China |
| India | |
| Japan | |
| Australia | |
| South Korea | |
| Vietnam | |
| Indonesia | |
| Thailand | |
| Singapore | |
| Rest of Asia-Pacific | |
| South America | Brazil |
| Argentina | |
| Chile | |
| Peru | |
| Colombia | |
| Rest of South America | |
| Middle East and Africa | United Arab Emirates |
| Saudi Arabia | |
| South Africa | |
| Nigeria | |
| Egypt | |
| Morocco | |
| Turkey | |
| Rest of Middle East and Africa |
| By Type | Prebiotic Foods | |
| Prebiotic Drinks | ||
| Supplements | ||
| Pet Food and Nutrition | ||
| By Ingredients | Inulin | |
| Fructo-Oligosaccharides | ||
| Galacto-Oligosaccharides | ||
| Blended Prebiotics | ||
| Others | ||
| By Distribution Channels | Supermarkets/Hypermarkets | |
| Pharmacies/Drug Stores | ||
| Online Retail Stores | ||
| Other Distribution Channels | ||
| By Geography | North America | United States |
| Canada | ||
| Mexico | ||
| Rest of North America | ||
| Europe | Germany | |
| United Kingdom | ||
| France | ||
| Italy | ||
| Spain | ||
| Netherlands | ||
| Sweden | ||
| Poland | ||
| Belgium | ||
| Rest of Europe | ||
| Asia-Pacific | China | |
| India | ||
| Japan | ||
| Australia | ||
| South Korea | ||
| Vietnam | ||
| Indonesia | ||
| Thailand | ||
| Singapore | ||
| Rest of Asia-Pacific | ||
| South America | Brazil | |
| Argentina | ||
| Chile | ||
| Peru | ||
| Colombia | ||
| Rest of South America | ||
| Middle East and Africa | United Arab Emirates | |
| Saudi Arabia | ||
| South Africa | ||
| Nigeria | ||
| Egypt | ||
| Morocco | ||
| Turkey | ||
| Rest of Middle East and Africa | ||


Key Questions Answered in the Report
How large will the prebiotics space become by 2031?
The prebiotics market size is projected to reach USD 36.21 billion by 2031 from USD 34.94 billion in 2026, at a 6.43% CAGR over 2026 to 2031.
Which product type currently leads sales?
Prebiotic foods led with 55.21% share in 2025, showing that consumers still prefer prebiotics in regular food routines rather than only in supplement formats.
Which ingredient is growing the fastest?
GOS is the fastest growing ingredient segment, with a projected 7.67% CAGR through 2031, supported by infant nutrition and synbiotic applications.
What is driving growth in prebiotics demand globally?
Growth is being supported by stronger interest in gut health, more functional food reformulation, and wider use of prebiotic claims in mainstream beverages and daily nutrition products.
Page last updated on:


