
Orthopedic Splints Market Size and Share
Market Overview
| Study Period | 2020 - 2031 |
|---|---|
| Market Size (2026) | USD 1.85 Billion |
| Market Size (2031) | USD 2.91 Billion |
| Growth Rate (2026 - 2031) | 9.46 % |
| Fastest Growing Market | Asia Pacific |
| Largest Market | North America |
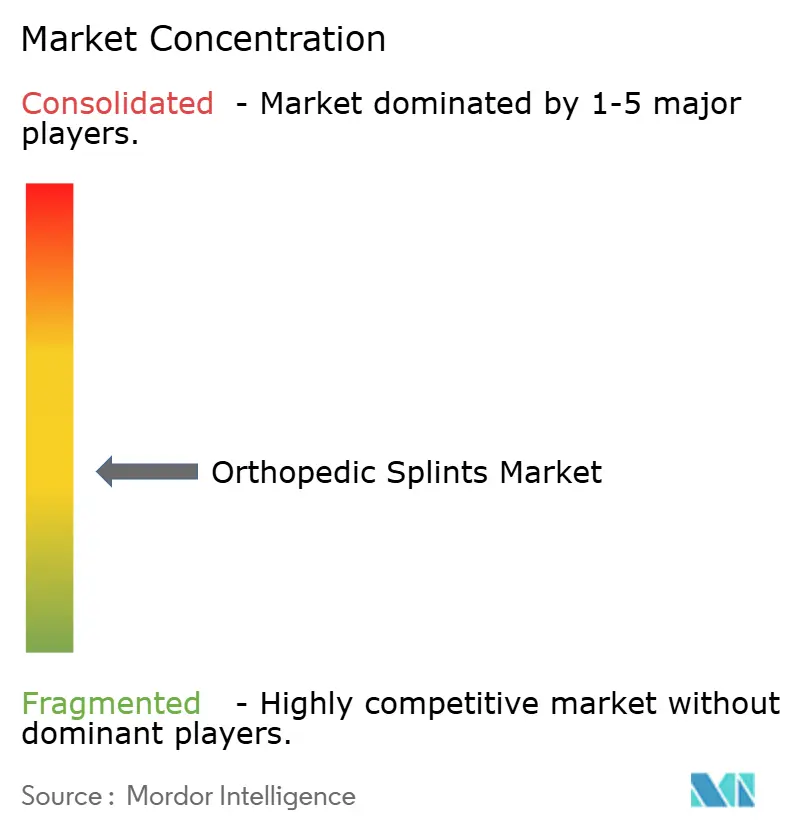
| Market Concentration | Medium |
Major Players
*Disclaimer: Major Players sorted in no particular order Image © Mordor Intelligence. Reuse requires attribution under CC BY 4.0. |
|
Orthopedic Splints Market Analysis by Mordor Intelligence
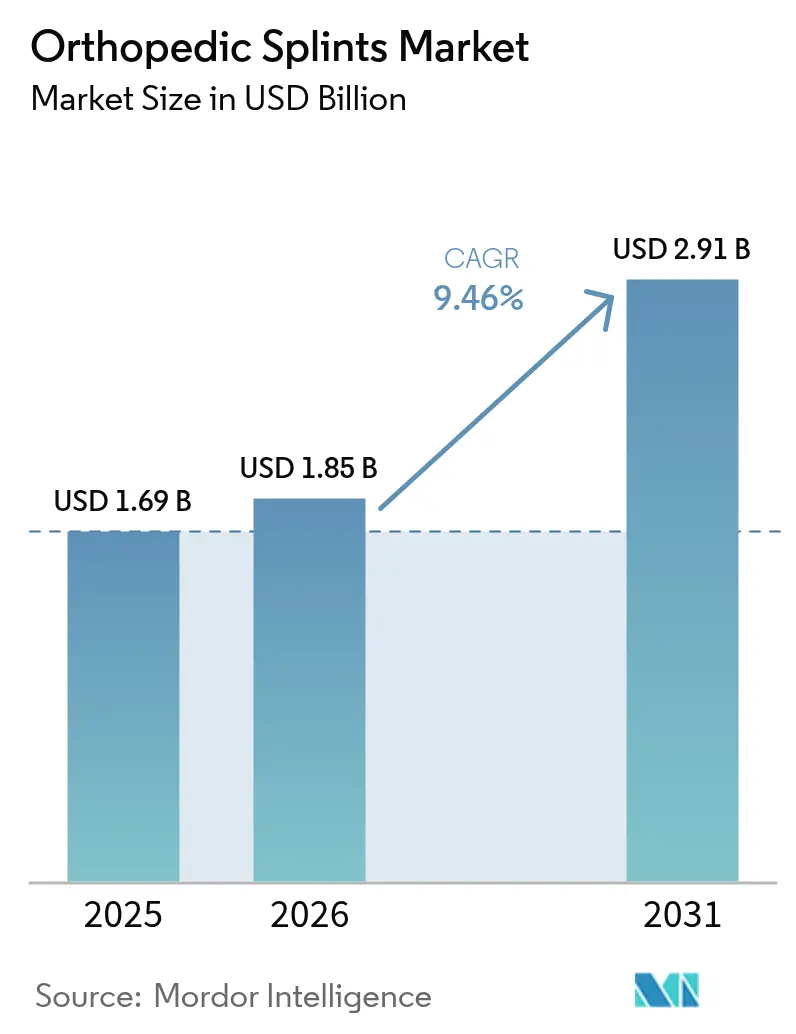
The orthopedic splints market size is expected to grow from USD 1.69 billion in 2025 to USD 1.85 billion in 2026 and is forecast to reach USD 2.91 billion by 2031 at 9.46% CAGR over 2026-2031. Demand expands as populations age, sports participation rises, and care delivery shifts toward outpatient settings. Material advances, notably the move from plaster to lighter composites and 3-D printed forms, shorten application times and improve patient comfort, encouraging faster provider uptake. Regulatory agencies now pilot lifecycle-based review pathways that reward clinically validated innovation while reimbursement schedules push providers to favor cost-efficient, outcomes-oriented products. Together, these dynamics keep pricing disciplined and stimulate continual product refresh cycles, sustaining momentum in the orthopedic splints market.
Key Report Takeaways
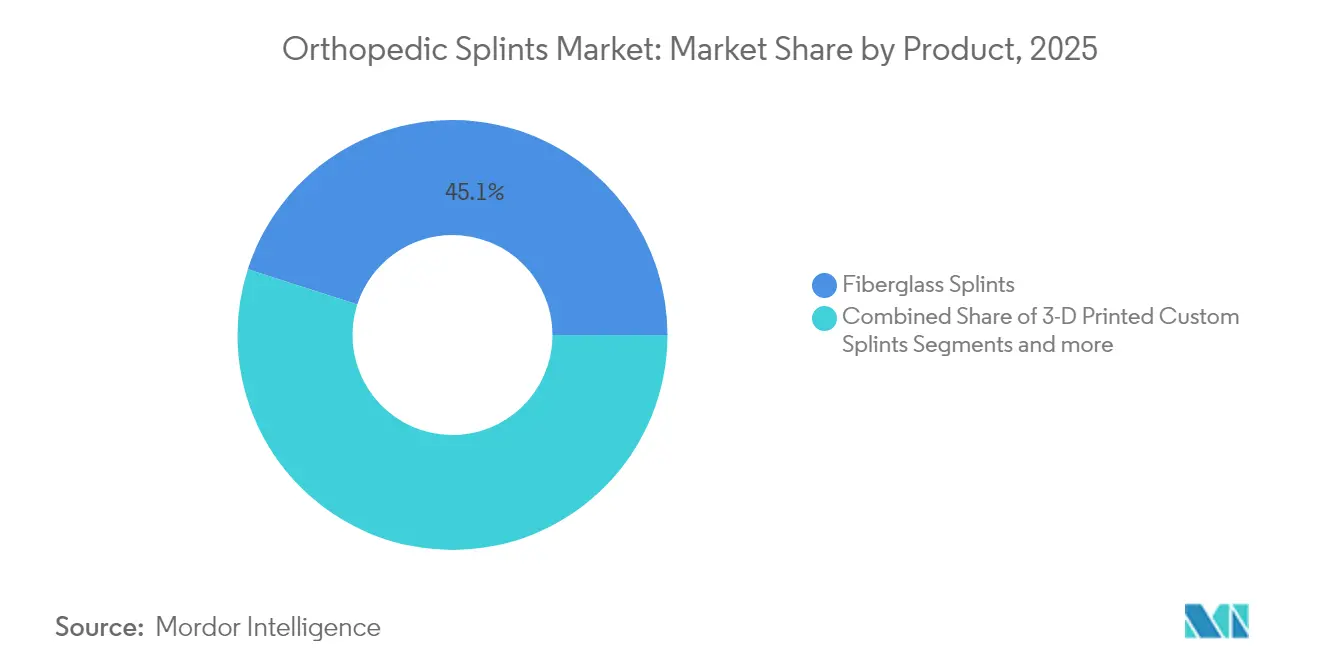
- By product type, fiberglass captured 45.05% of orthopedic splints market share in 2025, while 3-D printed custom splints are positioned for a 10.18% CAGR through 2031.
- By material, fiberglass held 44.01% share of the orthopedic splints market size in 2025; thermoplastics are on track for a 10.05% CAGR to 2031.
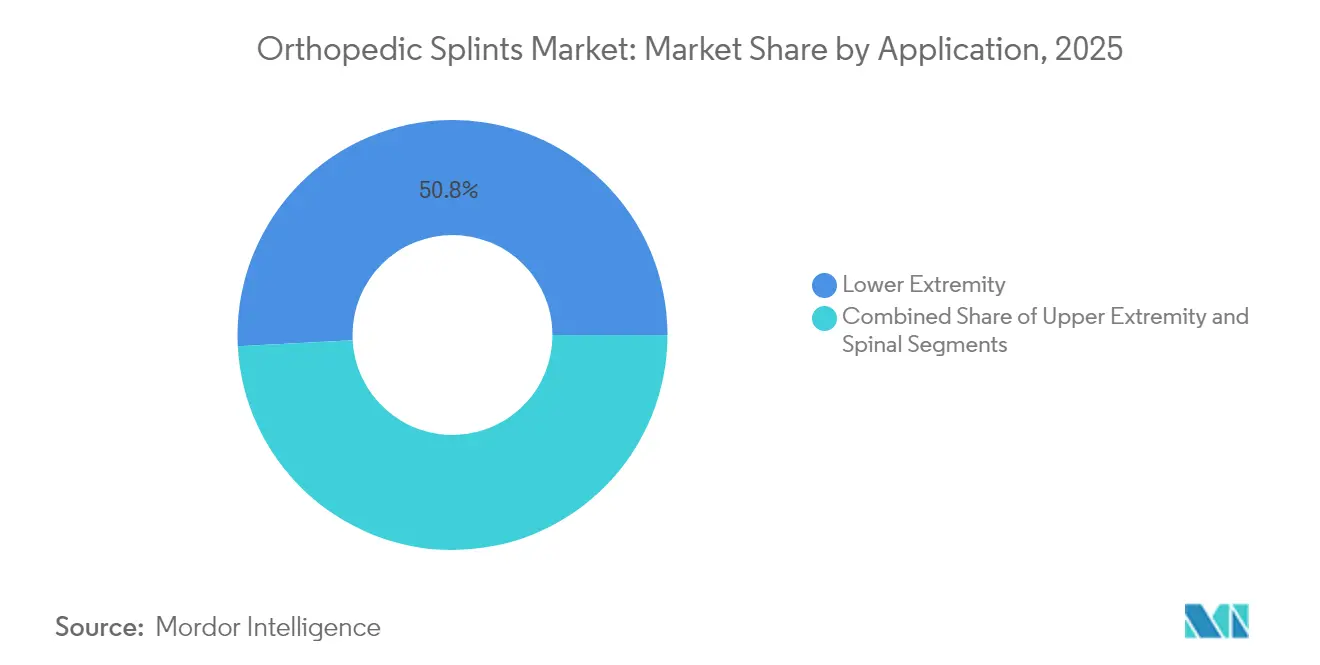
- By application, lower extremity splints accounted for 50.84% of the orthopedic splints market size in 2025, whereas spinal applications are projected to grow at 10.22% CAGR through 2031.
- By end user, hospitals led with 48.35% revenue share in 2025, and orthopedic clinics are expected to post the fastest CAGR of 10.28% to 2031.
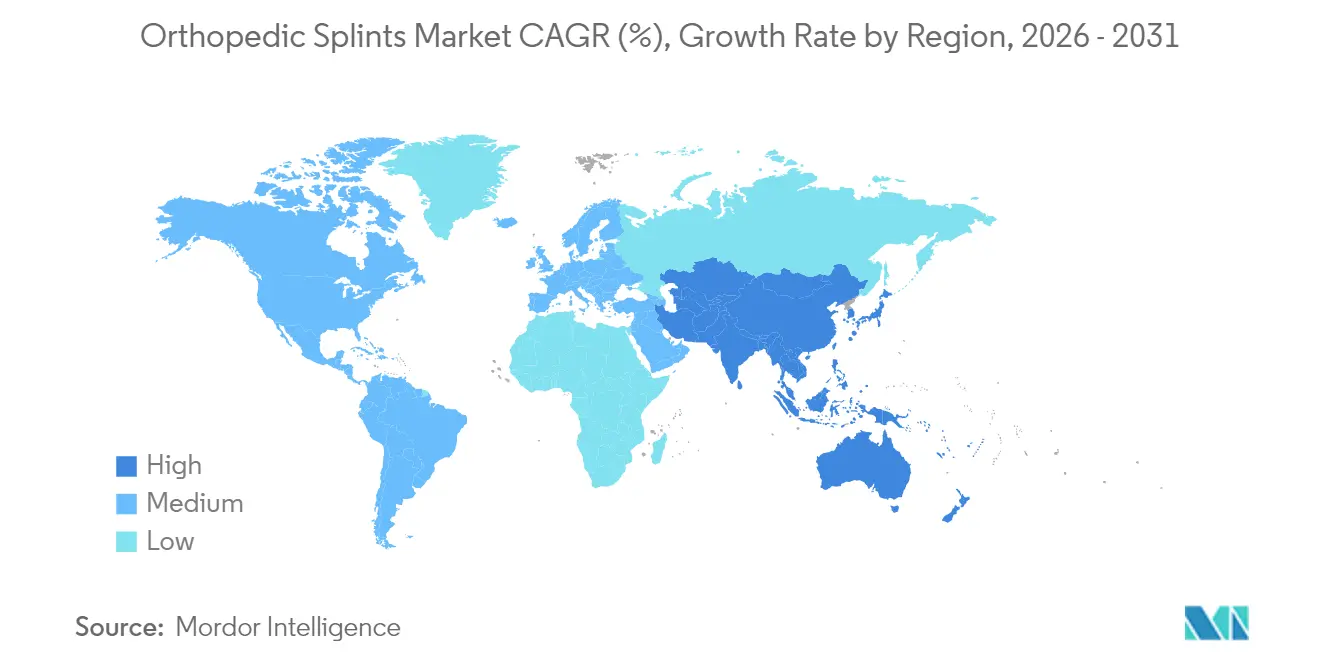
- By geography, North America dominated with 41.02% share in 2025, while Asia-Pacific is anticipated to advance at 10.44% CAGR during the forecast window.
Note: Market size and forecast figures in this report are generated using Mordor Intelligence’s proprietary estimation framework, updated with the latest available data and insights as of 2026.
Global Orthopedic Splints Market Trends and Insights
Drivers Impact Analysis*
| Driver | (~) % Impact on CAGR Forecast | Geographic Relevance | Impact Timeline |
|---|---|---|---|
| Rising Musculoskeletal Disorder Burden | +2.1% | Global, with concentration in aging populations of North America, Europe, and East Asia | Long term (≥ 4 years) |
| Growing Geriatric Population | +1.8% | Global, particularly North America, Europe, and Japan | Long term (≥ 4 years) |
| Increasing Sports & Traffic-Related Fractures | +1.4% | Global, with higher impact in developed markets with active sports participation | Medium term (2-4 years) |
| Material Innovations Including Water-Proof and Lightweight Composites | +1.2% | Global, with early adoption in North America and Europe | Medium term (2-4 years) |
| Rapid Adoption Of 3-D Printed Custom Splints | +1.0% | North America, Europe, and select APAC markets with advanced manufacturing capabilities | Short term (≤ 2 years) |
| Home-Based & OTC Splinting Via E-Commerce and Tele-Rehab | +0.9% | Global, with strongest penetration in digitally mature markets | Short term (≤ 2 years) |
| Source: Mordor Intelligence | |||
Rising Musculoskeletal Disorder Burden
Global osteoarthritis cases hit 607 million in 2021 and are still climbing, making splints a first-line, non-surgical solution for joint stabilization. Low back pain alone could reach 253 million incident cases by 2029, reinforcing the need for cost-effective immobilization devices. Occupational studies note cervical pain in 88.8% of office workers and lower-back pain in 83.8%, underscoring widespread, chronic demand [1]Monika S. Popova, "Demographic and Occupational Determinants of Work-Related Musculoskeletal Disorders: A Cross-Sectional Study," MDPI, mdpi.com. Splints mitigate pain and limit further joint deterioration, especially for patients seeking to delay or avoid surgery. As payers emphasize conservative management before approving invasive procedures, the orthopedic splints market gains steady procedural volume.
Growing Geriatric Population
Age-standardized osteoarthritis prevalence rose significantly [2]Zihao Wang, "Global, regional and national burden of osteoarthritis in 1990–2021: a systematic analysis of the global burden of disease study 2021," BMC Musculoskeletal Disorders, bmcmusculoskeletdisord.biomedcentral.com. Fracture susceptibility grows alongside reductions in bone density, particularly among post-menopausal women, who often require vertebral or hip stabilization. Providers increasingly opt for splints to preserve mobility in elderly patients not suited for operating room exposure. Longer treatment timelines and repeat device replacement needs add a predictable revenue stream for suppliers. In wealthier nations, universal coverage ensures consistent device reimbursement, cementing the orthopedic splints market as a pillar of geriatric musculoskeletal care.
Increasing Sports & Traffic-Related Fractures
Volleyball, soccer, and track activities collectively contributed more than 1.3 million injuries from 2013-2023, with ankle strains and sprains dominating diagnostic codes [3]Aaditya Jandhyala, "Volleyball Related Injuries in Adolescents: A Decade of Data," Orthopedic Reviews, orthopedicreviews.openmedicalpublishing.org. Road traffic trauma continues to rise in many economies, while electric scooter mishaps bring fresh upper-extremity case load to emergency departments. Non-operative fracture management protocols often start with splint immobilization, leading to rapid stock depletion during peak sports seasons. Athletes favor lightweight, breathable materials that permit limited activity without compromising healing, guiding suppliers to premium-priced composite lines within the orthopedic splints market.
Material Innovations in Lightweight Composites
Thermoplastic and composite splints weigh less and tolerate water exposure, removing historic patient-compliance barriers linked to plaster. Clinical tests show wood-plastic composites can be fitted in 5.3 minutes on average, lowering clinician workload. Biobased polyester scored higher on pediatric satisfaction metrics and reduced skin complications versus fiberglass. New Healthcare Common Procedure Coding System (HCPCS) codes for total carbon-fiber ankle-foot orthoses signal insurance recognition of ultra-light, high-strength formats. These improvements accelerate provider migration toward modern designs, increasing per-patient average selling price without lengthening chair time.
Restraints Impact Analysis*
| Restraint | (~) % Impact on CAGR Forecast | Geographic Relevance | Impact Timeline |
|---|---|---|---|
| Negligence Toward Minor Injuries | -1.5% | Global, with higher impact in markets with limited healthcare access | Medium term (2-4 years) |
| Availability Of Functional Braces & Walking Boots | -0.8% | Developed markets with advanced orthopedic product availability | Short term (≤ 2 years) |
| Reimbursement Gaps for OTC Splints in EMS | -0.9% | North America and Europe with structured reimbursement systems | Medium term (2-4 years) |
| Environmental Disposal Concerns for Fiberglass/Plastics | -0.6% | Global, with strongest impact in environmentally conscious markets | Long term (≥ 4 years) |
| Source: Mordor Intelligence | |||
Negligence Toward Minor Injuries
Socioeconomic disparities mean many sprains and hairline fractures never reach orthopedic clinics. Under-insured groups disproportionately use emergency departments or forego care altogether, cutting directly into unit volumes. Rural hospitals face staffing shortages; only 30% employ orthopedic surgeons, delaying definitive treatment and occasionally shifting demand toward home remedies. In emerging economies, reliance on traditional bone setters leads to delayed presentations in 28% of pediatric cases, representing unrealized market potential. The gap illustrates how broader health-access initiatives could unlock new volumes for the orthopedic splints market.
Availability of Functional Braces & Walking Boots
For stable fractures, clinicians increasingly prescribe controlled-motion braces or walking boots. Pediatric centers boosted non-cast toddler fracture treatment from 45.6% to 90% after quality initiatives. New HCPCS codes for dynamic adjustable joint stretching devices further normalize brace-based care. These substitutes often command higher reimbursement but divert cases away from traditional splints. Suppliers counter by integrating hybrid designs that blur category lines, but near-term device substitution limits the orthopedic splints market growth corridor.
*Our forecasts treat driver/restraint impacts as directional, not additive. The impact forecasts reflect baseline growth, mix effects, and variable interactions.
Segment Analysis
By Product: Momentum Shifts Toward Custom Printing
Fiberglass splints held 45.05% of the orthopedic splints market in 2025, anchored by their low cost, broad clinical familiarity, and established reimbursement pathways. Providers value fiberglass for predictable rigidity and quick setting, making it a go-to in trauma bays. Yet 3-D printed custom splints, expanding at 10.18% CAGR, are redrawing competitive boundaries. Randomized trials document lower pain, improved satisfaction, and fewer pressure sores when additive-manufactured designs replace bulkier polymers. Hospitals experimenting with in-house printers reduce turnaround from multi-day outsource cycles to same-day fittings, raising patient throughput while trimming inventory risk.
Growth in 3-D printing ripples through accessory markets such as scanning devices, design software, and consumable filaments, creating new revenue chains for suppliers that pivot early. Hybrid items mixing printed frameworks with traditional wrap materials cater to price-sensitive buyers yet preserve customization benefits. Plaster casts, although declining, retain a foothold in austere settings where technology budgets remain tight. Overall, diversified offerings allow manufacturers to segment by acuity and price point, supporting sustained value capture across the orthopedic splints market.



By Material: Thermoplastics Target Comfort and Sustainability
Fiberglass accounted for 44.01% of the orthopedic splints market in 2025, but thermoplastics are expanding fastest at 10.05% CAGR through 2031. Remoldable at moderate heat, thermoplastic sheets let clinicians fine-tune alignment during follow-up visits, curbing revision rates. Breathability and waterproof attributes also translate into higher patient compliance, a key driver in pediatric and sports cohorts. Regulatory bodies now encourage greener healthcare, prompting providers to explore biodegradable polymer alternatives that degrade without micro-plastic residue.
Carbon-fiber composites occupy the premium tier, validated by dedicated reimbursement codes that recognize their tensile strength-to-weight advantage for ankle-foot immobilization. Unit prices exceed mainstream fiberglass by a wide margin, yet elite athletes and postoperative cases justify the premium. Plaster of Paris persists where moldability and ultra-low cost dominate buying criteria, particularly in low-resource markets. As sustainability agendas intensify, suppliers investing in recyclable resin technologies may seize an early branding advantage in the orthopedic splints market.
By Application: Spinal Care Picks Up Pace
Lower extremity injuries drove 50.84% of the orthopedic splints market size in 2025, reflecting high ankle and knee trauma totals from sports and occupational mishaps. Emergency departments routinely stock multiple form factors to address sprains, fractures, and ligament tears. However, spinal splinting is set to grow fastest at 10.22% CAGR as vertebral fracture incidence rises with aging demographics. Non-operative protocols increasingly favor thoracolumbar orthoses to stabilize compression fractures, limiting kyphotic progression and mitigating postoperative risk.
Upper extremity splits maintain steady cadence, capturing repeat business from manual labor and contact-sport populations. Hand-based devices attract interest from industrial employers seeking rapid return-to-work solutions. Neck and shoulder splints dovetail with the surge in office-related musculoskeletal complaints, broadening outpatient penetration. Hip stabilization remains a specialized niche, yet longer life expectancy plus active senior lifestyles create scope for targeted innovations, further lifting overall momentum in the orthopedic splints market.
By End User: Clinics Rise, Hospitals Hold Ground
Hospitals retained 48.35% revenue share in 2025, fueled by 24-hour trauma cover and bundled care pathways that funnel acute fractures into emergency bays. Nonetheless, orthopedic clinics will post the highest 10.28% CAGR through 2031 as payers nudge procedures toward lower-cost sites and surgeons seek ownership stakes in ambulatory facilities. Specialized clinic settings streamline patient flow, support rapid 3-D scanning, and provide tailored rehabilitation services under one roof.
Home healthcare adoption accelerates behind tele-rehab platforms, enabling clinicians to monitor fit and compliance remotely. Equivalence studies in joint arthroplasty rehabilitation suggest similar functional scores between supervised home programs and in-person visits, encouraging insurers to reimburse remote monitoring devices stapled to splints. Sports medicine centers and occupational health units round out demand, leveraging premium splints to speed up athlete or worker reintegration. This diversified site-of-care mix cushions suppliers against policy swings and underscores the growing complexity of the orthopedic splints market.
Geography Analysis
North America commanded 41.02% share of the orthopedic splints market in 2025 thanks to advanced trauma infrastructure, high elective procedure rates, and early adoption of material and manufacturing innovation. Provider consolidation has improved purchasing power, prompting suppliers to bundle value-added services such as digitized inventory tracking and in-service training. Regulatory pilots like the Total Product Life Cycle Advisory Program for orthopedic devices aim to shorten innovation cycles but simultaneously push manufacturers to supply post-market safety data, raising compliance costs.
Asia-Pacific represents the fastest expansion corridor with a 10.44% CAGR projected to 2031. Urbanization, expanding insurance coverage, and increasing disposable income translate into higher musculoskeletal injury treatment rates. Governments in China, India, and South Korea now subsidize domestic additive-manufacturing lines, lessening import dependence and fostering region-specific product variants tailored to local anthropometry. Large patient pools allow quick scaling of production volumes, reinforcing supplier interest in localized joint ventures. Rising sports participation and traffic-related fractures further enlarge the addressable base for the orthopedic splints market.
Europe maintains moderate growth underpinned by aging demographics and universal health systems that guarantee device reimbursement. Environmental stewardship directives compel hospitals to set procurement targets for recyclable or biodegradable materials, stimulating supplier investment in green formulations. Middle East and Africa markets expand from a small base, with gulf states importing premium devices for expatriate workforces and domestic populations alike. South America shows momentum in Brazil and Argentina, where public-private healthcare partnerships improve device availability and clinician training. Collectively, geographical breadth cushions the orthopedic splints market against single-region downturns and underwrites sustained global revenues.

Regulatory Landscape
Orthopedic splints are regulated as medical devices across major markets, with classification determining premarket and quality-system obligations. In the United States, many hand, limb, and truncal orthoses fall under FDA 21 CFR Part 890 as Class I devices and are commonly exempt from 510(k) premarket notification, while still requiring baseline controls such as complaint handling and recordkeeping. An FDA final rule update (Federal Register 90 FR 55994, effective December 4, 2025) clarified exemptions and quality-system applicability for certain device categories. FDA-recognized consensus standards and labeling expectations remain relevant in procurement and tendering, especially for hospital systems that require documentation aligned to recognized standards.
In Europe, non-invasive orthopedic splints are typically categorized as Class I devices under the EU Medical Device Regulation (EU) 2017/745 (MDR) (Annex VIII, Rule 1), with manufacturers responsible for maintaining technical documentation and issuing an EU Declaration of Conformity. ISO 13485:2016 continues to serve as a cross-market quality-management baseline used for supplier qualification, and it is explicitly linked to regulatory expectations in several jurisdictions. In Canada, Health Canada ties mandatory ISO 13485 certification to Class II-IV devices, while Class I devices have fewer formal QMS certification requirements, which influences go-to-market choices for vendors selling both prefabricated splints and more complex orthotic systems.
Competitive Landscape
The orthopedic splints market features moderate fragmentation; no single vendor controls a double-digit global share across every subcategory. Multinationals such as Zimmer Biomet, Ossur, and Stryker focus on high-margin 3-D printed and carbon-fiber offerings, leveraging R-and-D scale and regulatory experience to secure early approvals. Mid-tier specialists differentiate through niche expertise; OrthoPediatrics, for instance, targets pediatric anatomies and has deepened this focus via the acquisition of Boston Orthotics & Prosthetics. Local players in China and India compete on cost and increasingly on design customization, using domestic manufacturing incentives to accelerate engineering cycles.
Strategic alliances blend digital, material, and clinical competencies. Software firms supply artificial-intelligence-driven design algorithms that shorten print-to-patient time, while material scientists collaborate on bioresorbable composites. Venture-funded start-ups pilot subscription models that ship central-lab-printed splints to remote clinics, bypassing capital investment in printers. Intellectual-property portfolios concentrate around lattice structures optimized for strength-to-weight ratio, spurring occasional infringement disputes. Despite competitive churn, switching barriers remain low, keeping buyer leverage high and reinforcing continuous innovation as the path to margin defense in the orthopedic splints market.
Regulatory shifts also shape rivalry. Expanded real-world evidence demands favor companies capable of integrating sensor-enabled splints that feed usage data to payers, supporting reimbursement renewals. Conversely, prior authorization rules for certain bracing categories slow uptake of higher-priced devices, favoring vendors with strong payer-relation teams. Sustainability mandates in Europe and select US health networks reward suppliers able to certify cradle-to-grave environmental impact reductions, adding a new vector of competition beyond clinical efficacy and cost.
Orthopedic Splints Industry Leaders
-
DeRoyal Industries, Inc.
-
Zimmer Biomet
-
Stryker
-
Dynatronics Corporation (Bird & Cronin)
-
Solventum
- *Disclaimer: Major Players sorted in no particular order

Market Opportunities and Future Outlook
Administrative and reimbursement-policy changes are creating whitespace for suppliers that can simplify ordering, documentation, and code compliance for providers shifting volume toward outpatient and clinic settings. For example, the Oregon Health Authority implemented an update effective January 2026 that standardizes use of Q4001-Q4051 billing codes for splinting materials within its Medicaid programs, while disallowing certain legacy A-codes for these materials. At the federal level, Medicare prior-authorization expansion for select orthosis HCPCS codes, implemented through contractors such as Noridian with an effective date of April 13, 2026, raises the value of product portfolios that bundle clear medical-necessity documentation, accurate coding guidance, and repeatable clinical workflows.
Customization and rapid fabrication remain a practical opportunity area, particularly where clinicians aim to reduce fitting time, pressure sores, and follow-up adjustments. Provider-led initiatives also create near-term validation pathways for differentiated designs, such as Orlando Health Jewett Orthopedic Institute launching a pilot study in February 2026 for the SafeSplint device for wrist and hand injuries using hinges and air bladders to tailor immobilization. In parallel, evolving professional guidance on in-house splinting under UK MHRA rules, including clarified interpretation from bodies such as the British Association of Hand Therapists, supports demand for compliant, traceable solutions and supplier-provided protocols, especially as clinics adopt 3D scanning and localized manufacturing models for patient-specific splints.
Recent Industry Developments
- February 2026: Stryker launched the Synchfix EVT flexible syndesmotic fixation device for ankle stabilization, including an indication that covers adolescent patients. The launch expands options for managing ankle instability and broadens addressable use cases in sports and trauma pathways where immobilization and adjacent fixation choices are tightly linked.
- November 2025: DeRoyal Industries, Inc. announced a distribution agreement alongside Therapeutic Goods Administration (TGA) approval in Australia for its advanced wound care products Multidex and Sofsorb. The move strengthens DeRoyal's commercial footprint and channel access in a regulated market where hospital purchasing often favors suppliers with broader, approved portfolios across adjacent care episodes.
- August 2024: Stryker expanded its foot and ankle portfolio with additional specialized offerings aimed at addressing complex procedures. Portfolio expansion in extremities supports bundled selling into orthopedic service lines where splints, braces, and perioperative products are evaluated together for standardization.


Research Methodology Framework and Report Scope
Market Definition and Coverage
This market covers revenue from orthopedic splints that are used to immobilize, support, or protect an injured body part during acute care, post-injury recovery, or post-operative stabilization, across institutional and outpatient care settings.
Scope exclusions: For consistency, we exclude rigid orthopedic braces and supports that are mainly positioning or compression devices rather than immobilizing splints, and we also exclude casts and casting materials.
Segmentation Overview
-
By Product
- Fiberglass Splints
- Plaster Splints
- Thermoplastic Splints
- 3-D Printed Custom Splints
- Splinting Tools & Accessories
- Other Products
-
By Material
- Fiberglass
- Plaster of Paris
- Thermoplastics
- Carbon-Fiber Composites
- Others
-
By Application
-
Lower Extremity
- Ankle & Foot
- Hip
- Knee
-
Upper Extremity
- Elbow
- Hand & Wrist
- Neck
- Shoulder
- Spinal
-
Lower Extremity
-
By End-user
- Hospitals
- Ambulatory Surgical Centers
- Orthopedic Clinics
- Others
-
By Geography
-
North America
- United States
- Canada
- Mexico
-
Europe
- Germany
- United Kingdom
- France
- Italy
- Spain
- Rest of Europe
-
Asia-Pacific
- China
- Japan
- India
- Australia
- South Korea
- Rest of Asia-Pacific
-
Middle East and Africa
- GCC
- South Africa
- Rest of Middle East and Africa
-
South America
- Brazil
- Argentina
- Rest of South America
-
North America
Data Sources, Market Sizing, and Validation
Desk Research
Desk work started by mapping how splints are categorized and purchased across care settings, and then aligning that with public data series that signal treatment volumes. We used sources such as the US CDC (injury and emergency visit indicators), the US Census Bureau and BEA (health spending and macro indicators), OECD health statistics (care utilization and payer mix signals), and WHO population and aging indicators to anchor demand-side context.
To calibrate pricing logic and channel patterns, we also reviewed company filings, investor decks, product catalogs, association websites, and reputable press coverage tied to orthopedic care pathways. We then used paid subscriptions for company financials and intelligence, news and financials, and patent databases to identify product refresh cycles and to sanity-check supply-side exposure by geography. The sources mentioned above are illustrative and not exhaustive, and many other references were used for data collection, validation, and clarification.
Primary Interviews and Surveys
Primary interviews and surveys were used to confirm what gets counted as a splint in day-to-day purchasing, and to pressure-test price ranges and replacement patterns by setting of care. We spoke with a mix of manufacturers, distributors, and clinical stakeholders, including orthopedic clinicians and procurement staff, with coverage across the Americas, EMEA, and APAC so regional practice differences could be captured and then reflected in assumptions.
Distribution of primary research fieldwork respondents
| Company type | Respondent position | Region |
|---|---|---|
| Top tier: 28% | CXOs: 20% | APAC: 41% |
| Mid tier: 52% | Functional/Unit leaders: 22% | EMEA: 36% |
| Smaller Players: 20% | Managers: 58% | Americas: 23% |
Market-Sizing & Forecasting
The core sizing starts with a top-down build that reconstructs demand from treated injury and orthopedic care volumes, which are then translated into splint utilization rates by care setting and body site. We then corroborate totals using selective bottom-up approximations, mainly through sampled product-level price points multiplied by estimated unit volumes from channel checks, and through supplier revenue exposure checks where disclosures allow.
Key inputs used in the model include emergency and outpatient visit trends linked to sprains, fractures, and soft tissue injuries, the share of cases treated with immobilization versus alternative supports, average selling prices by common splint formats, the split of purchases between hospitals and outpatient clinics, and regional demographic trends such as aging that influence orthopedic incidence. For forecasting, scenario analysis was applied around injury volumes, outpatient shift, and price progression, and the scenarios were reviewed against what interviewees expect for clinical practice and procurement behavior. Where bottom-up visibility is weak, gaps are handled by using conservative ranges for utilization and pricing, and then tightening those ranges through expert reconfirmation before finalizing regional rollups.
Data Validation & Update Cycle
Outputs are checked against independent signals like injury incidence direction, healthcare utilization trends, and known shifts in care settings, and any large variances are investigated before sign-off. A second analyst reviews the core assumptions, the arithmetic, and the year-over-year movements, and then questions that do not reconcile are taken back to sources for clarification.
The report is refreshed annually, and interim updates are made when material events change the market story, such as major regulatory moves, reimbursement changes, or sudden demand shocks. Before delivery, a fresh pass is done to confirm that recent public updates and expert views are reflected in the final numbers and narrative.
Mordor Intelligence's Orthopedic Splints Market Sizing Compared With Other Published Estimates
It is common to see different market values published for orthopedic splints, even when the topic name looks the same. The spread usually comes from how each study defines the device set, which year is treated as the base, and how pricing and utilization assumptions are converted into revenue.
Some published figures fold casts and casting supplies into the splints number, and a few also treat certain brace-only supports as part of immobilization. For Mordor Intelligence, only splints used for immobilization or stabilization are counted, and casts and brace-only supports sit outside scope, which changes the total and the growth path.
Benchmark comparison
| Source | Market Size | Gaps in Research Methodology |
|---|---|---|
| Mordor Intelligence | USD 1.85 B (2026) | |
| Global Publisher A | USD 2.60 B (2026) | Often presented with a wider device set that can include casting and splinting together, and the pricing mix can skew upward if the split between hospital and outpatient purchasing is not explicitly modeled. |
| Global Publisher B | USD 2.30 B (2025) | Uses a different base year and may apply faster growth assumptions tied to broad injury trends, without consistently separating immobilization splints from adjacent orthopedic supports across regions. |
Looking at the table, most of the variance can be traced back to what products are included, the base-year timing, and how average selling prices are moved forward each year. By keeping the build tied to treated orthopedic volumes, clear utilization rates, and setting-sensitive pricing, the final value stays traceable to inputs that can be rechecked and updated in a repeatable way.


Key Questions Answered in the Report
What is the current value of the orthopedic splints market?
The orthopedic splints market size stood at USD 1.85 billion in 2026 and is projected to reach USD 2.91 billion by 2031.
Which product type dominates global sales?
Fiberglass splints led the market with 45.05% share in 2025, benefiting from low cost and broad clinical familiarity.
Which region is expanding fastest?
Asia-Pacific is forecast to grow at a 10.44% CAGR through 2031 as insurance coverage broadens and injury incidence climbs.
How are 3-D printed splints influencing growth?
3-D printed custom splints deliver superior patient comfort and shorter lead times, driving a 10.18% CAGR and reshaping competitive dynamics.
Why are thermoplastic materials gaining traction?
Thermoplastics allow remolding during follow-up, improve breathability, and support waterproof designs, factors contributing to their 10.05% CAGR.
What restrains market expansion despite strong demand?
Substitution by functional braces and persistent care-access gaps for minor injuries limit near-term adoption in certain patient groups.
Page last updated on:


 Your data is secure and never sold or shared.



