Next-generation Sequencing (NGS) Market Size and Share
Market Overview
| Study Period | 2020 - 2031 |
|---|---|
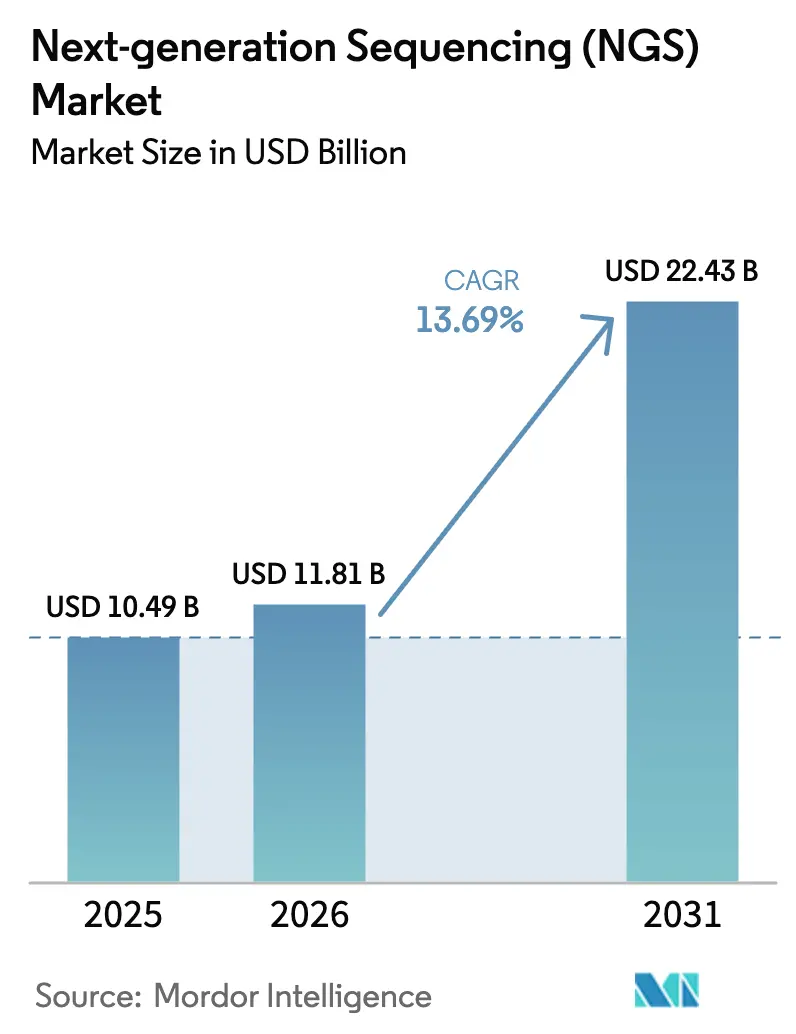
| Market Size (2026) | USD 11.81 Billion |
| Market Size (2031) | USD 22.43 Billion |
| Growth Rate (2026 - 2031) | 13.69% CAGR |
| Fastest Growing Market | Asia-Pacific |
| Largest Market | North America |
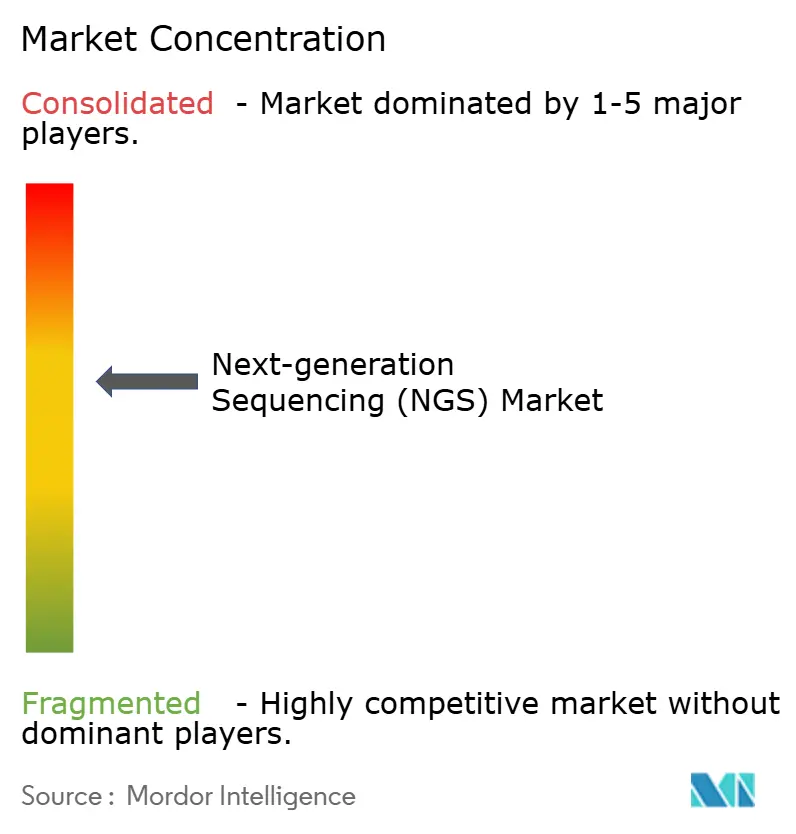
| Market Concentration | Medium |
Major Players *Disclaimer: Major Players sorted in no particular order Image © Mordor Intelligence. Reuse requires attribution under CC BY 4.0. | |
Next-generation Sequencing (NGS) Market Analysis by Mordor Intelligence
The Next-generation Sequencing Market size is projected to be USD 10.49 billion in 2025, USD 11.81 billion in 2026, and reach USD 22.43 billion by 2031, growing at a CAGR of 13.69% from 2026 to 2031.
Rising demand for sovereign genomic infrastructure, on-cartridge workflows that shorten turnaround times, and national carbon-neutral procurement policies are reshaping purchasing priorities across research, clinical, and public-health settings. Precision-medicine mandates are accelerating the routine use of companion diagnostics. At the same time, export controls on semiconductor components and reagent precursors expose supply-chain dependencies now classified as strategic vulnerabilities by several governments. Biobanks funded by public agencies are embedding carbon accounting into vendor evaluations, prompting suppliers to disclose energy footprints per terabase. Meanwhile, open-chemistry instruments that decouple consumables and hardware purchases are drawing customers away from proprietary ecosystems, intensifying competition, and compressing reagent margins.
Key Report Takeaways
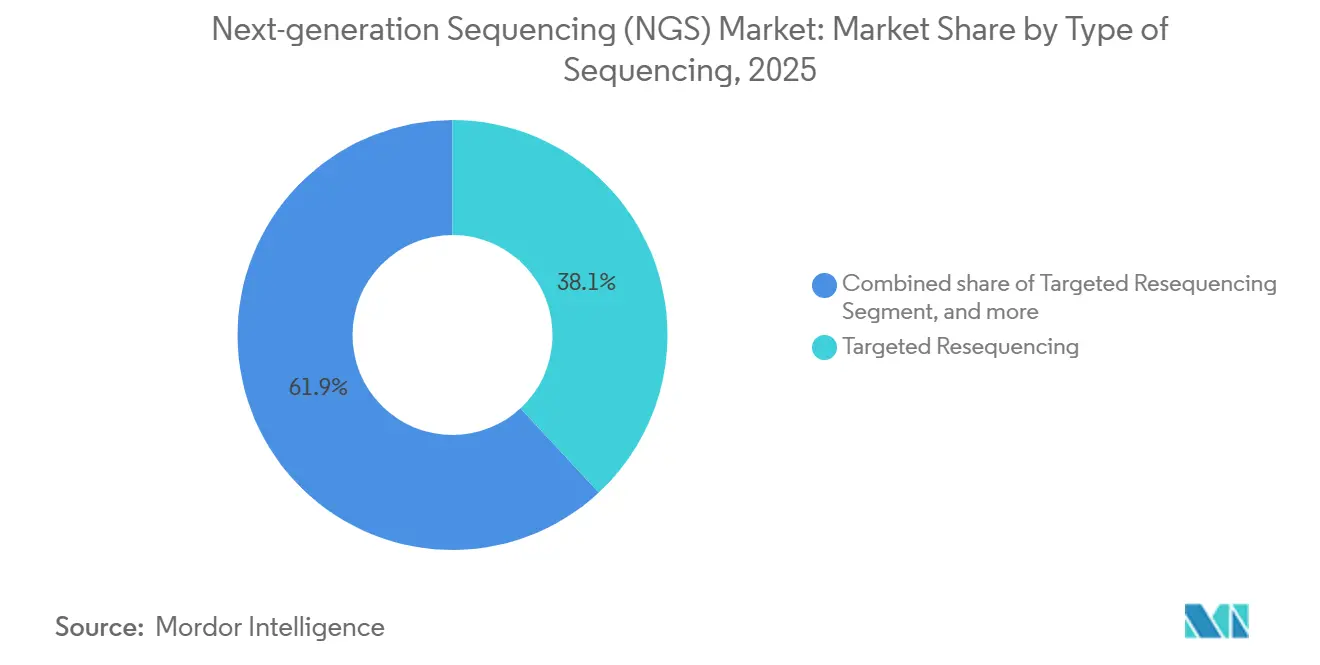
- By type of sequencing, targeted resequencing led the next-generation sequencing market with a 38.09% share in 2025. Whole exome sequencing is forecast to expand at a 14.23% CAGR through 2031, the fastest among sequencing types.
- By product, reagents and consumables accounted for 69.88% share of the next-generation sequencing market size in 2025. Instruments are projected to grow at a 14.39% CAGR between 2026 and 2031, outpacing all other product categories.
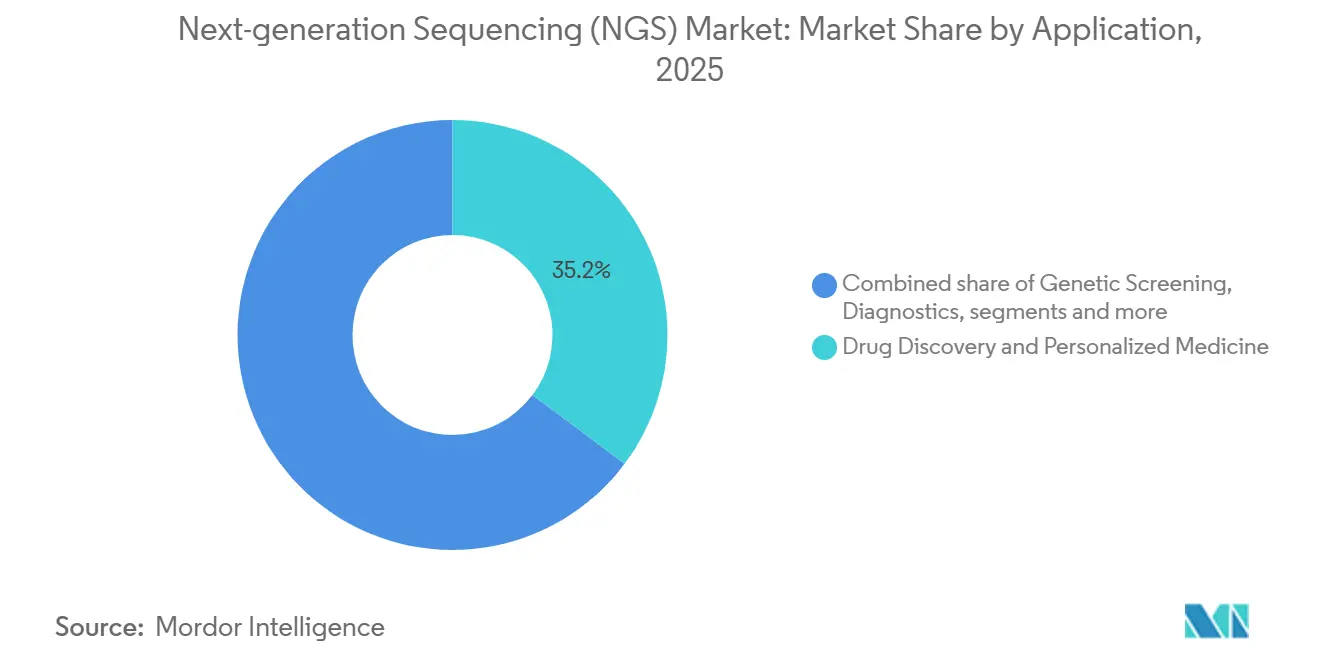
- By application, drug discovery and personalized medicine accounted for a 35.23% revenue share in 2025. Genetic screening is advancing at a 14.33% CAGR through 2031, the highest among applications.
- By end user, academics accounted for 48.44% of spending in 2025 and are sustaining an annual growth rate of 13.98%.
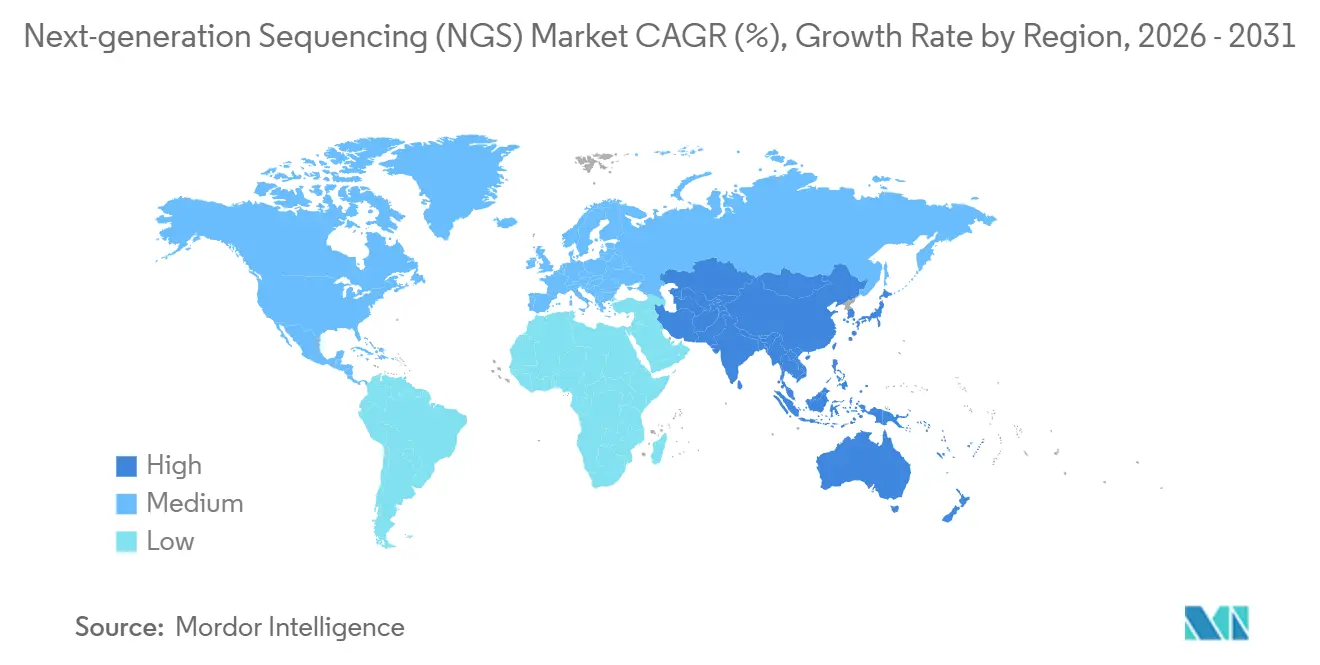
- By geography, North America accounted for 41.9% of revenue in 2025, while the Asia-Pacific region is expected to register a 14.21% CAGR from 2026 to 2031.
Note: Market size and forecast figures in this report are generated using Mordor Intelligence’s proprietary estimation framework, updated with the latest available data and insights as of January 2026.
Global Next-generation Sequencing (NGS) Market Trends and Insights
Drivers Impact Analysis
| Driver | (~) % Impact on CAGR Forecast | Geographic Relevance | Impact Timeline |
|---|---|---|---|
| Accelerating adoption of precision medicine and companion diagnostics | +3.2% | Global, led by North America and Europe | Medium term (2-4 years) |
| Continuous decline in cost per genome and throughput gains | +2.8% | Global, notably Asia-Pacific and Latin America | Short term (≤ 2 years) |
| Expansion of population-scale genomics programs | +2.4% | APAC core; spill-over to Middle East | Long term (≥ 4 years) |
| On-cartridge sequencing workflows for point-of-care testing | +1.9% | North America, Europe, urban APAC | Medium term (2-4 years) |
| Sovereign genomic data centers demanding localized NGS capacity | +1.6% | China, India, UAE, Saudi Arabia, Brazil | Long term (≥ 4 years) |
| Carbon-neutral sequencing initiatives influencing procurement | +0.9% | Europe and North America | Long term (≥ 4 years) |
| Source: Mordor Intelligence | |||
Accelerating Adoption of Precision Medicine and Companion Diagnostics
Companion diagnostics linked to targeted therapies are embedding next-generation sequencing into oncology workflows, converting the technology from a research tool to a reimbursable clinical service. The U.S. FDA granted breakthrough designation to 14 NGS-based companion tests during 2024-2025, covering solid tumors such as lung, breast, and melanoma[1]U.S. Food and Drug Administration, “Breakthrough Devices Program Updates 2025,” fda.gov. Medicare’s 2025 coverage expansion for comprehensive genomic profiling eliminated prior-authorization hurdles, boosting test volumes in hospital laboratories. Liquid-biopsy assays that detect circulating tumor DNA are being integrated into earlier treatment lines, with Guardant Health and Foundation Medicine reporting double-digit growth in requisitions in 2025. Although European approvals proceed more slowly, the European Commission’s 2024 proposal to streamline in-vitro diagnostic regulation signals faster clearance pathways after 2027. Collectively, these regulatory trends establish NGS as a clinical mainstay rather than an experimental option.
Continuous Decline in Cost Per Genome and Throughput Gains
Whole-genome sequencing costs fell below USD 500 in 2025 on high-throughput instruments, making population screening economically feasible for public health systems. Ultima Genomics validated a USD 100 genome in peer-reviewed studies during 2024, forcing incumbents to unbundle reagent pricing and rethink revenue models. Illumina’s NovaSeq X delivers 16 terabases per run, enabling laboratories to process thousands of samples weekly. Element Biosciences’ semiconductor-based AVITI platform reduces reagent consumption by 30%, translating cost savings directly to users. These efficiencies are accelerating adoption in middle-income countries that previously considered whole-genome sequencing too expensive for routine diagnostics.
Expansion of Population-Scale Genomics Programs
China, Japan, India, and the United Kingdom each target cohorts exceeding 1 million genomes. China’s Shenzhen National Gene Bank sequenced 800,000 genomes by mid-2025, emphasizing Han ancestry variant databases. Japan’s All Japan Genomic Medicine Program mandates domestic data residency, favoring on-premise sequencing over cloud-only solutions. India’s Genome India Project completed 10,000 genomes across 99 ethnic groups in 2024 and plans to reach 100,000 by 2028. These initiatives consolidate purchasing through national tenders, rewarding suppliers that offer technology transfer and local manufacturing partnerships.
On-Cartridge Sequencing Workflows for Point-of-Care Testing
Integrated cartridges that combine library preparation, amplification, and detection reduce turnaround times from days to hours. Oxford Nanopore’s VolTRAX automates sample-to-sequence workflows for infectious-disease panels. Roche demonstrated a prototype sepsis panel in 2025 that targets emergency departments where empiric antibiotic therapy often precedes culture confirmation. Regulatory uncertainty under CLIA creates approval ambiguity, yet the prospect of same-visit genomic results addresses transport delays that degrade RNA quality in centralized testing.
Restraints Impact Analysis
| Restraint | (~) % Impact on CAGR Forecast | Geographic Relevance | Impact Timeline |
|---|---|---|---|
| Fragmented global regulatory landscape for clinical NGS | −1.8% | North America, Europe, APAC | Medium term (2-4 years) |
| High capital outlay for long-read and spatial platforms | −1.4% | Global, especially academic labs | Short term (≤ 2 years) |
| Consumable supply-chain vulnerabilities post-export controls | −1.1% | APAC and Middle East | Short term (≤ 2 years) |
| Algorithmic bias in AI-based variant calling and liability risks | −0.7% | North America and Europe | Medium term (2-4 years) |
| Source: Mordor Intelligence | |||
Fragmented Global Regulatory Landscape for Clinical NGS
Divergent approval pathways across the FDA, EU IVDR, and APAC agencies necessitate region-specific validations, which increase time-to-market and costs. The FDA’s 2024 draft on laboratory-developed tests adds oversight that academic medical centers argue may curb innovation[2]U.S. Food and Drug Administration, “Proposed Rule on Laboratory Developed Tests,” fda.gov. Europe’s IVDR extensions to 2027 leave hundreds of assays in limbo, while China’s regulators demand domestic clinical trials, lengthening launches by up to 24 months. Japan’s conditional approval pathway introduced in 2025 still lacks precise post-market requirements, discouraging smaller firms. Maintaining multiple assay versions dilutes economies of scale and favors companies with deep regulatory resources.
High Capital Outlay for Long-Read & Spatial Platforms
Long-read sequencers, such as PacBio’s Sequel IIe, carry price tags ranging from USD 150,000 to USD 350,000, levels that exceed the capital budgets of most hospital laboratories. Spatial transcriptomics platforms, such as 10x Genomics’ Xenium and NanoString’s CosMx, add an additional USD 250,000–500,000 in hardware costs and require specialized histology staff. Consumables priced at USD 800–1,200 per sample restrict routine use to pharmaceutical R&D and a handful of reference centers. Leasing or reagent-rental schemes shift upfront costs to operating expenses but do not resolve staffing shortages or workflow complexity, so adoption remains confined to well-funded institutes.
Segment Analysis
By Type of Sequencing: Clinical Exomes Outpace Targeted Panels
Whole-exome sequencing is projected to grow at a 14.23% CAGR to 2031 as insurers adopt it for rare-disease diagnostics, redirecting budgets from single-gene tests to comprehensive panels. Targeted resequencing held 38.09% of the next-generation sequencing market share in 2025, driven by oncology panels, yet falling exome costs below USD 200 per sample erode its price advantage. Whole-genome sequencing remains the benchmark for structural variants, although the 30-fold increase in data volume strains hospital IT resources. RNA sequencing is gaining traction in immuno-oncology, and spatial transcriptomics reached USD 180 million in sales in 2025.
The next-generation sequencing market is witnessing rare-disease pathways transition from research to reimbursed care, validating exome tests as first-tier diagnostics. The FDA's approval of the first exome-based neurodevelopmental test in 2025 solidified this transition. Vendors offering turnkey analysis pipelines are gaining favor over those selling raw capacity alone, as community hospitals seek simplicity in bioinformatics.


By Product Type: Instruments Gain as Automation Reduces Dependency
Reagents and consumables captured 69.88% of the next-generation sequencing market size in 2025, but instruments will outpace at 14.39% CAGR through 2031. Benchtop systems that integrate sample prep cut hands-on time and lower point-of-care adoption barriers. Element Biosciences and Singular Genomics employ open-reagent designs that undercut proprietary razor-and-blade models. Illumina’s 2025 reagent-neutral mode acknowledges growing demand for interoperability.
Services, although the smallest segment, are expanding as pharmaceutical sponsors outsource large-scale sequencing to high-throughput centers. Automation platforms from Tecan and Hamilton reduce reagent waste, compressing consumable revenue growth. The shift toward open chemistry compresses margins while broadening the user base, especially among resource-constrained academic institutions.
By Application: Genetic Screening Surges on Newborn Mandates
Drug discovery and personalized medicine accounted for 35.23% of 2025 revenue, but genetic screening is expected to grow at the fastest rate of 14.33% CAGR as governments expand newborn screening panels. The U.K. National Health Service plans to pilot whole-genome sequencing for all newborns in 2025, potentially scaling up to 700,000 infants annually. Japan approved NGS-based spinal muscular atrophy screening in 2024, prompting prefectures to budget for sequencing infrastructure.
Agriculture and animal genomics, although smaller, saw USD 120 million in sequencing spend in 2025 as breeders adopt genomic selection. Multi-omics workflows that merge DNA, RNA, and epigenetic data are becoming feasible on unified platforms, expanding target users beyond traditional molecular labs.
By End User: Academics Sustain Dominance Through Sovereign Funding
Academic institutions accounted for 48.44% of spending in 2025 and are expected to continue growing at 13.98% as national genomics programs route funds through universities. The U.S. NIH allocated USD 290 million in 2025 to the All of Us Program, with sequencing contracts awarded to academic medical centers. China directed USD 180 million toward university-based genomics hubs during 2024-2025.
Hospitals remain the second-largest segment, driven by tumor profiling and inherited-disease testing, yet constrained by limited bioinformatics staff. Pharmaceutical and biotechnology firms spend more per customer but represent a smaller number of accounts. Sequencing-as-a-service offerings target hospitals that lack in-house capacity, while academic users demand open-source tools and data interoperability.
Geography Analysis
North America contributed 41.90% of 2025 revenue, supported by Medicare coverage for comprehensive genomic profiling and the FDA’s expedited approval pathway for companion diagnostics. Canada invested CAD 45 million (approximately USD 33 million) in pediatric rare-disease sequencing in 2025, while Mexico expanded its pharmacogenomic capacity. However, reimbursement remains a challenge to addressing research-oriented workforce shortages in genetic counseling and bioinformatics, tempering growth.
Asia-Pacific is forecast to expand at a 14.21% CAGR, the highest globally. China’s 14th Five-Year Plan earmarked USD 1.2 billion for genomic infrastructure through 2027, and the Shenzhen National Gene Bank surpassed 800,000 genomes by mid-2025. Japan mandates domestic data residency, channeling instrument sales to local facilities, while India plans to reach 100,000 sequenced genomes by 2028. Australia and South Korea advanced reimbursement policies for hereditary disease sequencing in 2024-2025, further fueling regional demand.
Europe’s growth is moderated by IVDR transition delays, which have placed hundreds of lab-developed tests in regulatory limbo through 2025. Germany expanded statutory insurance coverage for tumor profiling in 2024, adding 80,000 tests annually, yet reimbursement rates remain below cost recovery. The U.K. Genomic Medicine Service completed 100,000 whole genomes in 2025 and plans to double by 2027[3]NHS England, “Genomic Medicine Service Progress Report 2025,” england.nhs.uk. France’s national plan committed EUR 670 million (USD 730 million) to 12 regional platforms, though procurement delays pushed installations into late 2025.
The Middle East and Latin America trail in absolute volumes but register rapid project-based uptake. Saudi Arabia’s Genome Program and the UAE’s data-sovereignty rules incentivize local capacity. Brazil piloted NGS-based TB drug-resistance testing in 2024, demonstrating potential public health applications if funding remains stable.

Competitive Landscape
Illumina retains roughly 60% of global instrument placements. Yet, open-chemistry challengers such as Element Biosciences, Singular Genomics, and Ultima Genomics are eroding this lead with lower capital costs and interoperable consumables. Oxford Nanopore’s portable devices address field epidemiology, while PacBio dominates high-fidelity long reads despite instrument prices above USD 350,000. Patent expiries in 2024-2025 enable biosimilar reagents that undercut proprietary chemistries, squeezing margins.
Incumbents bundle multi-year consumable contracts and proprietary analysis software to lock in users; however, academic consortia are increasingly rejecting ecosystem lock-in. Disruptors emphasize workflow simplification and compliance with national data-residency laws, courting sovereign genomics programs. FDA clearance remains a hurdle costing up to USD 10 million per platform, yet agency guidance released in 2024 clarifies pathways, lowering regulatory uncertainty for newcomers.
Next-generation Sequencing (NGS) Industry Leaders
Illumina Inc.
Thermo Fisher Scientific Inc.
BGI Genomics Co. Ltd.
F. Hoffmann-La Roche Ltd.
Oxford Nanopore Technologies Plc
- *Disclaimer: Major Players sorted in no particular order

Recent Industry Developments
- October 2025: Fraunhofer IGB announced that their NGS-based method for quickly and accurately identifying sepsis pathogens has received the EARTO Innovation Award in Brussels. The innovative approach uses high-throughput sequencing of cell-free DNA in blood samples. The diagnostic kit is now approved for routine sepsis detection as an IVD-certified product.
- February 2025: F. Hoffmann-La Roche Ltd announced its new sequencing by expansion (SBX) technology, creating a new category of next-generation sequencing. The SBX chemistry and innovative sensor module enable ultra-rapid, high-throughput sequencing. This technology is designed to be flexible and scalable for various applications.
- April 2024: NewBiologix SA, a tech innovation firm specializing in gene therapy manufacturing, introduced its advanced sequencing and optical mapping platform. This new suite of technologies provides comprehensive genomic analysis services for the biopharmaceutical sector. The launch aims to address critical gaps in gene therapy production.


Research Methodology Framework and Report Scope
Market Definitions and Key Coverage
Our study defines the next-generation sequencing (NGS) market as the sale of instruments, reagents, consumables, and associated services that generate massively parallel DNA or RNA reads from biological samples, regardless of read length or chemistry.
Scope Exclusion: Classical Sanger sequencing platforms, standalone microarray systems, and bioinformatic software sold without sequencing capacity are outside this scope.
Segmentation Overview
- By Type of Sequencing
- Whole Genome Sequencing
- Targeted Resequencing
- Whole Exome Sequencing
- RNA Sequencing
- ChIP Sequencing
- De Novo Sequencing
- Methyl Sequencing
- By Product Type
- Instruments
- Reagents And Consumables
- Services
- By Application
- Drug Discovery And Personalized Medicine
- Genetic Screening
- Diagnostics
- Agriculture And Animal Research
- Other Applications (Epigenomics, Metagenomics, Transcriptomics)
- By End User
- Hospitals And Healthcare Institutions
- Academics
- Pharmaceuticals And Biotechnology Companies
- Geography
- North America
- United States
- Canada
- Mexico
- Europe
- Germany
- United Kingdom
- France
- Italy
- Spain
- Rest Of Europe
- Asia-Pacific
- China
- Japan
- India
- South Korea
- Australia
- Rest Of Asia-Pacific
- Middle-East And Africa
- GCC
- South Africa
- Rest Of Middle East And Africa
- South America
- Brazil
- Argentina
- Rest Of South America
- North America
Detailed Research Methodology and Data Validation
Primary Research
We interviewed clinical geneticists, oncology lab directors, hospital procurement heads, and biotech R&D managers across North America, Europe, Asia-Pacific, and Latin America. Their inputs helped us verify real-world run volumes, reagent pull-through rates, price erosion, and the cadence at which older sequencers are replaced, letting us close gaps the literature left.
Desk Research
We began with open datasets from the World Health Organization's Global Health Observatory, the National Human Genome Research Institute cost-per-genome tracker, the US FDA device-clearance database, OECD R&D expenditure tables, and trade statistics released by UN Comtrade and Eurostat. Company 10-Ks, investor decks, peer-reviewed journals such as Nature Methods, and major conference abstracts (e.g., ASHG, ESHG) added granular shipment and adoption clues.
To size revenues, Mordor analysts tapped paid repositories, D&B Hoovers for vendor financials, Dow Jones Factiva for contract wins, Questel for patent velocity, and Marklines for downstream clinical-trial counts where sequencing is embedded. These illustrate the depth of desk evidence; many further sources supported validation but are not listed here.
Market-Sizing & Forecasting
A top-down model starts with the installed sequencer base, average runs per system, and median cost per gigabase; these figures reconstruct the 2025 demand pool. Results are cross-checked through selective bottom-up roll-ups of vendor revenue disclosures and channel checks, allowing adjustments where hospital consolidation or reagent bundling skews totals. Key variables like oncology test penetration, genome cost curve, national precision-medicine funding, clinical-trial counts using NGS, and reagent price decline drive both historical alignment and forecasts. Multivariate regression, supplemented by scenario analysis around funding shocks, projects values to 2030. Missing datapoints are bridged using regional proxies validated during expert calls.
Data Validation & Update Cycle
Triangulation, anomaly flags, and two-level analyst peer review precede sign-off. Reports refresh annually; if a material event (for example, a new $100-genome launch) moves any driver by more than 5%, our team re-runs the model so clients receive the latest view.
Why Mordor's Next Generation Sequencing Baseline Commands Reliability
Published estimates often diverge because firms mix instruments with informatics, apply different price-mix curves, or refresh on uneven cadences.
Key gap drivers include scope creep into sample-prep automation, reliance on unvalidated average selling prices, and aggressive R&D growth multipliers that our analysts moderated after stakeholder interviews.
Benchmark comparison
| Market Size | Anonymized source | Primary gap driver |
|---|---|---|
| USD 10.39 B (2025) | Mordor Intelligence | |
| USD 11.26 B (2025) | Global Consultancy A | Bundles bioinformatic software revenues and uses blended global ASPs without regional weighting |
| USD 10.44 B (2025) | Trade Journal B | Focuses on clinical sequencing only, omitting research demand that our model captures |
| USD 12.65 B (2024) | Industry Association C | Counts data-analysis services and reports in 2024 dollars without currency normalization to 2025 |
These comparisons show how Mordor's disciplined scope, variable selection, and timely refresh deliver a balanced, transparent baseline that decision-makers can trace back to clear data points.


Key Questions Answered in the Report
How large is the next-generation sequencing market in 2026?
It is valued at USD 11.81 billion, with a forecast to reach USD 22.43 billion by 2031 at a 13.69% CAGR.
Which sequencing type is growing fastest through 2031?
Whole exome sequencing is projected to expand at 14.23% CAGR as insurers reimburse it for rare-disease diagnostics.
What region is expected to record the highest growth?
Asia-Pacific is set to grow at 14.21% CAGR, propelled by national genomics hubs in China, Japan, and India.
Which product category currently dominates spending?
Reagents and consumables hold 69.88% of 2025 revenue, though instruments are now the fastest-growing category.
Why are governments investing in sovereign genomic infrastructure?
Export-control risks and data-sovereignty mandates drive nations to localize sequencing capacity and bioinformatics resources.
What is the main competitive challenge faced by incumbents?
Open-chemistry platforms that separate hardware and consumable purchases are compressing reagent margins and chipping away at legacy market share.
Page last updated on:


