Next-Generation Sequencing (NGS) Services Market Size and Share
Market Overview
| Study Period | 2020 - 2031 |
|---|---|
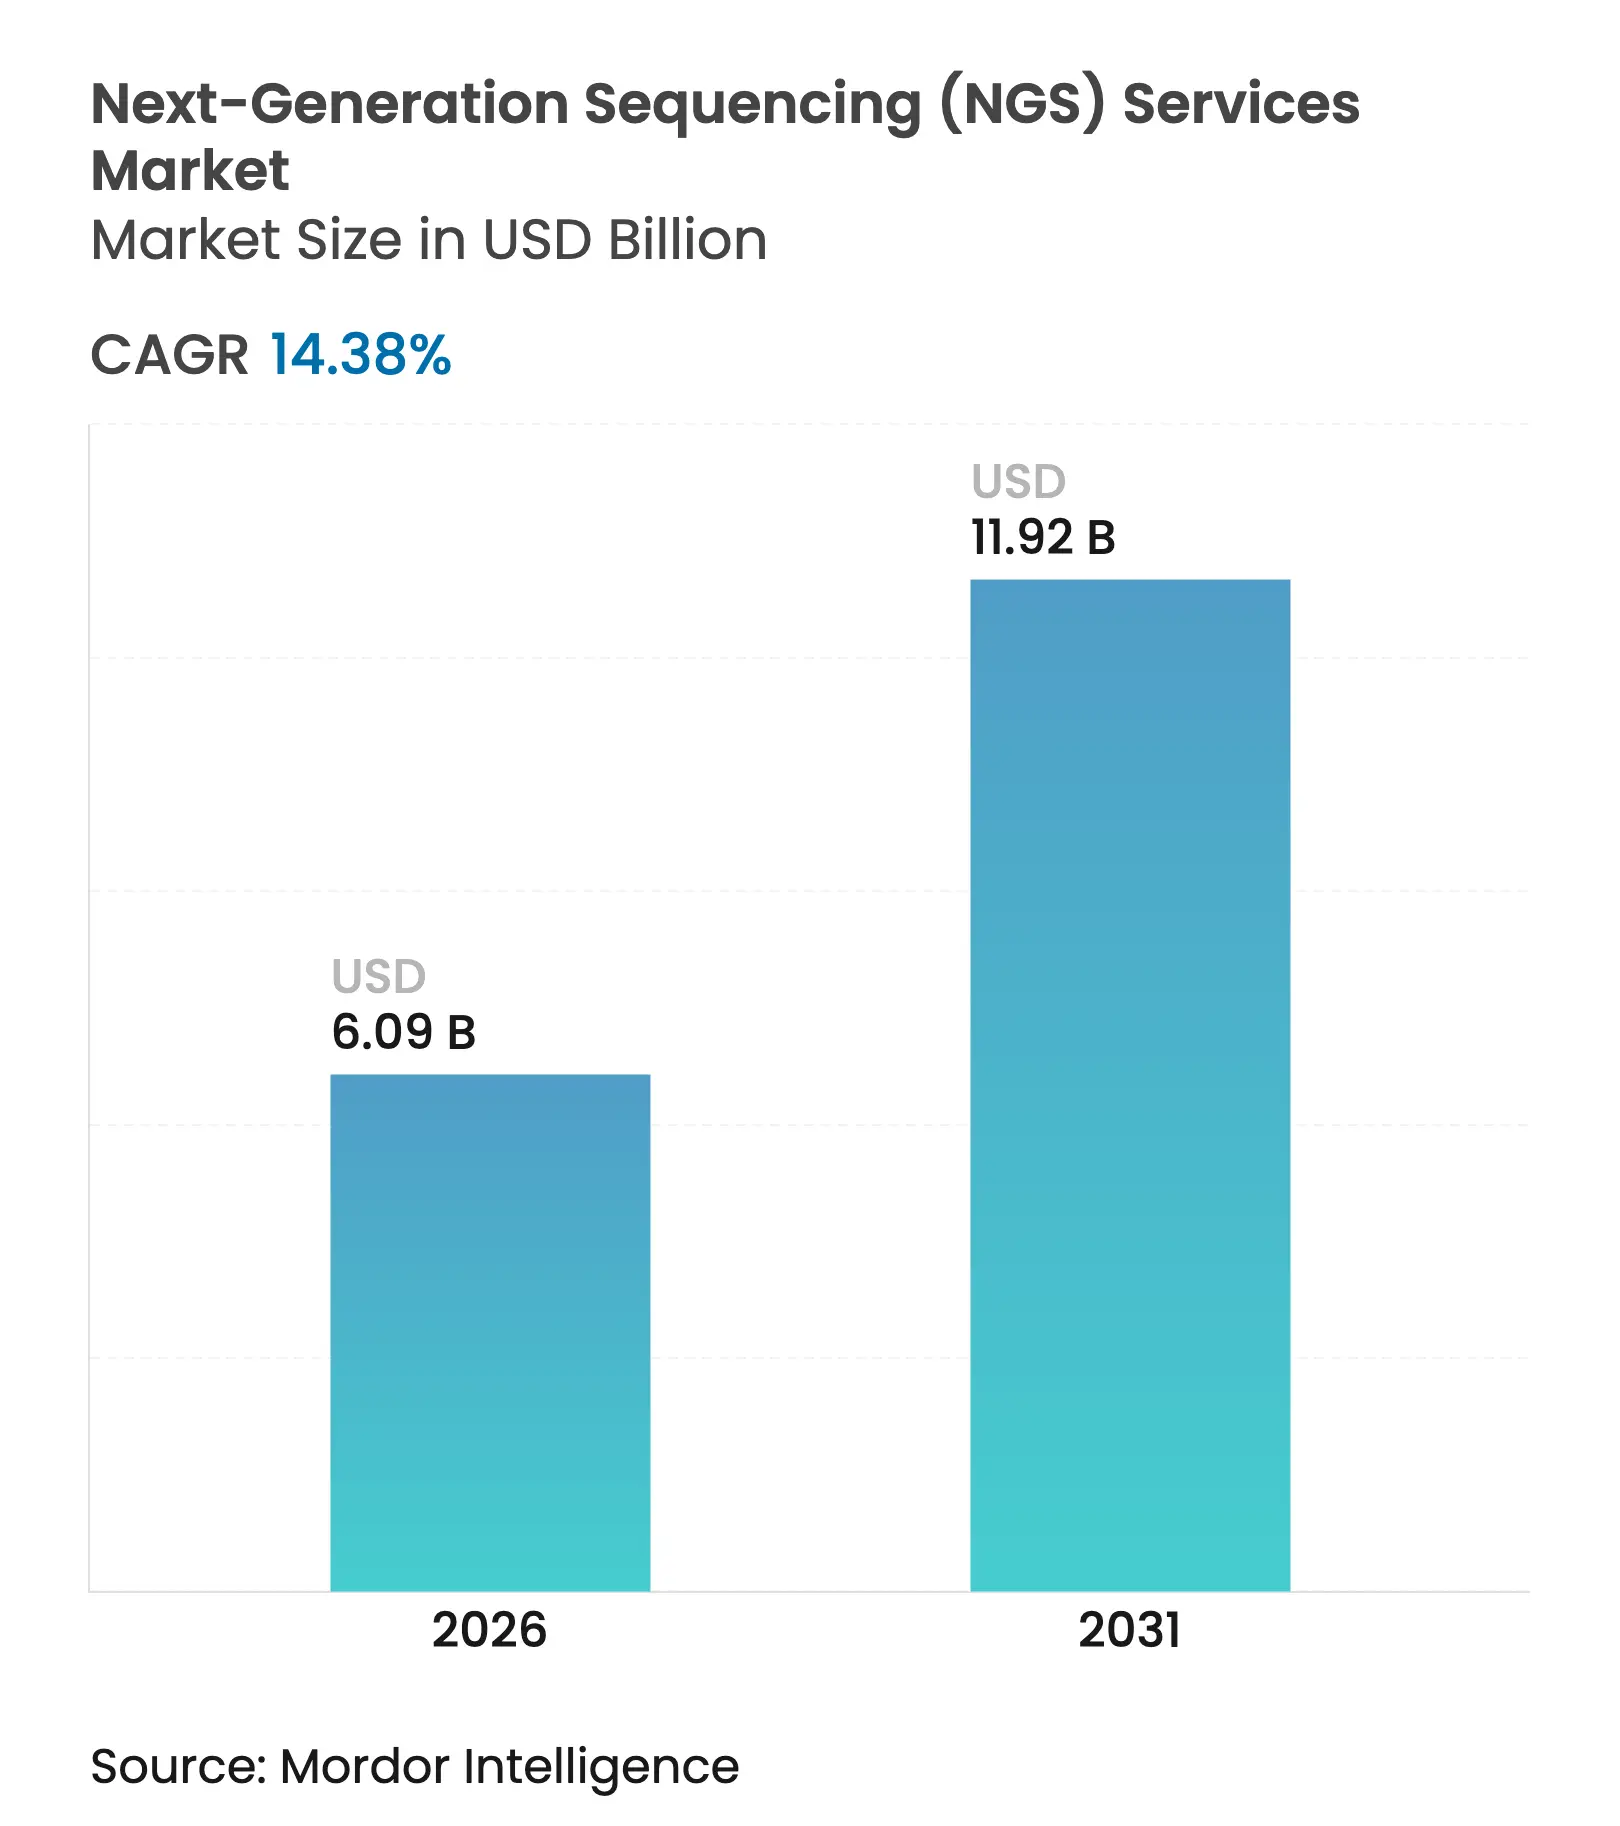
| Market Size (2026) | USD 6.09 Billion |
| Market Size (2031) | USD 11.92 Billion |
| Growth Rate (2026 - 2031) | 14.38 % CAGR |
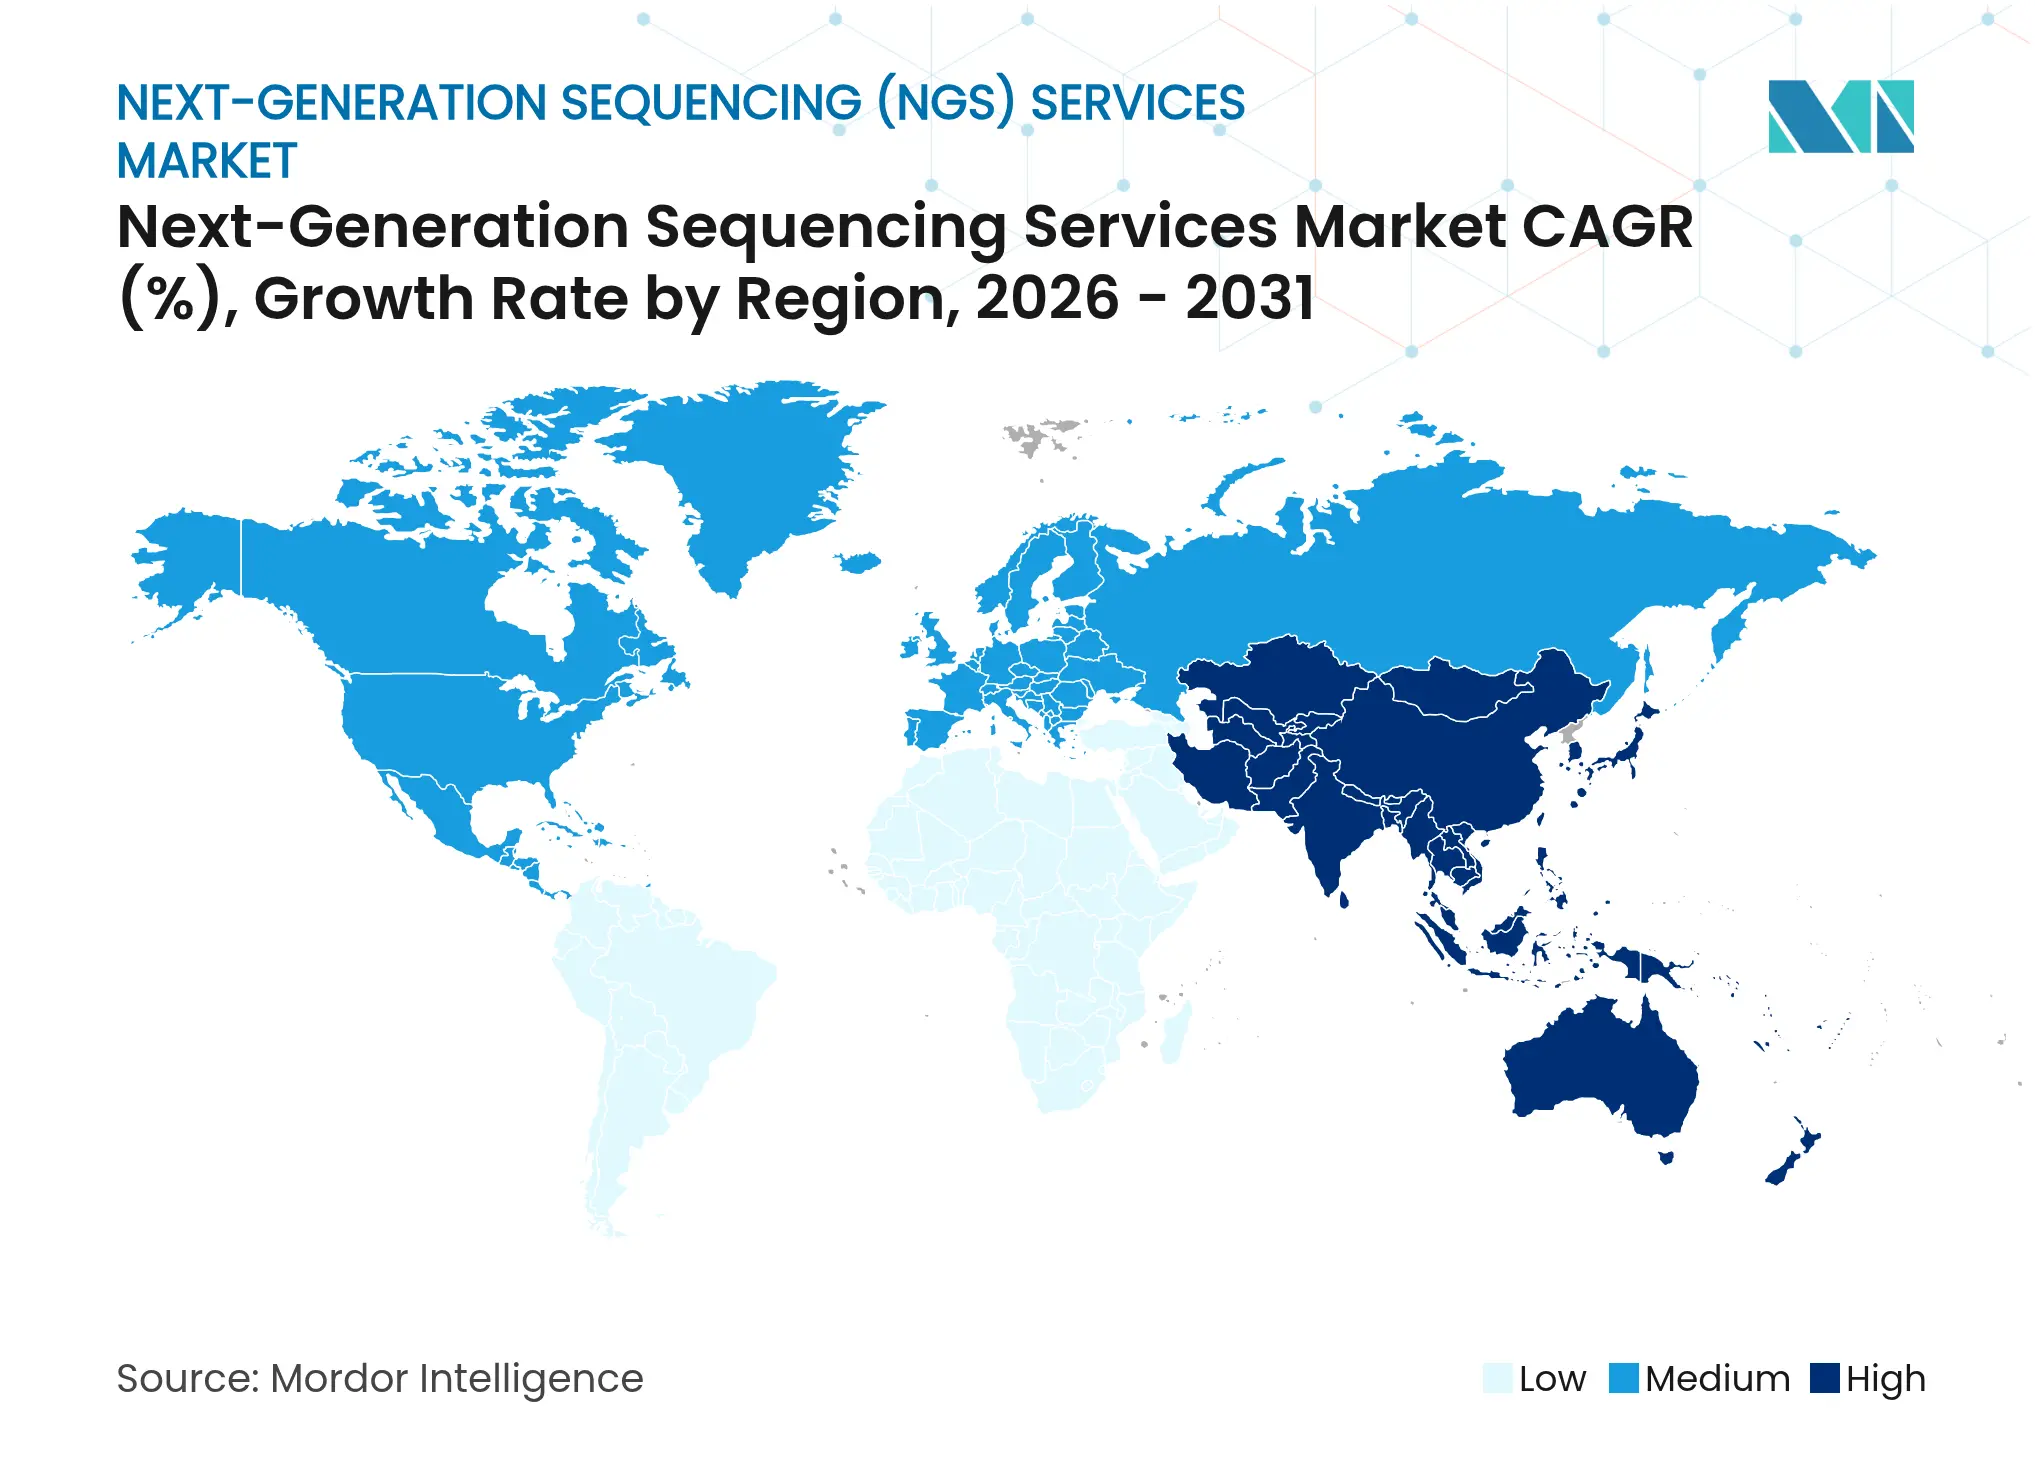
| Fastest Growing Market | Asia Pacific |
| Largest Market | North America |
| Market Concentration | Medium |
Major Players *Disclaimer: Major Players sorted in no particular order. Image © Mordor Intelligence. Reuse requires attribution under CC BY 4.0. |
Next-Generation Sequencing (NGS) Services Market Analysis by Mordor Intelligence
The next-generation sequencing services market size was valued at USD 5.32 billion in 2025 and estimated to grow from USD 6.09 billion in 2026 to reach USD 11.92 billion by 2031, at a CAGR of 14.38% during the forecast period (2026-2031). Falling per-genome costs, widening precision-medicine programs, and steady clinical adoption underpin this momentum. Illumina’s NovaSeq X has cut the cost of a whole human genome to nearly USD 200, unlocking demand from smaller laboratories and national screening initiatives[1]Illumina, “Illumina advances NovaSeq X Series, delivering single-flow-cell system, software upgrade, and new kits to enable multiomic applications,” illumina.com. Outsourcing by pharmaceutical sponsors, deeper AI integration for data analysis, and the shift from panel-based tests to comprehensive genomic profiling are also expanding the next-generation sequencing services market. Competitive intensity is rising as long-read and real-time technologies enter routine workflows, compelling incumbent providers to fold bioinformatics and multiomic capabilities into their service portfolios.
Key Report Takeaways
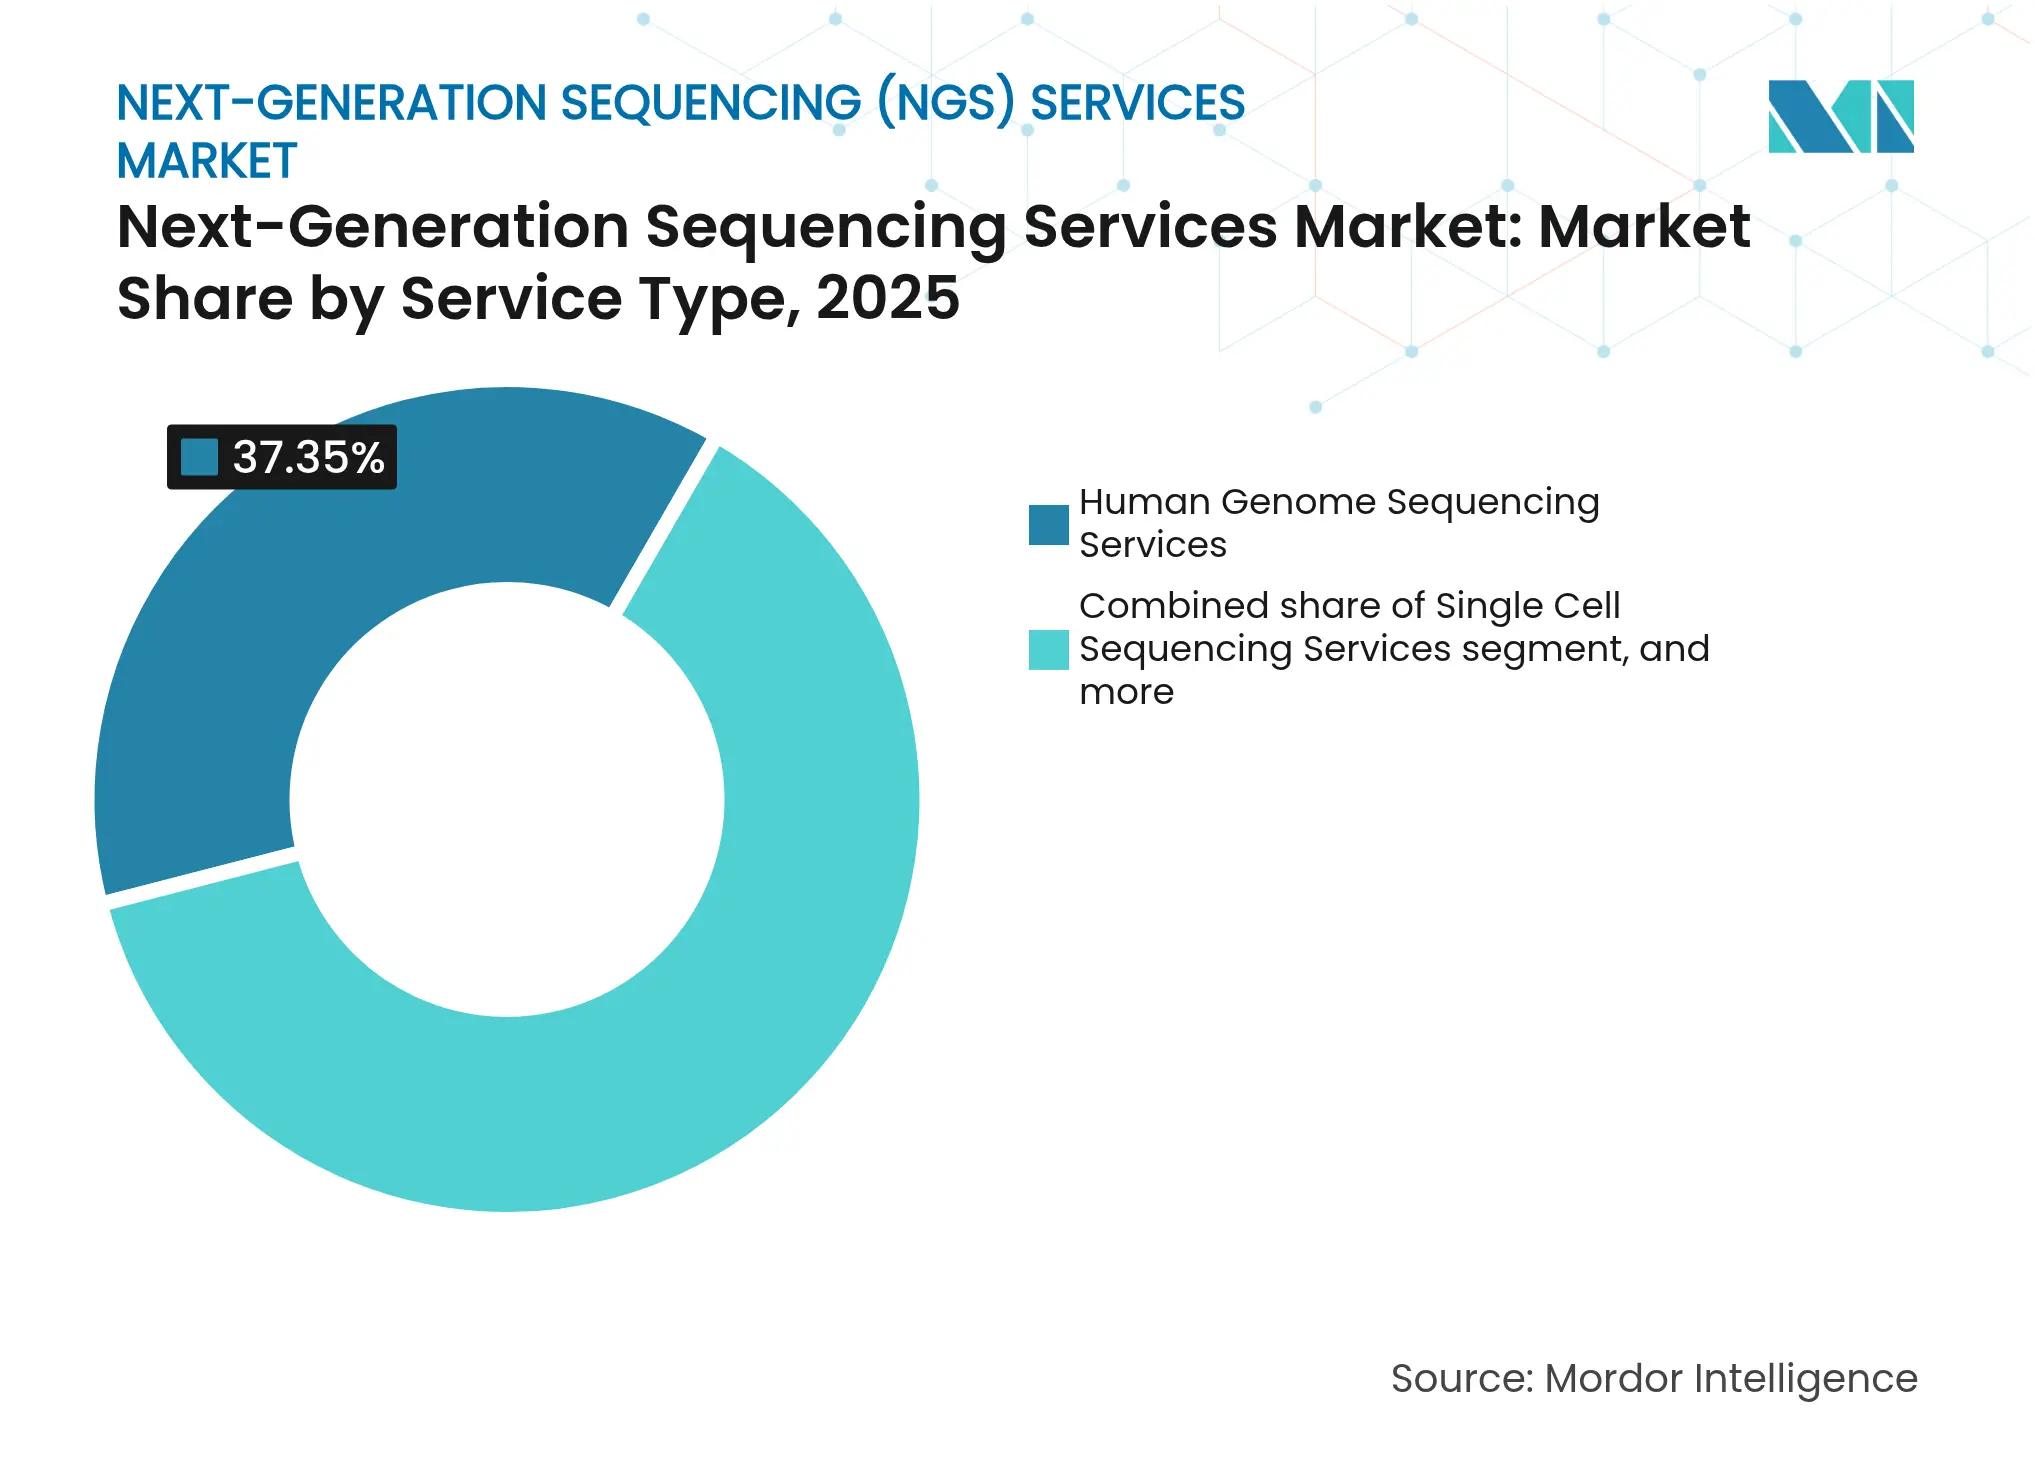
- By service type, human genome sequencing held 37.35% of next-generation sequencing services market share in 2025, while single cell sequencing is projected to rise at 16.82% CAGR through 2031.
- By technology, sequencing-by-synthesis dominated with 60.20% revenue share in 2025; nanopore sequencing is advancing at a 22.46% CAGR to 2031.
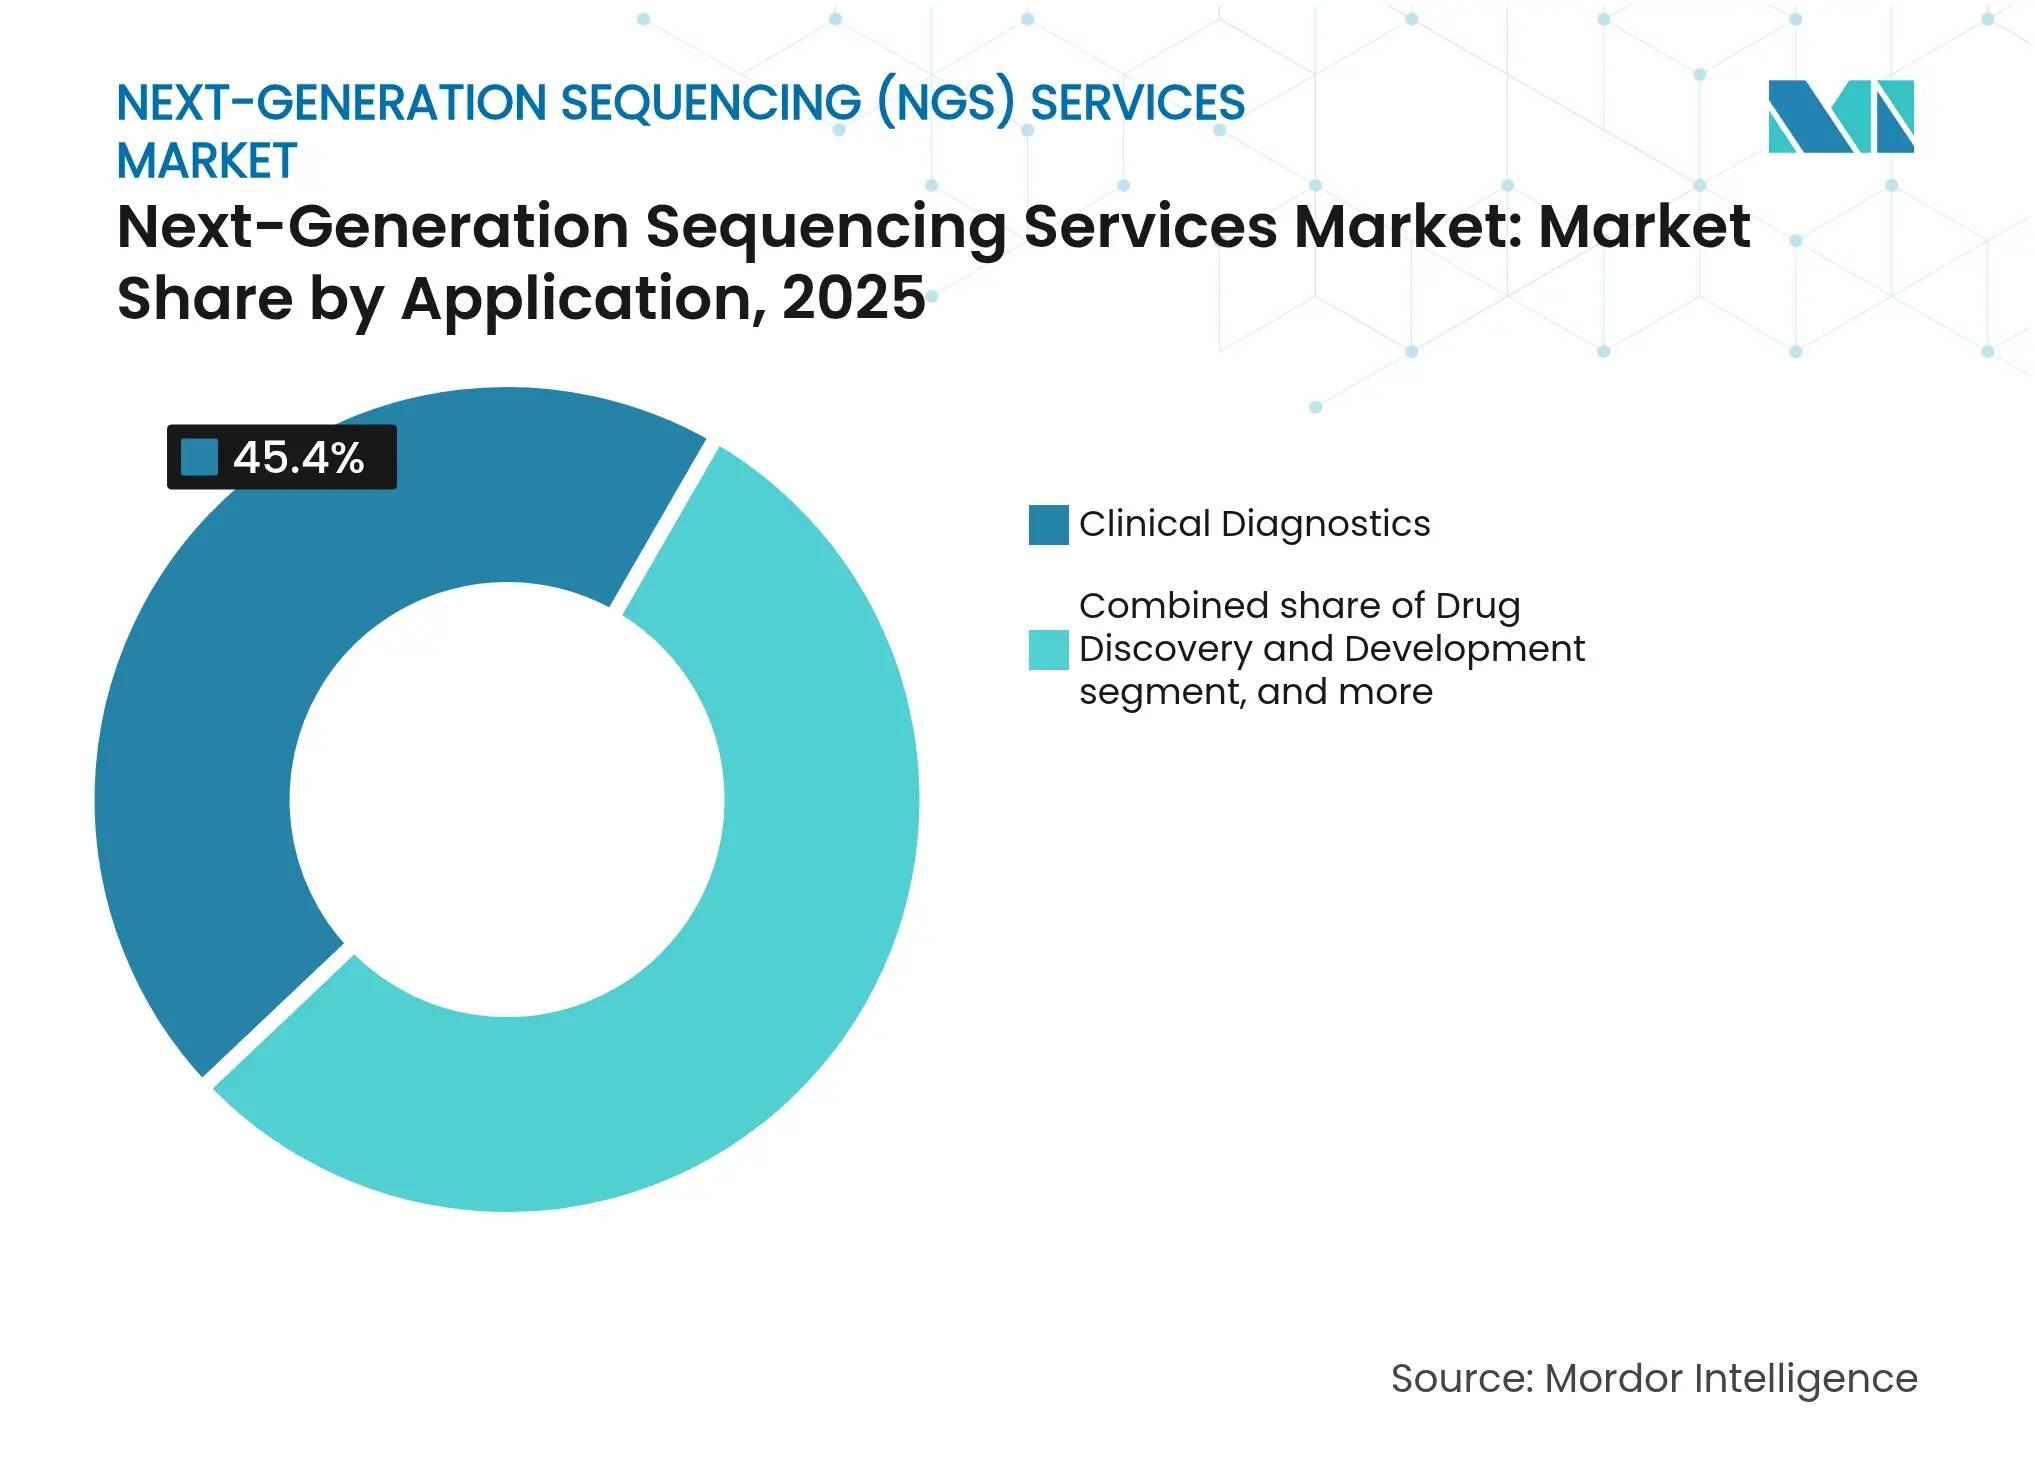
- By application, clinical diagnostics accounted for 45.40% of the next-generation sequencing services market size in 2025; drug discovery & development shows the fastest 17.10% CAGR.
- By end user, clinical diagnostic laboratories led with 33.60% share in 2025, whereas hospitals & clinics are expanding at 15.30% CAGR over 2026-2031.
- By geography, North America captured 47.40% share in 2025; Asia Pacific is forecast to post a 14.60% CAGR to 2031.
Note: Market size and forecast figures in this report are generated using Mordor Intelligence's proprietary estimation framework, updated with the latest available data and insights as of 2026.
Global Next-Generation Sequencing (NGS) Services Market Trends and Insights
Driver Impact Analysis
| Drivers Impact Analysis | (~) % Impact on CAGR Forecast | Geographic Relevance | Impact Timeline | |||
|---|---|---|---|---|---|---|
Global precision medicine programs Global precision medicine programs | +1.3% | North America, Europe, Asia Pacific | Long term (≥ 4 years) | (~) % Impact on CAGR Forecast:+1.3% | Geographic Relevance:North America, Europe, Asia Pacific | Impact Timeline:Long term (≥ 4 years) |
Per-genome cost reduction Per-genome cost reduction | +1.1% | Global | Long term (≥ 4 years) | |||
Outsourced genomic research Outsourced genomic research | +0.9% | North America, Europe | Medium term (2-4 years) | |||
Clinical diagnostics uptake Clinical diagnostics uptake | +1.4% | Global | Short term (≤ 2 years) | |||
Rising investment in population-scale genomics projects Rising investment in population-scale genomics projects | +1.2% | Global | Long term (≥ 4 years) | |||
Technological innovations enhancing sequencing throughput & accuracy Technological innovations enhancing sequencing throughput & accuracy | +1.0% | Global | Medium term (2-4 years) | |||
| Source: Mordor Intelligence | ||||||
Expansion of Precision Medicine Programs Globally
National sequencing initiatives now anchor many public-health agendas, creating durable demand funnels for the next-generation sequencing services market. The United Kingdom’s 100,000 Genomes model has inspired similar programs in Japan, China, and Saudi Arabia, each tasking commercial service providers with large sample volumes. In the United States, NIH funding to extend genomic diagnostics into underserved communities rose sharply in 2024 and 2025, supporting inclusive access to sequencing and bioinformatic interpretation. Pharmaceutical sponsors leverage these datasets for biomarker discovery, reinforcing a virtuous circle in which population studies accelerate therapeutic pipelines. Over the long term, mature reimbursement frameworks for companion diagnostics will cement clinical sequencing as a standard-of-care element, sustaining the next-generation sequencing services market.
Declining Cost per Genome Sequenced
A halving of sequencing expenditure every two to three years has broadened the customer base across research, diagnostics, and direct-to-consumer channels. NovaSeq X’s USD 200 genome and emerging sub-USD 100 prototypes have made whole-genome approaches viable for infectious-disease surveillance and neonatal testing. Population-scale cohorts now routinely exceed one million samples, increasing statistical power for rare-variant detection and feeding algorithm training pipelines. Falling input costs also flip the economics in oncology, where comprehensive genomic profiling now outranks sequential single-gene assays in cost-effectiveness. As price points drop further, the next-generation sequencing services market gains incremental headroom in low- and middle-income countries seeking universal genomic screening.
Increasing Outsourcing of Genomic Research by Pharma & Biotech
Pharmaceutical R&D groups are consolidating sequencing workflows in external core labs to dodge rapid capital obsolescence. IQVIA Laboratories alone processed more than 100,000 clinical-trial samples in 2025, offering standardized outputs across whole-genome, exome, and single-cell assays. Outsourcing compresses development timelines and embeds quality-control rigor that satisfies regulators, thus directly lifting trial success probabilities. Contract labs, in turn, achieve economies of scale that let them reinvest in newer chemistries and AI-enabled analytics. This symbiosis is adding fresh revenue streams to the next-generation sequencing services market, especially in early discovery and adaptive Phase II/III designs.
Growing Adoption of NGS in Clinical Diagnostics & Oncology
Comprehensive genomic profiling is increasingly mandatory for therapy selection across lung, breast, and hematologic malignancies. A multicenter study in 2025 reported median overall survival of 59 months for patients whose regimens were guided by NGS versus 23 months under conventional testing. Regulatory momentum reinforces uptake: the FDA cleared 13 biomarker-targeted oncology therapies in 2025 alone, each tied to an NGS companion assay. Beyond cancer, diagnostic yields of 25–40% in rare-disease cases motivate payers to shift coverage toward genome-wide tests. Rapid turnaround and AI-driven variant ranking shorten diagnostic odysseys, enriching the next-generation sequencing services market.
Restraints Impact Analysis
| Restraints Impact Analysis | (~) % Impact on CAGR Forecast | Geographic Relevance | Impact Timeline | |||
|---|---|---|---|---|---|---|
High capital requirement High capital requirement | −0.8% | Emerging markets | Medium term (2-4 years) | (~) % Impact on CAGR Forecast:−0.8% | Geographic Relevance:Emerging markets | Impact Timeline:Medium term (2-4 years) |
Regulatory and data governance complexity Regulatory and data governance complexity | −1.0% | North America, Europe | Long term (≥ 4 years) | |||
Shortage of skilled genomic data analysts Shortage of skilled genomic data analysts | −0.7% | Global (acute in emerging markets) | Medium term (2-4 years) | |||
Variable reimbursement & coverage policies across regions Variable reimbursement & coverage policies across regions | −0.9% | North America, Europe, Asia Pacific | Short term (≤ 2 years) | |||
| Source: Mordor Intelligence | ||||||
High Capital Requirement for Advanced Sequencing Platforms
Flagship sequencers cost more than USD 1 million, and annual consumable, service, and depreciation charges exacerbate ownership burdens. Smaller regional labs often lack the sample volume required to dilute fixed costs, prompting market consolidation into centralized reference centers. In low-income regions, constrained budgets delay adoption, widening the care gap despite clear clinical utility. Leasing models and shared-use consortia have emerged but remain rare, holding back the full expansion potential of the next-generation sequencing services market.
Complex Regulatory & Data Governance Landscape
Laboratories juggling divergent validation standards across jurisdictions face protracted approval timelines and redundant documentation. Europe’s IVDR and GDPR impose rigorous analytical-performance and data-privacy checkpoints, while U.S. state-by-state rules add extra layers of oversight. Compliance cycles can extend implementation by 12–18 months, dampening provider agility. Liquid biopsy and minimal residual disease assays sit in particularly gray regulatory zones, stalling commercial rollouts. Harmonized guidance would unlock faster scaling of the next-generation sequencing services market, yet consensus appears several years away.
Segment Analysis
By Service Type: Human Genome Sequencing Anchors Revenue, Single Cell Sequencing Accelerates Discovery
Human Genome Sequencing accounted for 37.35% of next-generation sequencing services market share in 2025, reflecting entrenched use in rare-disease diagnostics and population genomics. The segment’s volume growth is closely linked to nationwide screening programs and payers’ increasing willingness to reimburse comprehensive genomic profiling. Rising adoption among obstetric units for prenatal anomaly detection further enlarges volumes, adding stability to the revenue base. Single Cell Sequencing is racing ahead with a 16.82% CAGR over 2026-2031, fueled by innovations that trim reagent costs and simplify cell-capture workflows. Illumina’s 2024 acquisition of Fluent BioSciences integrated bead-based barcoding that cuts per-sample expenses and elevates multiomic data density.
The momentum of Single Cell Sequencing is also evident in oncology, immunology, and neuroscience research, where cell-type heterogeneity holds diagnostic and therapeutic clues. Drug-development pipelines now embed single-cell transcriptomics for target validation, creating fresh outsourcing opportunities. Meanwhile, microbial genome sequencing is broadening its footprint in infection-control programs after metagenomic tests achieved pathogen detection rates of 86% in pulmonary infections, surpassing legacy culture workflows. Gene regulation and targeted panels remain vital for cost-sensitive projects that do not demand entire genomes. Collectively, these diversified offerings preserve steady order flow for the next-generation sequencing services market.
Note: Segment shares of all individual segments available upon report purchase
By Technology: SBS Remains Dominant, Nanopore Ups the Pace
Sequencing-by-Synthesis contributed 60.20% of revenue in 2025, underpinning the largest installed base within the next-generation sequencing services market size ecosystem. High (>99%) accuracy, robust vendor support, and flexible throughput help SBS satisfy routine clinical and research demands. Long-read Nanopore Sequencing, however, is commanding attention with a forecast 22.46% CAGR. Oxford Nanopore’s 2025 update raised raw read accuracy, enabling clinical labs to call single-nucleotide variants and structural variants in one assay. This capability shortens turnaround times for complex rearrangements and supports real-time outbreak surveillance in field settings.
Ion Semiconductor Sequencing holds niche strength in panel-based workflows that demand rapid same-day answers, particularly for on-site oncology services. Pacific Biosciences’ SMRT Sequencing fills gaps in structural-variant analysis for constitutional disorders. Meanwhile, Roche’s Sequencing-by-Expansion prototype unveiled in 2025 slashes cycle times from days to hours while retaining >99.8% SNV accuracy. This influx of specialized chemistries lets laboratories align platform choice to application need, adding technical diversity and competitive vigor to the next-generation sequencing services market.
By Application: Diagnostics Commands the Present, Drug Discovery Captures Future Growth
Clinical Diagnostics secured 45.40% of revenue in 2025, verifying the mainstream position of NGS in oncology, hereditary disease work-ups, and infectious-disease surveillance. Comprehensive genomic profiling flagged actionable variants in nearly half of all cancer patients tested across a large U.S. health system. This performance and the accelerating pace of FDA approvals for biomarker-guided drugs reinforce diagnostics’ central role.
Drug Discovery & Development is set to log an 17.10% CAGR to 2031, as sponsors integrate whole-exome and single-cell data into target selection and adaptive-trial enrollment. This demand funnels high-margin, multi-year contracts into the next-generation sequencing services market, cushioning cyclical research budgets. Academic life-science projects, agricultural genomics, and forensics supply incremental revenue but remain comparatively small. Across applications, the trend is decisively multiomic: providers increasingly bundle genomics with proteomic and metabolomic readouts, enriching biological insight and lifting average order values.
Note: Segment shares of all individual segments available upon report purchase
By End User: Laboratories Lead, Hospitals Close the Gap
Clinical Diagnostic Laboratories retained 33.60% revenue share in 2025, leveraging sample aggregation, proprietary pipelines, and payer contracting clout. Their centralized models yield operating margins that can absorb price erosion and fund platform upgrades. Hospitals & Clinics, posting a 15.30% CAGR outlook, are decentralizing select assays to expedite decision-making at the point of care. Thermo Fisher and Pfizer’s alliance to stage oncology sequencing across 30 countries exemplifies this trend, embedding NGS directly into local hospital workflows.
Pharmaceutical and biotech companies depend on contract sequencing for post-marketing surveillance and real-world evidence. Academic institutions keep fueling tool innovation, especially for single-cell and spatial paradigms. Government public-health labs and forensic units adopt NGS more gradually but contribute stable baseline demand. Emerging point-of-care collaborations such as Cepheid-Oxford Nanopore aim to merge rapid PCR detection with portable sequencing, broadening access in smaller hospitals ClinicalLab. Together, these dynamics cultivate a multidimensional customer landscape for the next-generation sequencing services market.
Geography Analysis
North America commanded 47.40% of revenue in 2025, supported by advanced reimbursement, mature clinical-trial ecosystems, and strong academic networks. The FDA’s proactive stance on companion-diagnostic clearances—13 biomarker-guided oncology therapies approved in 2025 alone—creates predictable throughput for accredited labs. Nonetheless, inconsistent payer policies persist; Medicare denial rates for cancer-related NGS rose to 27.4% post-2020 amendments, tempering growth. Consolidation continues as major providers acquire regional labs to scale infrastructure and negotiate nationwide contracts, reinforcing North America’s pivotal position in the next-generation sequencing services market.
Asia Pacific is forecast to be the fastest-growing arena at 14.60% CAGR through 2031, propelled by escalating healthcare budgets and state-sponsored precision-medicine projects. China is rolling out cost-competitive local sequencers, while Japan approved Illumina’s TruSight Oncology Comprehensive test in 2025, elevating clinical adoption standards. India’s genomics ecosystem is expanding via private-public consortia focusing on oncology and rare-disease panels. However, disparities between metropolitan centers and rural areas underline infrastructure and talent gaps that could cap short-term uptake. Cross-border initiatives, such as Illumina’s partnership with Macrogen on a Korean genome program, hint at region-wide collaboration that will help harmonize standards and enlarge the next-generation sequencing services market.
Europe maintains steady mid-single-digit growth, anchored in strong academic consortia and national health-service integration. However, providers must navigate IVDR compliance and GDPR data-protection mandates, raising operating expenses and elongating project timelines. Latin America, the Middle East, and Africa collectively offer emerging potential in oncology and infectious-disease sequencing but face barriers ranging from capital constraints to supply-chain bottlenecks. Pilot projects in Gulf Cooperation Council states and South Africa showcase the feasibility of large-scale genomic screening once funding and data-localization policies align. As regional specialization deepens, global vendors tailor service menus to local reimbursement pathways and clinical-trial regulations, ensuring that the next-generation sequencing services market remains responsive to geographic nuances.

Competitive Landscape
Market Concentration
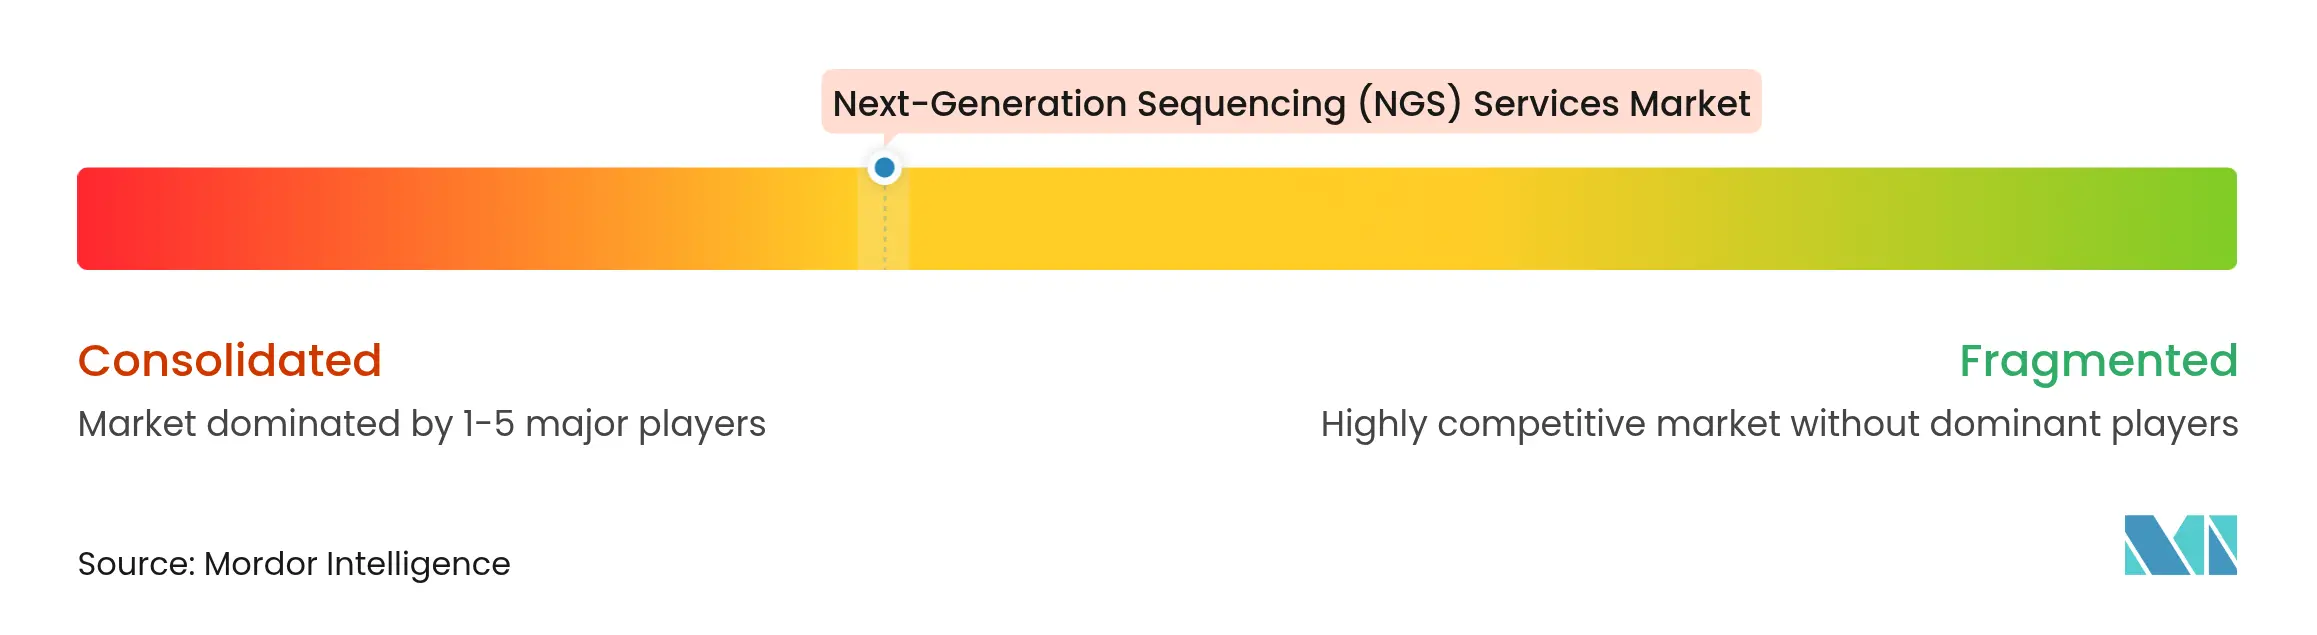
The next-generation sequencing services industry displays moderate concentration: the top five vendors hold just under 70.0% combined share, while scores of regional specialists fill remaining niches. Illumina extends its leadership via vertical integration, bundling reagents, instruments, and analytic services; its January 2025 AI partnership with Nvidia aims to shorten variant-interpretation timelines. Thermo Fisher complements mid-throughput instruments with oncology panel services co-developed alongside major drug makers. Oxford Nanopore, Pacific Biosciences, and BGI strengthen competitive dynamics through differentiated read-length or cost structures, pushing incumbents to diversify platform portfolios.
Strategic alliances are central to value creation. The Thermo Fisher–Pfizer pact embeds NGS in routine hospital oncology testing across 30 countries, merging hardware and therapeutic know-how. Cepheid’s tie-up with Oxford Nanopore targets infectious-disease sequencing at the point of care, illustrating convergence between rapid PCR and long-read workflows. Roche’s 2025 SBX debut intensifies competition by slashing run times, and QIAGEN’s 700-gene panels paired with Element Biosciences underline the ascendancy of comprehensive genomic profiling.
Niche providers cultivate premium positions through disease-focused expertise, particularly in neuro-oncology, immune disorders, and microbiome analytics. AI-centric entrants leverage proprietary variant-calling algorithms to differentiate turn-around times and clinical accuracy. Talent scarcity in bioinformatics remains a universal constraint, spurring investments in cloud-native pipelines and automated annotation platforms. As new chemistries truncate per-sample costs, service players shift emphasis toward data interpretation and integrated multi-omic deliverables, reinforcing service-led differentiation across the next-generation sequencing services market.
Next-Generation Sequencing (NGS) Services Industry Leaders

*Disclaimer: Major Players sorted in no particular order
Recent Industry Developments
- May 2025: Illumina received regulatory approval in Japan for TruSight Oncology Comprehensive, a 500-gene DNA/RNA profiling service tailored to identify actionable biomarkers for targeted cancer therapies.
- April 2025: QIAGEN launched QIAseq panels covering more than 700 genes and announced integration with Element Biosciences’ Trinity workflow, boosting comprehensive genomic profiling throughput.
- April 2025: Cepheid and Oxford Nanopore entered a collaboration to merge GeneXpert PCR detection with nanopore sequencing for rapid in-house analysis of infectious pathogens.
- February 2025: Roche unveiled Sequencing by Expansion (SBX), cutting run times to hours while keeping >99.8% SNV accuracy.
- February 2025: BD announced plans to spin off its Biosciences and Diagnostic Solutions unit, forecasting USD 3.4 billion revenue for fiscal 2024 and targeting a USD 22 billion addressable market.
- January 2025: Illumina enhanced NovaSeq X with a single-flow-cell option and new 25B cycle kits, broadening access for mid-volume labs.
- January 2025: Illumina formed a strategic partnership with Nvidia to accelerate AI-powered variant interpretation across its cloud pipeline.
- February 2024: New England Biolabs introduced NEBNext UltraExpress library-prep kits, enabling DNA library preparation in under 2 hours and RNA prep in 3 hours.
Table of Contents for Next-Generation Sequencing (NGS) Services Industry Report
1. Introduction
- 1.1Study Assumptions & Market Definition
- 1.2Scope of the Study
2. Research Methodology
3. Executive Summary
4. Market Landscape
- 4.1Market Overview
- 4.2Market Drivers
- 4.2.1Expansion of Precision Medicine Programs Globally
- 4.2.2Declining Cost per Genome Sequenced
- 4.2.3Increasing Outsourcing of Genomic Research by Pharma & Biotech
- 4.2.4Growing Adoption of NGS in Clinical Diagnostics & Oncology
- 4.2.5Rising Investment in Population-Scale Genomics Projects
- 4.2.6Technological Innovations Enhancing Sequencing Throughput & Accuracy
- 4.3Market Restraints
- 4.3.1High Capital Requirement for Advanced Sequencing Platforms
- 4.3.2Complex Regulatory & Data Governance Landscape
- 4.3.3Shortage of Skilled Genomic Data Analysts
- 4.3.4Variable Reimbursement & Coverage Policies Across Regions
- 4.4Regulatory Outlook
- 4.5Porter's Five Forces Analysis
- 4.5.1Threat of New Entrants
- 4.5.2Bargaining Power of Buyers
- 4.5.3Bargaining Power of Suppliers
- 4.5.4Threat of Substitutes
- 4.5.5Competitive Rivalry
- 4.6Funding & Partnership Analysis
5. Market Size & Growth Forecasts (Value, USD)
- 5.1By Service Type
- 5.1.1Human Genome Sequencing Services
- 5.1.2Single Cell Sequencing Services
- 5.1.3Microbial Genome-Based Sequencing Services
- 5.1.4Gene Regulation Services
- 5.1.5Other Service Types
- 5.2By Technology
- 5.2.1Sequencing-by-Synthesis (SBS)
- 5.2.2Ion Semiconductor Sequencing
- 5.2.3Nanopore Sequencing
- 5.2.4Single-Molecule Real-Time (SMRT) Sequencing
- 5.3By Application
- 5.3.1Clinical Diagnostics
- 5.3.2Drug Discovery & Development
- 5.3.3Biotechnology & Genetic Research
- 5.3.4Other Applications
- 5.4By End User
- 5.4.1Hospitals & Clinics
- 5.4.2Pharmaceutical & Biotech Companies
- 5.4.3Clinical Diagnostic Laboratories
- 5.4.4Academic & Research Institutions
- 5.4.5Other End Users
- 5.5Geography
- 5.5.1North America
- 5.5.1.1United States
- 5.5.1.2Canada
- 5.5.1.3Mexico
- 5.5.2Europe
- 5.5.2.1Germany
- 5.5.2.2United Kingdom
- 5.5.2.3France
- 5.5.2.4Italy
- 5.5.2.5Spain
- 5.5.2.6Rest of Europe
- 5.5.3Asia-Pacific
- 5.5.3.1China
- 5.5.3.2Japan
- 5.5.3.3India
- 5.5.3.4South Korea
- 5.5.3.5Australia
- 5.5.3.6Rest of Asia-Pacific
- 5.5.4Middle-East and Africa
- 5.5.4.1GCC
- 5.5.4.2South Africa
- 5.5.4.3Rest of Middle East and Africa
- 5.5.5South America
- 5.5.5.1Brazil
- 5.5.5.2Argentina
- 5.5.5.3Rest of South America
6. Competitive Landscape
- 6.1Market Concentration
- 6.2Market Share Analysis
- 6.3Company Profiles (includes Global level Overview, Market level overview, Core Business Segments, Financials, Headcount, Key Information, Market Rank, Market Share, Products and Services, and analysis of Recent Developments)
- 6.3.1Illumina Inc.
- 6.3.2Thermo Fisher Scientific Inc.
- 6.3.3PerkinElmer Inc.
- 6.3.4Eurofins Scientific SE
- 6.3.5BGI Group
- 6.3.6Macrogen Inc.
- 6.3.7Qiagen N.V.
- 6.3.8GENEWIZ Inc. (Azenta Life Sciences)
- 6.3.9Genotypic Technology Pvt Ltd.
- 6.3.10DNA Link Inc.
- 6.3.11Takara Bio Inc.
- 6.3.12Personalis Inc.
- 6.3.13LGC Limited
- 6.3.14Scigenom Labs Pvt Ltd.
- 6.3.15Novogene Co. Ltd.
- 6.3.16Oxford Nanopore Technologies plc
- 6.3.17Pacific Biosciences of California Inc.
- 6.3.18Guardant Health Inc.
- 6.3.19Twist Bioscience Corp.
- 6.3.20Agilent Technologies Inc.
7. Market Opportunities & Future Outlook
- 7.1White-Space & Unmet-Need Assessment
Research Methodology Framework and Report Scope
Market Definitions and Key Coverage
Our study defines the Next-Generation Sequencing (NGS) Services market as paid laboratory or cloud-based services that generate, process, and deliver sequence data to external clients across human, animal, plant, and microbial projects. These services cover wet-lab sequencing, library prep add-ons, bioinformatic analysis, and secure data return.
Scope Exclusions: Capital equipment sales, in-house sequencing performed by the client's own instruments, and stand-alone informatics software licenses lie outside our scope.
Segmentation Overview
- By Service Type
- Human Genome Sequencing Services
- Single Cell Sequencing Services
- Microbial Genome-Based Sequencing Services
- Gene Regulation Services
- Other Service Types
- Human Genome Sequencing Services
- By Technology
- Sequencing-by-Synthesis (SBS)
- Ion Semiconductor Sequencing
- Nanopore Sequencing
- Single-Molecule Real-Time (SMRT) Sequencing
- Sequencing-by-Synthesis (SBS)
- By Application
- Clinical Diagnostics
- Drug Discovery & Development
- Biotechnology & Genetic Research
- Other Applications
- Clinical Diagnostics
- By End User
- Hospitals & Clinics
- Pharmaceutical & Biotech Companies
- Clinical Diagnostic Laboratories
- Academic & Research Institutions
- Other End Users
- Hospitals & Clinics
- Geography
- North America
- United States
- Canada
- Mexico
- United States
- Europe
- Germany
- United Kingdom
- France
- Italy
- Spain
- Rest of Europe
- Germany
- Asia-Pacific
- China
- Japan
- India
- South Korea
- Australia
- Rest of Asia-Pacific
- China
- Middle-East and Africa
- GCC
- South Africa
- Rest of Middle East and Africa
- GCC
- South America
- Brazil
- Argentina
- Rest of South America
- Brazil
- North America
Detailed Research Methodology and Data Validation
Primary Research
We interview lab managers, reimbursement specialists, and payor medical directors across North America, Europe, and Asia. Their insights help us validate average price per whole genome, turnaround-time norms, oncology test mix, and emerging single-cell demand pockets, tightening every assumption carried forward from secondary work.
Desk Research
We start by mapping the service universe through freely available tier-one sources such as the NIH Sequence Read Archive uploads, FDA 510(k) clearances for laboratory-developed NGS tests, CLIA laboratory registries, Eurostat trade codes for sequencing reagents, and WHO Cancer Incidence statistics. Company 10-Ks, investor decks, and association portals like Genomics England or GenomeCanada enrich volume and unit-price cues.
Next, analysts mine paid datasets, for instance, D&B Hoovers for contract revenues and Questel for patent trends in clinical sequencing workflows. Dow Jones Factiva tracks service-launch news that signals capacity additions. These examples illustrate, but do not exhaust, the wider desk-research pool tapped for baselines, cross-checks, and context.
Market-Sizing & Forecasting
Mordor analysts first rebuild the worldwide service revenue using a top-down sequence-volume pool drawn from reported clinical test counts and research project submissions, which are then multiplied by blended ASPs. Selected bottom-up checks, such as roll-ups of the largest ten service vendors and sampled kit cost mark-ups, are used to fine-tune totals. Key variables in the model include falling cost-per-gigabase, number of CLIA-certified NGS labs, reimbursed oncology panel volumes, funded population genomics cohorts, and average data-analysis spend per run. A multivariate regression projects each driver, allowing scenario filters for currency shifts and reimbursement policy changes.
Data Validation & Update Cycle
Outputs pass anomaly scans, peer review, and a senior analyst sign-off. Models refresh annually; interim updates trigger if reagent price shocks, major reimbursement decisions, or capacity expansions create greater than 5% variance against the last baseline.
Why Our Next-Generation Sequencing Services Baseline Commands Reliability
Benchmark comparison
Clients notice that published estimates diverge; definitions, service bundling, and forecast cadences rarely align.
The largest gaps stem from whether analysts fold in sample-prep outsourcing, apply optimistic price erosion curves, or carry forward pandemic-era sequencing surges. Mordor reports stick to paid-for sequencing and data-analysis only, apply verified ASP declines, and refresh every twelve months, minimizing scope drift and stale inputs.
| Market Size | Anonymized source | Primary gap driver | ||
|---|---|---|---|---|
USD 5.32 B (2025) | Mordor Intelligence | - | Anonymized source:Mordor Intelligence | Primary gap driver:- |
USD 7.18 B (2024) | Global Consultancy A | Bundles library-prep consumable resale and uses aggressive 25% annual price drop | ||
USD 12.20 B (2025) | Industry Journal B | Includes hardware leasing revenue and runs an optimistic 2035 scenario back-cast |