
Lab Automation In Drug Discovery Market Size and Share
Market Overview
| Study Period | 2020 - 2031 |
|---|---|
| Market Size (2026) | USD 5.9 Billion |
| Market Size (2031) | USD 7.27 Billion |
| Growth Rate (2026 - 2031) | 4.28 % |
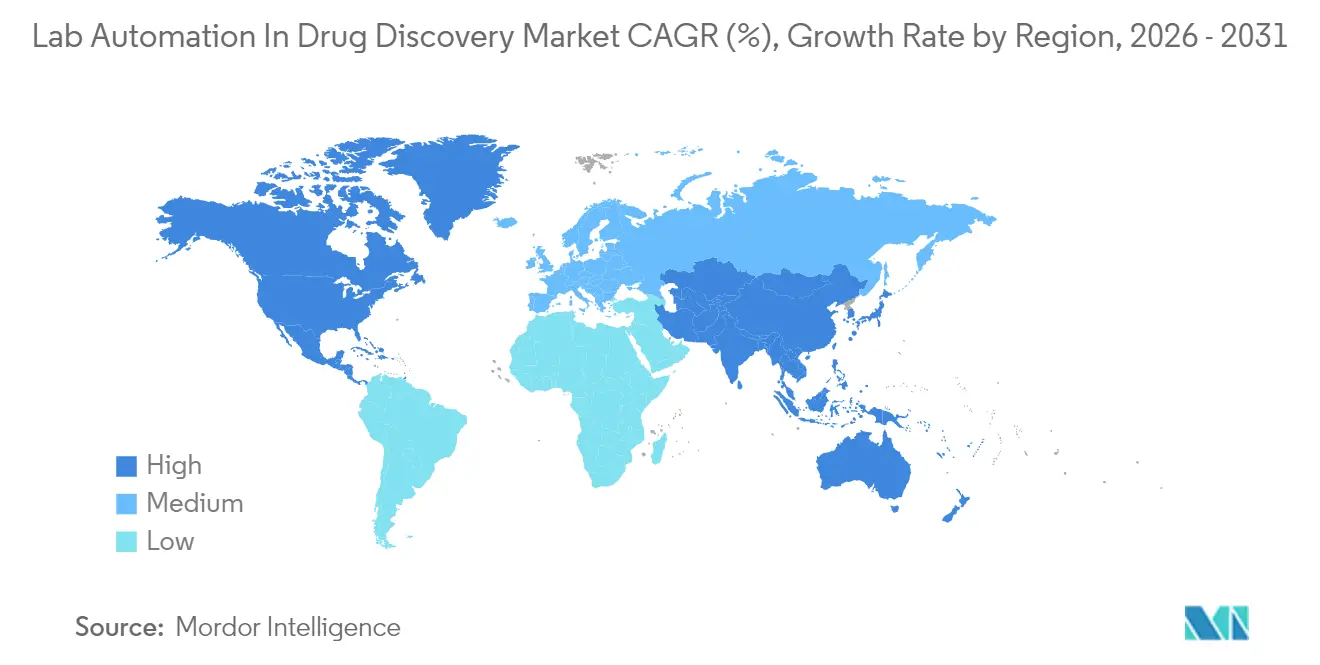
| Fastest Growing Market | Asia-Pacific |
| Largest Market | North America |
| Market Concentration | Medium |
Major Players *Disclaimer: Major Players sorted in no particular order Image © Mordor Intelligence. Reuse requires attribution under CC BY 4.0. | |
Lab Automation In Drug Discovery Market Analysis by Mordor Intelligence
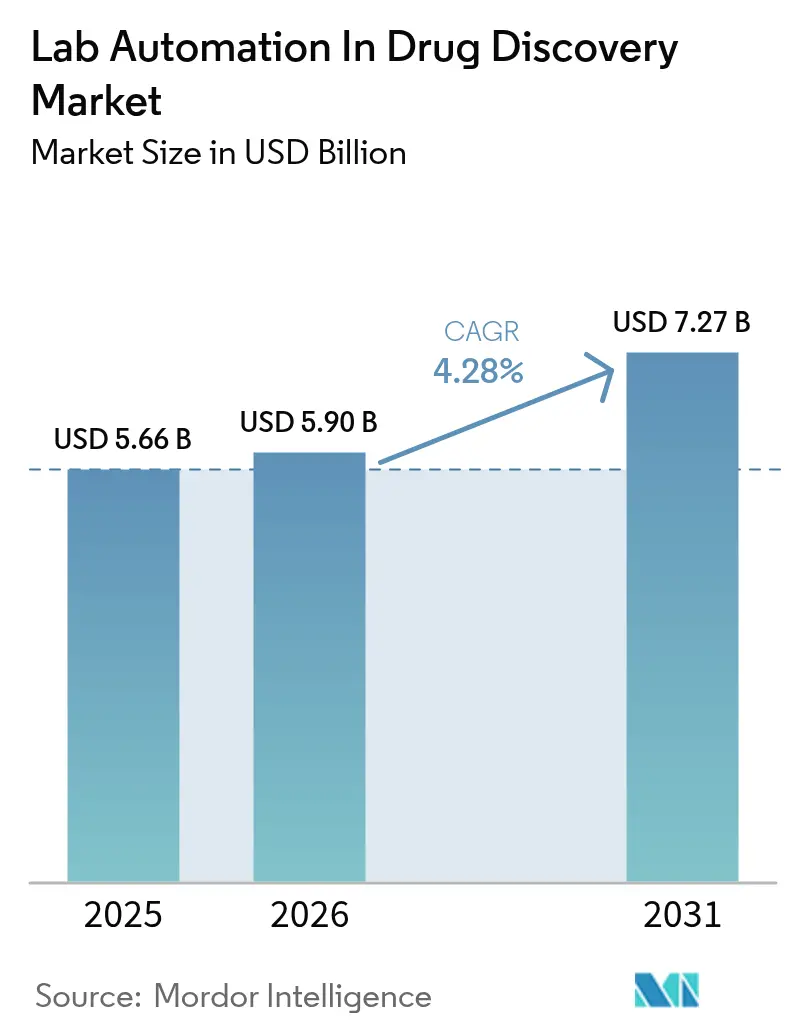
The lab automation market size in the drug discovery sector was valued at USD 5.66 billion in 2025 and estimated to grow from USD 5.90 billion in 2026 to reach USD 7.27 billion by 2031, at a CAGR of 4.28% during the forecast period (2026-2031). The growth path reflects the steady integration of artificial intelligence into laboratory workflows, the mainstream adoption of acoustic liquid handling, and increasing investments that alleviate talent shortages across pharmaceutical research hubs. In 2024, automated liquid handlers have become a key component of modern screening lines. This development is driven by compound library developers increasingly relying on high-throughput screening to achieve faster cycle times. Pharmaceutical companies continue to represent the largest segment, accounting for the highest demand, while contract research organizations are becoming increasingly significant, reflecting a growing trend toward outsourcing and services focused on automation.
North America, supported by its established regulatory frameworks and substantial research funding, maintained its leadership position in 2024. Meanwhile, the Asia-Pacific region is gaining momentum, driven by China’s USD 2.1 billion automation stimulus and India’s rapid growth in contract research and development manufacturing services. Growth trends across equipment categories are becoming more diverse. Automated storage and retrieval systems are experiencing strong adoption, highlighting laboratories’ increasing focus on secure and compliant sample management. In application areas, ADME-Tox studies are emerging as a key growth driver, supported by the transition from animal testing to organ-on-chip assays, which are gaining regulatory acceptance.
Key Report Takeaways
- By equipment, automated liquid handlers captured 31.05% of the lab automation market share in 2025, while automated storage and retrieval systems are projected to rise at a 5.45% CAGR through 2031.
- By application, high-throughput screening generated 27.45% of 2025 revenue; ADME-Tox platforms are forecasted to post the fastest growth of 5.6% CAGR to 2031.
- By end user, pharmaceutical companies held 39.25% of the lab automation in the drug discovery market in 2025, whereas contract research organizations are expanding at a 4.44% CAGR.
- By geography, North America led with 34.20% of spending in 2025; the Asia-Pacific region is expected to advance at a 5.62% CAGR through 2031.
Note: Market size and forecast figures in this report are generated using Mordor Intelligence’s proprietary estimation framework, updated with the latest available data and insights as of 2026.
Market Trends and Insights
Drivers Impact Analysis of Lab Automation In Drug Discovery Market*
| DRIVER | (~) % IMPACT ON CAGR FORECAST | GEOGRAPHIC RELEVANCE | IMPACT TIMELINE |
|---|---|---|---|
| Rapid miniaturization and HTS platforms | +1.2% | North America, Europe | Medium term (2-4 years) |
| Integration of AI-enabled analytics | +1.5% | Global, led by North America | Short term (≤ 2 years) |
| Chronic-disease research and development spending is up-cycling | +0.8% | Global | Long term (≥ 4 years) |
| Demand for faster time-to-clinic | +1.1% | Global | Medium term (2-4 years) |
| Open-source lab-automation consortia | +0.4% | North America, Europe | Long term (≥ 4 years) |
| Sustainability-driven micro-fluidics | +0.6% | Europe expanding globally | Medium term (2-4 years) |
| Source: Mordor Intelligence | |||
Rapid Miniaturization and HTS Platforms
High-throughput screening now reaches daily volumes of over 100,000 compounds, thanks to miniaturized 1,536- and 3,456-well plates, which cut reagent use by 95% without compromising data quality.[1]Source: “Laboratory automation accelerates pharmaceutical research timelines,” Nature Reviews Drug Discovery, nature.com Acoustic dispensers deliver sub-microliter precision, and plate handlers equipped with environmental sensors maintain assay integrity under stringent regulatory controls. The technology lowers per-assay cost, broadens library coverage for small molecules, and widens adoption among biotechnology start-ups that once lacked capital for large-footprint robotics. Integrated systems reduce handoffs between sample preparation and analysis, boosting uptime and minimizing the need for manual checks by operators. Regulators in the United States and Europe now accept miniaturized assay results for submission dossiers, removing the last institutional hurdle.
Integration of AI-enabled Analytics
Artificial intelligence converts conventional robots into adaptive research companions that optimize protocols in real time. Platforms such as NVIDIA BioNeMo enable liquid handlers to self-adjust based on historical performance, reducing variance by up to 40% while flagging anomalies before data review. Predictive maintenance algorithms equally shrink unplanned downtime, extending annual productive hours. In parallel, deep-learning engines sift through screening outputs to auto-rank hits, trimming hit-to-lead timelines by roughly 30%.
Chronic-disease Research and Devlopment Spending Up-cycle
Industry research and development budgets are increasing, with a focus on chronic diseases, including oncology, neuroscience, and metabolic disorders. Complex cell-based assays and large compound libraries have become standard, prompting laboratories to automate their workflows earlier and more thoroughly. Oncology teams rely on high-content imaging systems to process thousands of tumor cell plates around the clock, while neurobiology groups invest in gentle liquid handlers for fragile organoids. Automation vendors benefit not only from equipment orders but also from software subscriptions and validation services associated with multi-year transformation programs.
Demand for Faster Time-to-clinic
Industry pressure to cut average development timelines from 12 years to under 8 years drives laboratories toward 24/7, lights-out operation. Continuous-flow automation triples weekly sample throughput without proportional head-count increases. Coupled scheduling software orchestrates plate movements, instrument queues, and data capture, allowing follow-up assays to launch minutes after primary screens close. Contract research organizations utilize these capabilities as key selling points, further accelerating the momentum of outsourcing. Automated storage units contribute by retrieving samples within seconds while maintaining audit trails needed for investigational new drug filings.
Restraints Impact Analysis of Lab Automation In Drug Discovery Market*
| RESTRAINT | (~) % IMPACT ON CAGR FORECAST | GEOGRAPHIC RELEVANCE | IMPACT TIMELINE |
|---|---|---|---|
| High CAPEX for SMEs | -0.9% | Global | Medium term (2-4 years) |
| Legacy-software interoperability gaps | -0.7% | North America, Europe | Short term (≤ 2 years) |
| Supplier back-orders on precision actuators | -0.5% | Global, notably Asia-Pacific | Short term (≤ 2 years) |
| Post-COVID wet-lab talent crunch | -0.4% | Global | Medium term (2-4 years) |
| Source: Mordor Intelligence | |||
High CAPEX for SMEs
Comprehensive automation lines cost over USD 2 million, a threshold beyond the reach of many biotech start-ups despite proven paybacks. Leasing and robotics-as-a-service schemes have emerged, yet stiff credit checks and multi-year commitments still deter early-stage firms. Regional banks offer targeted loans, but limited quotas leave demand unmet.
Legacy-software Interoperability Gaps
Pharmaceutical giants operate robotics that have been installed across decades, each controlled by proprietary code that seldom communicates with next-generation AI layers. Upgrades require middleware, custom drivers, and rigorous revalidation under Good Laboratory Practice (GLP) rules, which inflates integration costs to nearly half of new equipment budgets. These friction points postpone refresh cycles, slowing short-term uptake.
*Our forecasts treat driver/restraint impacts as directional, not additive. The impact forecasts reflect baseline growth, mix effects, and variable interactions.
Lab Automation In Drug Discovery Market Segment Analysis
By Equipment:
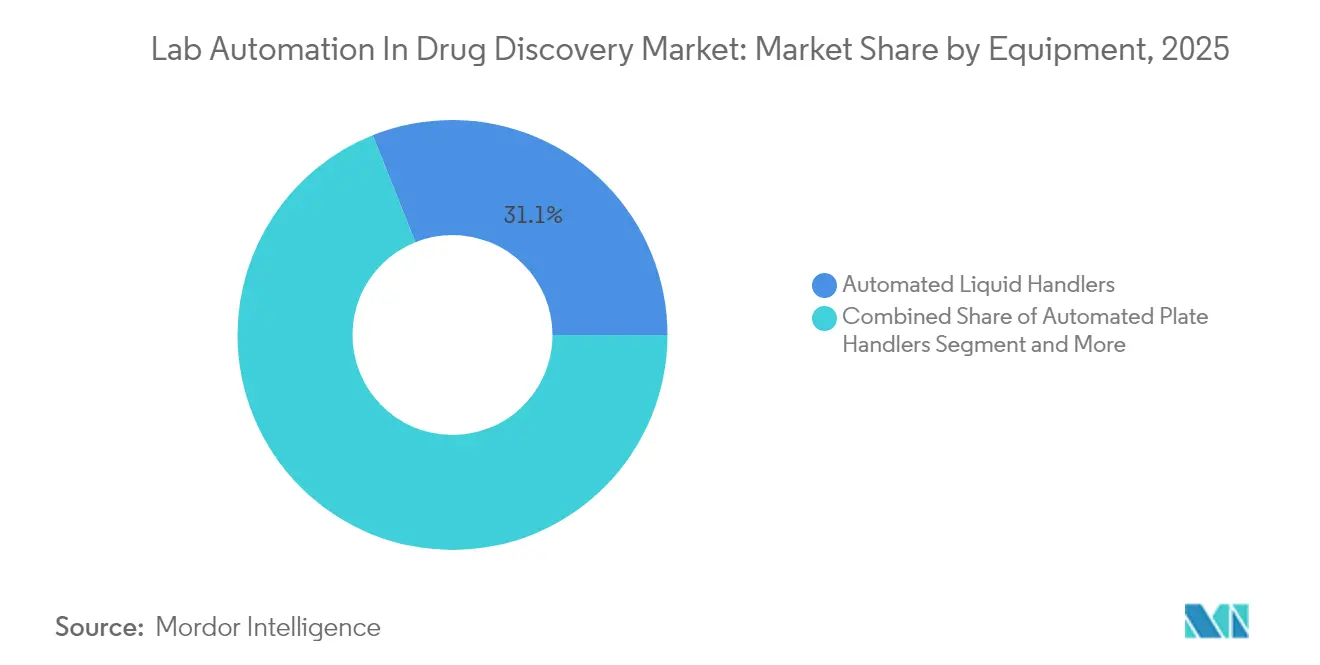
Storage Systems Drive Infrastructure EvolutionAutomated liquid handlers accounted for 31.05% of the 2025 expenditure, underscoring their centrality in nearly every screen and assay. Continuous improvements in acoustic dispensing now enable sub-microliter transfers that safeguard expensive reagents while preserving analytical precision. Vendors embed AI dashboards, allowing operators to fine-tune protocols based on historical error trends. As laboratories extend operating hours, uptime and tip economy become decisive buying factors. Parallel innovation in contactless cleaning lowers cross-contamination risk and reduces consumable budgets.
Automated storage and retrieval systems, although smaller in base, represent the fastest-growing cluster with a 5.45% CAGR. Multi-temperature towers integrate barcode verification and chain-of-custody logging that satisfy FDA audit trails. Modular footprints let mature facilities add capacity without disrupting workflows, and cloud dashboards issue predictive maintenance alerts that prevent costly downtime. Looking ahead, hybrid systems that co-locate cryogenic and ambient racks in a single aisle are expected to yield further utilization gains.



By Application:
ADME-Tox Studies Accelerate Safety EvaluationHigh-throughput screening accounted for 27.45% of 2025 application revenue, as pharma and CROs maintained an arms race to screen ever larger libraries. Demand rests on efficient hit identification: acoustic pipetting, self-calibrating plate readers, and batch scheduling engines converge to keep plates moving with minimal pause. Future expansion will hinge on AI algorithms that pre-rank compounds, trimming false positives before confirmation runs.
ADME-Tox platforms are the fastest-growing, increasing 5.6% per year. Organ-on-chip devices enable parallel assessments of liver, kidney, and cardiac responses within microfluidic channels, generating concurrent multi-endpoint data. Regulatory bodies now cite automated ADME-Tox readouts as valid support in new drug applications, ensuring widespread dataset acceptance. Integration of mass-spectrometry analyzers directly into fluidics lines trims sample hand-offs and cleans compliance documentation.
By End User:
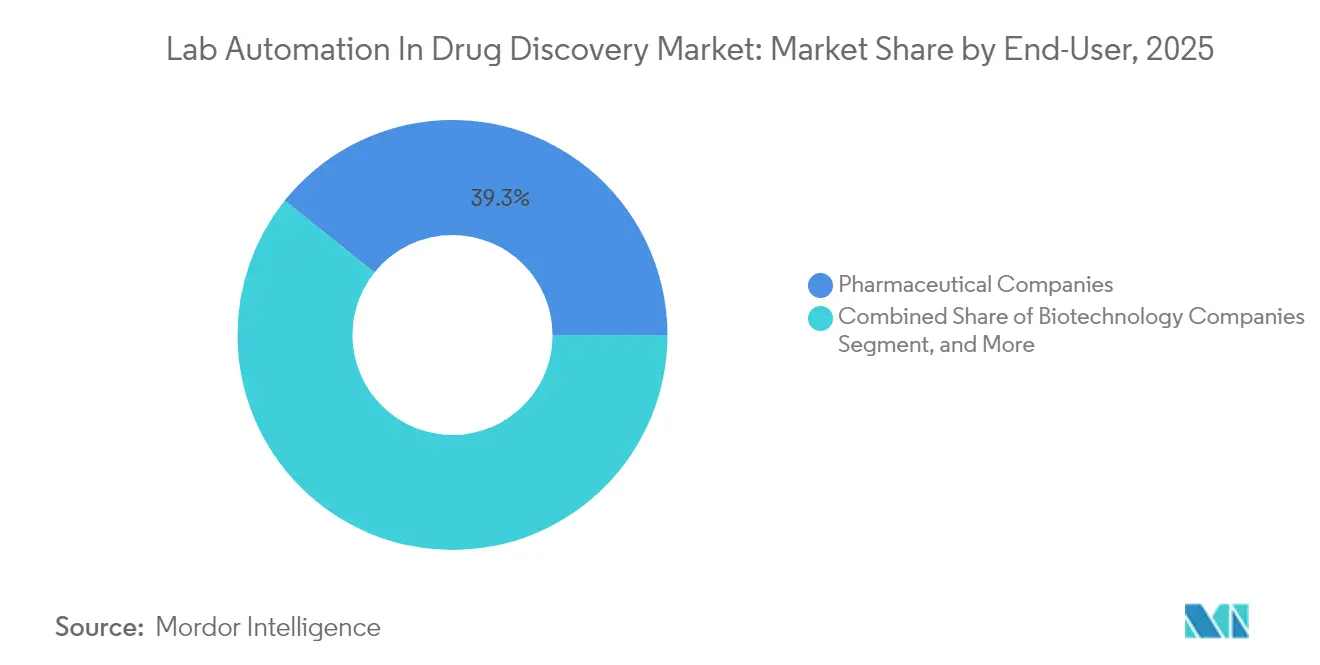
CROs Emerge as Automation LeadersPharmaceutical companies retained 39.25% of 2025 revenue. Internal programs emphasize harmonized data stacks across global sites, forcing vendors to deliver enterprise-wide validation and remote monitoring as non-negotiable features.
Contract research organizations, while smaller, recorded the highest 4.44% CAGR. CROs leverage scale to run fully robotic facilities that offer 24/7 access to mid-tier biotech clients. These operators often qualify as early adopters for AI-embedded releases, providing vendors with rapid feedback loops that shape product roadmaps. Academic and government labs utilize automation through grant funding, focusing on specialized modules such as high-content imaging or automated cell culture, which advance translational projects without overextending budgets.
Geography Analysis
North America Lab Automation in Drug Discovery Market
North America accounted for 34.20% of global revenue in 2025 and remains the largest market for advanced platforms. The United States leads through sustained National Institutes of Health grants that modernize shared-core facilities, while Canada’s research clusters in Ontario and Québec favor modular robotics that fit in retrofit labs. Mexico’s manufacturing corridors now produce subassemblies for U.S. and European vendors, streamlining cross-border supply.
Europe Lab Automation in Drug Discovery Market
Europe follows with robust adoption in Germany, the United Kingdom, and Switzerland. Sustainability rules drive the rapid uptake of microfluidic cartridges, which slash solvent use by 90% compared with legacy plates. Horizon Europe grants support multi-institutional automation projects, and the European Medicines Agency’s data-integrity guidance positions automated audit trails as a standard practice, spurring repeat orders for laboratory information management upgrades.
APAC Lab Automation in Drug Discovery Market
The Asia-Pacific region grows at the fastest rate of 5.62% CAGR, driven by substantial public investment. China has earmarked a significant portion for automated labs that align with its “Made in China 2025” strategy, while India’s CRDMO sector is scaling into double digits as Western sponsors shift preclinical briefs eastward. Japan and South Korea add momentum by integrating AI layers into established robotic lines, ensuring global alignment on quality. Regional regulators streamline standards through ASEAN harmonization, simplifying cross-border deployments and fueling multinational rollout plans.

Regulatory Landscape
Regulatory expectations for lab automation in drug discovery focus on data integrity, validation, and fit-for-purpose use of AI and new approach methodologies (NAMs) in regulated submissions. In March 2026, the US FDA issued draft guidance on General Considerations for the Use of NAMs in Drug Development, reinforcing the need for documented validation frameworks and reliable data generation when automated platforms and nontraditional assays support drug applications.
In Europe, the EMA has continued to emphasize AI/ML lifecycle management across the medicinal product lifecycle through its reflection-paper style guidance, pushing organizations toward stronger governance for algorithm changes, auditability, and traceable datasets. Standard-setting bodies have also been active, including ISO 23494-1:2026 on provenance information models for biological material and data in biotechnology, which supports chain-of-custody and traceability practices that align with automated sample management and AI-ready data pipelines.
Value Chain Analysis
The value chain spans instrument and module suppliers, including liquid handlers, plate handlers, robotic arms, analyzers, and automated storage and retrieval systems. It also includes integrators and software providers covering scheduling and orchestration, LIMS/ELN connectivity, and analytics, with end users spanning pharma, biotech, CROs, and academic and government labs.
Demand typically begins with high-throughput screening and ADME-Tox workflows, then moves into system design and validation services to meet GLP and data-integrity expectations, followed by installation, method transfer, user training, and ongoing service contracts for calibration, uptime, and compliance documentation. Integration and supply reliability are key friction points, since heterogeneous legacy control stacks create interoperability gaps that raise middleware and revalidation burdens, while miniaturized HTS workflows increase sensitivity to environmental and liquid-handling variability. The chain is also expanding through partnerships that connect instrumentation, robotics, and data platforms, for example SPT Labtech and ICE Bioscience launching a joint automated drug screening lab in Beijing (October 2024) and Arctoris partnering with Isomorphic Labs to generate large-scale datasets for AI model validation (September 2024).
Competitive Landscape
Competition mixes long-time hardware leaders with AI-first upstarts. Thermo Fisher Scientific expanded Massachusetts production by USD 150 million to shorten lead times for its machine-learning liquid handlers. Beckman Coulter Life Sciences invested USD 50 million to pair robotic arms with hematology analytics aimed squarely at drug discovery labs.[2]Source: Press releases archive, Thermo Fisher Scientific, thermofisher.com Hamilton Company’s USD 75 million acquisition of Robotics Plus adds niche sample-management expertise that plugs directly into its Microlab ecosystem.[3]Source: Automated Liquid Handling Systems and Robotics, Hamilton Company, hamiltoncompany.com
Emerging players stress cloud orchestration and subscription models. Partnerships, such as the Tecan–NVIDIA alliance, integrate GPU-powered BioNeMo analytics into benchtop robots, resulting in turnkey systems that automatically optimize protocols and reduce reagent costs by 30%. Vendors that integrate AI inference at the edge secure first-mover advantage as buyers prioritize closed-loop feedback over pure motion speed. Regulatory confidence in automated data capture strengthens incumbents that offer validated libraries of compliance scripts for FDA or EMA audits. Overall, moderate fragmentation persists, although acquisition pipelines suggest a gradual shift toward platform consolidation, which will elevate barriers for small, single-product firms.
Lab Automation In Drug Discovery Industry Leaders
Thermo Fisher Scientific Inc.
Beckman Coulter Life Sciences
Tecan Group AG
PerkinElmer Inc.
Agilent Technologies Inc.
- *Disclaimer: Major Players sorted in no particular order

Lab Automation In Drug Discovery Market Companies Covered in this Report
- Thermo Fisher Scientific Inc.
- Beckman Coulter Life Sciences
- Hudson Robotics Inc.
- Becton, Dickinson and Company
- MolGen B.V.
- Agilent Technologies Inc.
- Siemens Healthineers AG
- Tecan Group AG
- PerkinElmer Inc.
- Bio-Rad Laboratories Inc.
- F. Hoffmann-La Roche AG
- Eppendorf SE
- Shimadzu Corporation
- Aurora Biomed Inc.
- Hamilton Company
- HighRes Biosolutions Inc.
- SPT Labtech Ltd.
- Biosero Inc.
- TTP Labtech Holdings
- Automata Tech
- Opentrons Labworks Inc.
- Analytik Jena GmbH
- Andrew Alliance SA
- Arctoris Ltd.
- Labman Automation Ltd.

Market Opportunities and Future Outlook
A key whitespace is the shift from isolated automation islands toward end-to-end, closed-loop discovery workflows that connect experimental design, robotic execution, and analysis into a single data spine. June 2026 developments around agentic and instrument-aware analytics, such as Tecan integrating NVIDIA BioNeMo Agent Toolkit capabilities into its Introspect platform, reflect vendor investment in telemetry-driven risk flagging, protocol optimization, and more standardized operational layers that reduce variability and support audit-ready documentation.
Opportunities are also building around higher-content ADME and safety workstreams, where automated, reproducible data capture is a prerequisite for scaling organ-on-chip and multi-endpoint readouts. In May 2026, Ginkgo Datapoints, Tangible Scientific, and Inductive Bio launched ADME-One, an integrated ADME platform combining high-throughput panels with AI-assisted pharmacokinetic projection, indicating demand for packaged, workflow-level offerings rather than standalone instruments. At the same time, purpose-built autonomous facilities are being commercialized, including Medra Lab 001 (38,000 square feet, unveiled April 2026), reinforcing automation delivered as a capability (facility plus software plus methods) that can be more accessible for smaller biotechs facing the USD 2 million-plus threshold for comprehensive in-house automation lines.
Recent Industry Developments in Lab Automation In Drug Discovery Market
- June 2026: Tecan Group AG integrated agentic AI capabilities into its Introspect laboratory analytics platform using the NVIDIA BioNeMo Agent Toolkit. The release moved monitoring beyond dashboards into proactive, telemetry-driven risk flagging and decision support, aligning automation purchases with reproducibility and uptime management rather than only throughput.
- January 2026: Thermo Fisher Scientific announced a strategic collaboration with NVIDIA to leverage AI technologies, including NVIDIA DGX Spark, NeMo, and BioNeMo, for scientific instrumentation and laboratory performance. The collaboration broadens the pathway for AI-enabled protocol optimization and predictive maintenance features to be embedded across automated discovery workflows.
- June 2024: Thermo Fisher Scientific introduced a fully automated plasmid purification system aimed at accelerating therapy discovery and development workflows. By reducing manual steps in a common upstream task for molecular biology and screening, the launch supports higher-throughput, more standardized sample preparation that integrates more cleanly with automated downstream assay pipelines.


Lab Automation In Drug Discovery Market Report Scope and Research Methodology
Market Definition and Coverage
This market covers revenue generated from lab automation systems and related software and services that are used specifically to run and scale drug discovery lab workflows, from early screening through key discovery stage studies.
Scope exclusions: It excludes automation used mainly for clinical diagnostics and routine hospital testing that is not tied to drug discovery work.
Segments Covered in This Report
- By Equipment
- Automated Liquid Handlers
- Automated Plate Handlers
- Robotic Arms
- Automated Storage and Retrieval Systems
- Analyzers
- By Application
- Target Identification and Validation
- Hit-to-Lead
- Lead Optimisation
- High-Throughput Screening
- ADME-Tox Studies
- By End User
- Pharmaceutical Companies
- Biotechnology Companies
- Contract Research Organisations (CROs)
- Academic and Government Labs
- By Geography
- North America
- United States
- Canada
- Mexico
- South America
- Brazil
- Argentina
- Rest of South America
- Europe
- Germany
- United Kingdom
- France
- Italy
- Spain
- Russia
- Rest of Europe
- Asia-Pacific
- China
- Japan
- India
- South Korea
- South-East Asia
- Rest of Asia-Pacific
- Middle East and Africa
- North America
Data Sources, Market Sizing, and Validation
Desk Research
Desk work was used to map the demand pool and the typical equipment mix used across drug discovery labs. We relied on public sources such as the US FDA, NIH, OECD health and science indicators, World Bank macro series, and WIPO patent statistics to understand R and D intensity and automation activity signals.
In parallel, we reviewed annual reports, investor decks, product brochures, and credible press coverage to align on how automation is packaged and sold into discovery workflows. Select paid subscriptions for company financials, news tracking, and patent lookups were also used to cross-check revenue direction and major launches, without leaning on any single dataset. The sources listed here are illustrative only, and other public and paid references were also used to collect, validate, and clarify data points.
Primary Interviews and Surveys
Primary calls and surveys were used to confirm what gets counted as drug discovery automation spend, how pricing is trending, and where budgets are moving by workflow stage. We spoke with a mix of instrument suppliers, software providers, CRO stakeholders, and lab operations leaders across APAC, EMEA, and the Americas. The respondent input then helped us refine assumptions that were unclear from public information alone.
Distribution of primary research fieldwork respondents
| Company type | Respondent position | Region |
|---|---|---|
| Top tier: 39% | CXOs: 15% | APAC: 46% |
| Mid tier: 46% | Functional/Unit leaders: 31% | EMEA: 29% |
| Smaller Players: 15% | Managers: 54% | Americas: 25% |
Market-Sizing & Forecasting
Sizing starts with a top-down reconstruction of the addressable lab workflow spend for drug discovery, where R and D intensity, the active discovery lab base, and the automation penetration across key steps are converted into an annual value pool. To keep the model practical, we used market fingerprints such as high-throughput screening throughput needs, the installed base refresh cycle for automated liquid handlers and plate handlers, typical service attachment rates, and the mix shift toward integrated software and informatics.
After that, selective bottom-up approximations were run as a check, using sampled price bands times unit volumes for commonly deployed systems and a limited roll-up of supplier-reported discovery-related exposure discussed in interviews. Where direct volume visibility was not available, gaps were handled through conservative adoption curves validated by channel feedback, then normalized by region so the totals stayed consistent.
For forecasting, scenario analysis was used around a central case, with drivers like outsourcing intensity to CROs, labor constraint pressure inside labs, AI-enabled workflow adoption, and capital spending cycles influencing the year-by-year trajectory. The final curve was adjusted only after cross-checking the implied growth against these operating indicators, so the forecast remained explainable and repeatable.
Data Validation & Update Cycle
Validation was done through multiple passes where estimates were compared against independent signals like R and D spending direction, patenting activity tied to automation and screening methods, and region level funding cycles. When an outlier showed up, the assumptions were revisited, and experts were re-contacted if the variance could not be explained by mix, pricing, or timing.
Before sign-off, the model and its inputs go through internal analyst review so calculation steps, currency handling, and growth logic stay consistent across regions. Reports are refreshed annually, and interim updates are made when there are material events that can shift demand. Right before delivery, a final check is performed so clients receive the latest updated view.
Mordor Intelligence's Drug Discovery Market Global Lab Automation Market Size Versus Other Published Estimates
Published market values for lab automation in drug discovery can look far apart because each publisher draws the line differently on what counts as automation, which end users are included, and whether services are counted as part of the market or treated separately.
A second reason is that forecast style varies, since some studies bake in aggressive adoption jumps for AI-enabled labs or assume faster instrument replacement, while others use more conservative price and volume progression. Differences also show up from currency conversion timing, whether numbers are reported at manufacturer selling prices or at later channel levels, and how often assumptions are refreshed when new workflow shifts are observed.
Benchmark comparison
| Source | Market Size | Gaps in Research Methodology |
|---|---|---|
| Mordor Intelligence | USD 5.66 B (2025) | |
| Global Publisher A | USD 6.77 B (2025) | Often presented as a factory-gate revenue view that can fold in a wider bundle of related services around screening and data analysis, which can raise the total versus a workflow-scoped spend view. |
| Industry Publisher B | USD 20.69 B (2025) | This figure typically reflects a broader definition that can blend adjacent lab automation used beyond discovery only, and it may also apply more expansive software and informatics inclusion across genomics and proteomics solutions. |
The table shows a clear spread in 2025 values, and in Mordor Intelligence's model the spend is counted only when it is tied to drug discovery workflows (including stages such as screening and ADME-Tox) rather than wider lab automation use cases. Once the scope line is made consistent, the remaining differences are usually explained by service treatment, pricing progression, and how frequently inputs are updated, which is why we keep the calculation steps traceable to a few repeatable drivers.


Key Questions Answered in the Report
What is the current state of lab automation in the drug discovery market as of 2026?
The lab automation in the drug discovery market size is USD 5.90 billion in 2026.
What CAGR is forecast for lab automation platforms through 2031?
From 2026 to 2031, the market expands at a 4.28% CAGR.
Which equipment category holds the largest revenue share?
Automated liquid handlers account for 31.05% of 2025 equipment revenue.
Which application is growing the fastest?
ADME-Tox studies register the highest 5.6% CAGR driven by organ-on-chip adoption.
Which region will post the quickest growth?
The Asia-Pacific region leads with a projected 5.62% CAGR as China and India scale their automated labs.
What factor most restrains adoption among small biotech firms?
High upfront capital expenditure above USD 2 million remains the primary bottleneck.
Page last updated on:


 Your data is secure and never sold or shared.


