HVDC Converter Station Market Size and Share
Market Overview
| Study Period | 2021 - 2031 |
|---|---|
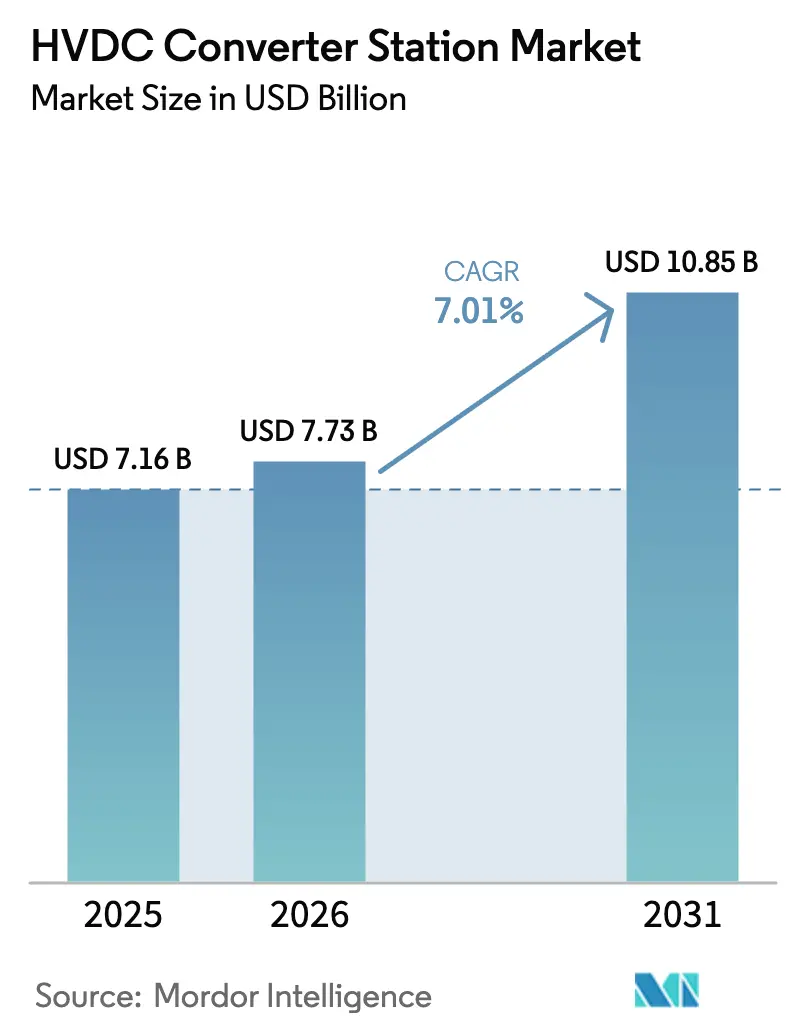
| Market Size (2026) | USD 7.73 Billion |
| Market Size (2031) | USD 10.85 Billion |
| Growth Rate (2026 - 2031) | 7.01% CAGR |
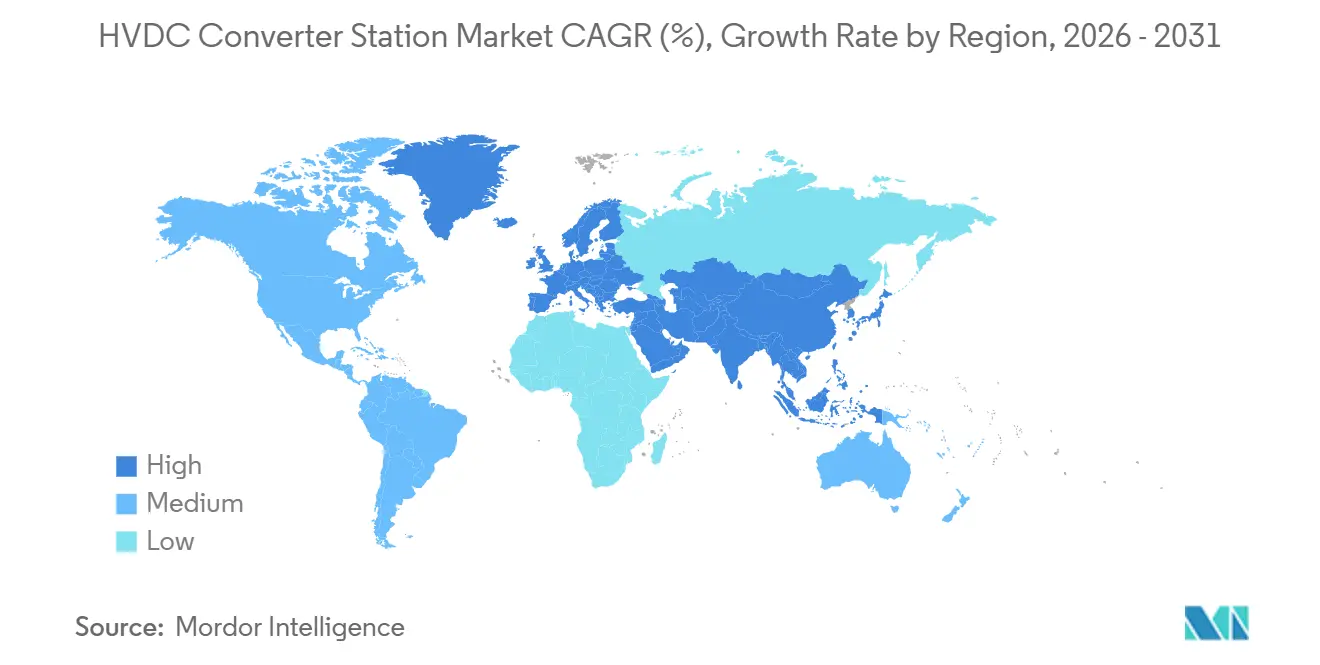
| Fastest Growing Market | Asia Pacific |
| Largest Market | Asia Pacific |
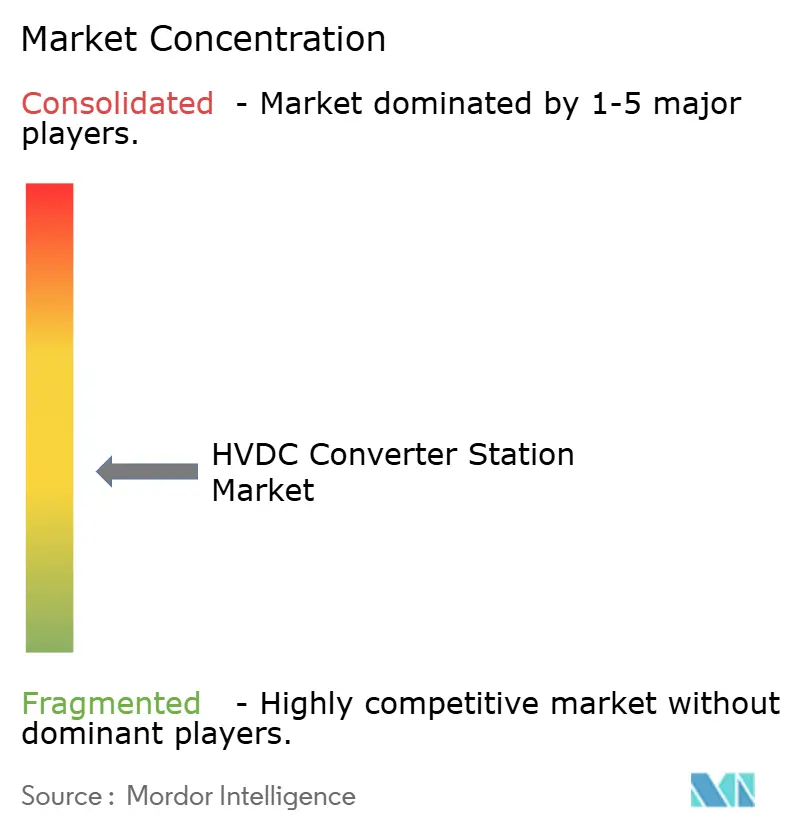
| Market Concentration | Medium |
Major Players *Disclaimer: Major Players sorted in no particular order Image © Mordor Intelligence. Reuse requires attribution under CC BY 4.0. | |
HVDC Converter Station Market Analysis by Mordor Intelligence
The HVDC Converter Station Market size is projected to expand from USD 7.16 billion in 2025 and USD 7.73 billion in 2026 to USD 10.85 billion by 2031, registering a CAGR of 7.01% between 2026 to 2031.
The growing need to move bulk renewable power across long distances without reactive-power losses, the push to integrate far-from-shore wind farms, and rising cross-border interconnectors are keeping capital commitments buoyant. Line-commutated converters remain the default for ultra-high-voltage corridors because of proven ±800 kV performance, yet voltage-source converters are winning offshore and multi-terminal projects for their black-start and grid-forming capabilities. Component revenue is concentrating in valves as utilities pay premiums for press-pack thyristors and IGBT modules that directly influence converter reliability. Asia-Pacific anchors demand with 45 Chinese UHV links already energized, while Europe is setting the technology pace in meshed DC grids. Competitive intensity is ratcheting up as Chinese OEMs bid 20%-30% below Western incumbents, widening technology-versus-price trade-offs.
Key Report Takeaways
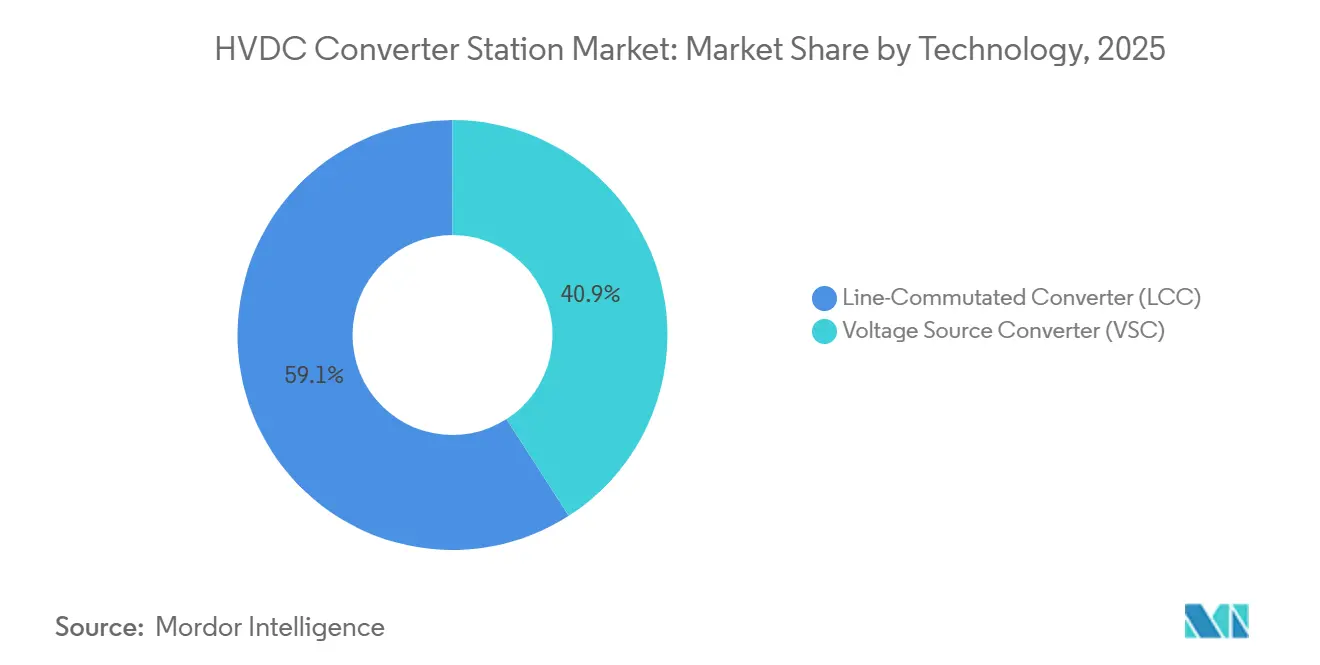
- By technology, line-commutated converters held 59.1% of the HVDC converter stations market share in 2025, while voltage-source converters are forecast to expand at an 8.1% CAGR through 2031.
- By component, valves commanded a 34% share of the HVDC converter stations market size in 2025 and are set to grow at a 7.6% CAGR to 2031.
- By voltage class, the above 800 kV segment is projected to advance at an 8.5% CAGR during 2026-2031.
- By geography, Asia-Pacific accounted for 66.8% revenue in 2025 and is tracking a 7.6% CAGR through 2031.
Note: Market size and forecast figures in this report are generated using Mordor Intelligence’s proprietary estimation framework, updated with the latest available data and insights as of January 2026.
Global HVDC Converter Station Market Trends and Insights
Drivers Impact Analysis*
| Driver | (~) % Impact on CAGR Forecast | Geographic Relevance | Impact Timeline |
|---|---|---|---|
| Surge in offshore-wind HVDC links | +1.8% | Europe, Asia-Pacific (China, Taiwan, Japan), North America (US East Coast) | Medium term (2-4 years) |
| Cross-border renewable interconnections | +1.3% | Europe (TEN-E corridors), ASEAN, South America (Brazil-Argentina), Middle East (GCC grid) | Medium term (2-4 years) |
| Ultra-high-voltage (±800 kV) roll-out in Asia | +1.5% | Asia-Pacific core (China, India), spillover to Central Asia | Long term (≥4 years) |
| Replacement of aging HVAC lines | +0.9% | North America, Europe (Nordic region, Germany), Russia | Long term (≥4 years) |
| Rise of multi-terminal / mesh DC grids | +1.0% | Europe (North Sea Wind Power Hub), Asia-Pacific (China Southern Grid) | Long term (≥4 years) |
| Grid-forming black-start capability demand | +0.6% | Global, with early adoption in Europe (UK, Germany), Australia | Short term (≤2 years) |
| Source: Mordor Intelligence | |||
Surge in offshore-wind HVDC links
Deep-water projects beyond 100 km now rely on HVDC as AC cables face prohibitive reactive losses. Dogger Bank’s first 1.2 GW phase, energized in 2024 with HVDC Light valves, posted 98.5% round-trip efficiency over a 200 km subsea span.[2]Hitachi Energy, “Dogger Bank HVDC Performance,” hitachienergy.com Germany’s 2 GW Ostwind 4, awarded in 2024, uses modular multilevel converters to funnel Baltic wind southward.[3]GE Vernova, “Ostwind 4 Contract Announcement,” ge.com Taiwan’s 5.6 GW offshore roadmap has already triggered three HVDC awards split between Siemens Energy and Hitachi Energy. Japan entered the subsea arena when Tokyo Electric Power ordered a 1 GW link for Choshi in 2025. The North Sea Wind Power Hub aims for a 10 GW meshed platform by 2035, a scale that requires DC breakers now in early commercial rollout.
Cross-border renewable interconnections
The 1.4 GW Viking Link, energized in 2024, enables the UK to import Danish wind during gales and export nuclear baseload during calms, monetizing average 2024 spreads of EUR 45 per MWh.[4]National Grid ESO, “Viking Link Operational Update,” nationalgrideso.com Europe’s TEN-E rule mandating 15% interconnection by 2030 is prompting projects such as NordLink and LionLink. ASEAN targets 17 GW of HVDC corridors by 2035 to arbitrage Laos hydropower and Thai solar, although financing gaps persist. South America’s 1 GW Brazil-Argentina line set for 2028 balances hydropower variability with Patagonian wind. The GCC is evaluating a 3 GW overlay to knit Saudi renewables into UAE load pockets.
Ultra-high-voltage (±800 kV) roll-out in Asia
China commissioned 45 UHV links by late 2024, including the 2,290 km Hami-Chongqing corridor sending 36 TWh of green power eastward each year. The Ningxia-Hunan and Baihetan-Jiangsu 8 GW bipoles cut coal burn in coastal provinces by 22 million tonnes annually. India tendered a ±800 kV, 6 GW line from Rajasthan to Tamil Nadu in 2025. Hitachi Energy’s 2024 Gansu-Zhejiang award will be the first ±800 kV VSC scheme, merging grid-forming controls with UHV power density. UHVDC trims losses to 3% per 1,000 km, and a single ±1,100 kV bipole can haul 12 GW on a narrower right-of-way than an AC equivalent.
Replacement of aging HVAC lines
North America and parts of Europe face congestion on 50-year-old AC corridors whose thermal limits throttle renewable integration. Utilities are evaluating HVDC overlays that add 2-3 GW of transfer capacity using existing rights-of-way, avoiding costly eminent-domain disputes. Russia’s Rosseti is uprating the Siberia-Urals route to ±500 kV to move hydro to industrial clusters.
Restraints Impact Analysis*
| Restraint | (~) % Impact on CAGR Forecast | Geographic Relevance | Impact Timeline |
|---|---|---|---|
| High CAPEX & permitting cycle | -1.2% | Global, acute in North America, Europe (multi-jurisdictional projects), South America | Long term (≥4 years) |
| Converter-component supply bottlenecks | -0.9% | Global, with acute shortages in IGBT wafers (Asia-Pacific supply chain), transformer steel (Europe) | Medium term (2-4 years) |
| Multi-vendor interoperability risk | -0.5% | Europe (meshed grids), Asia-Pacific (cross-border ASEAN projects) | Medium term (2-4 years) |
| Cyber-security of digital HVDC controls | -0.4% | Global, regulatory pressure highest in Europe (IEC 62351), North America (NERC CIP) | Short term (≤2 years) |
| Source: Mordor Intelligence | |||
High CAPEX & Permitting Cycle
A 2 GW, 1,000 km bipolar link costs USD 2 billion-USD 2.5 billion, half of which is converter stations, deterring utilities with constrained balance sheets. The U.S. Plains & Eastern line secured federal approval in 2016, yet remains unbuilt due to state-level opposition. Europe’s LionLink spent four years in environmental review before its 2025 consent. Brazil-Argentina negotiations over wheeling charges pushed in-service targets from 2027 to 2028. Multilateral banks often become anchor financiers because merchant developers struggle to secure investment-grade ratings without regulated returns.
Converter-component supply bottlenecks
IGBT and transformer supply chains lengthened lead times to 24 months in 2025. Siemens Energy’s Erlangen transformer plant is running at 95% utilization, and ramp-up requires EUR 150 million and three years. China controls 60% of grain-oriented electrical steel, spurring Western OEMs to diversify to Indian and South Korean mills.
*Our forecasts treat driver/restraint impacts as directional, not additive. The impact forecasts reflect baseline growth, mix effects, and variable interactions.
Segment Analysis
By Technology: VSC Gains on Grid-Forming Demand
Voltage-source converters are forecast to grow at an 8.1% CAGR, faster than the overall HVDC converter stations market, as offshore wind developers and grid planners seek black-start, fast-fault-clearing, and multi-terminal features. Line-commutated converters held 59.1% of the HVDC converter stations market share in 2025 because China’s bulk-transfer corridors rely on ±800 kV thyristor stacks that minimize losses over 2,000 km routes.
Dogger Bank’s 3.6 GW link uses 401-level MMC valves that meet a total harmonic distortion benchmark below 1.5% without filters. Siemens Energy’s East Anglia THREE implementation demonstrates the same grid-forming agility within 200 milliseconds of a blackout. Hitachi Energy’s Gansu-Zhejiang ±800 kV VSC project will test whether voltage-source converters can match UHV power density and erode LCC’s historical cost edge. GE Vernova is exploring hybrid topologies that merge LCC efficiency with VSC controllability, though commercial rollout remains at least three years away.


By Component: Valve Complexity Drives Revenue Concentration
Valves captured 34% of 2025 component revenue and will grow at a 7.6% CAGR, reflecting the weight utilities place on switching devices that determine reliability and footprint. HVDC converter stations market size for valve systems is expanding as higher voltage classes require more series-connected devices with robust cooling.
A ±800 kV LCC tower contains up to 500 thyristors rated 8.5 kV, 4 kA, and redundancy adds 10% to cost. VSC valves run at 1-2 kHz, demanding liquid cooling worth USD 15 million-USD 20 million per station. Converter transformers account for roughly 25% of station cost and face long order backlogs. Reactors and filters represent up to 20% of LCC sites, whereas VSC platforms often skip them. Prysmian’s 525 kV P-Laser cable achieves 2.6 GW power density, enabling single-cable bipoles that cut installation costs by 30%.
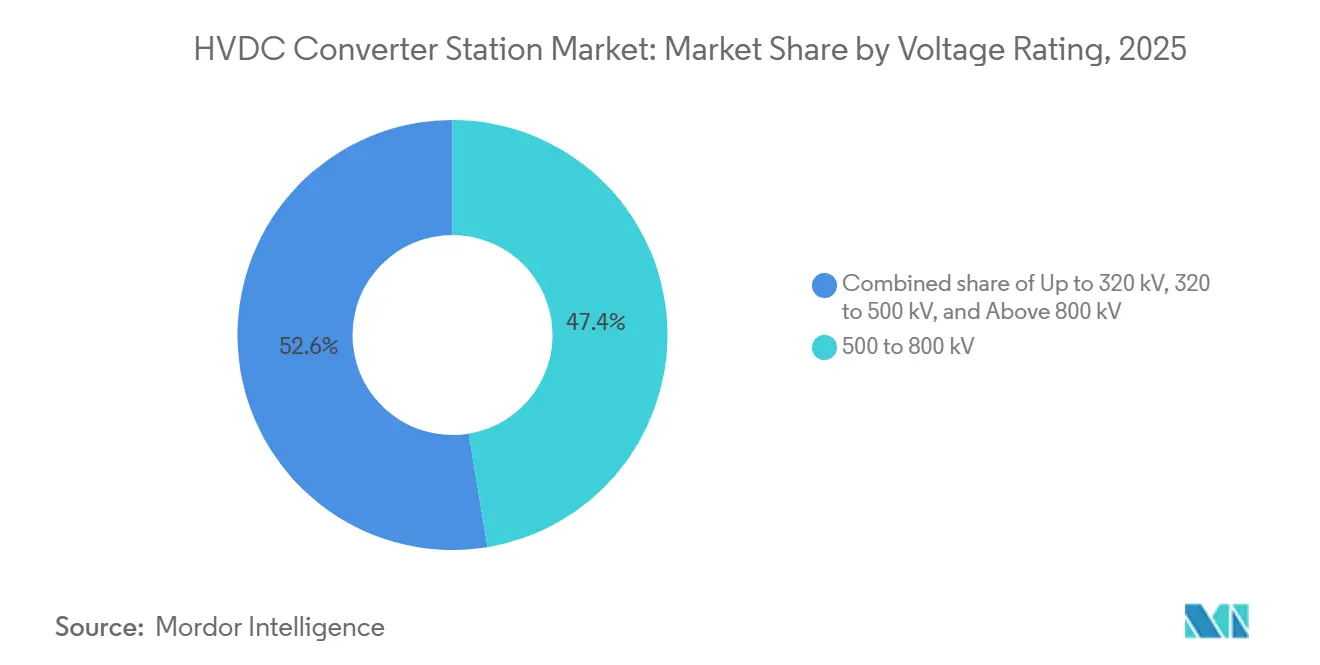
By Voltage Rating: UHVDC Emerges as Asia’s Standard
The 500-800 kV class held 47.4% of the HVDC converter stations market share in 2025 because it balances conductor cost with converter complexity. Above 800 kV is projected to rise at an 8.5% CAGR as China rolls ±1,100 kV schemes into commercial service.
China’s Changji-Guquan ±1,100 kV link, energized in 2024, shifted 12 GW over 3,300 km with only 2.5% losses. India is studying ±800 kV for its 1,800 km solar corridor, where UHVDC would slash right-of-way width. European offshore schemes still favor ±320 kV to ±525 kV VSC, such as East Anglia THREE and Viking Link. UHVDC’s USD 1.2 million per MW capex slows uptake outside Asia, but grid-forming VSC at ±800 kV may close the gap by trimming filter and reactive-compensation costs.
Geography Analysis
Asia-Pacific accounted for 66.8% of the HVDC converter stations market value in 2025 and is tracking a 7.6% CAGR to 2031. China aims to transmit 1,000 TWh of west-wind and hydro to coastal loads by 2030, implying 30 more ±800 kV corridors and USD 50 billion investment. India’s Green Energy Corridor Phase II adds a ±800 kV, 6 GW Rajasthan-Tamil Nadu link plus a ±500 kV Lakshadweep VSC interconnector. Japan’s 1 GW Choshi subsea line entered service in 2025, signaling a wider 10 GW offshore wind target. South Korea and ASEAN members are moving more slowly as financing and sovereignty issues delay final investment decisions.
Europe represented around 20% of the 2025 converter spend, but leads VSC innovation. The UK’s Dogger Bank, East Anglia THREE, and Sea Link total 7 GW of capacity under HVDC Light or Plus platforms. Denmark’s Bornholm hub will anchor a 3 GW meshed grid in the Baltic by 2030. GE Vernova’s Ostwind 4 contract marks re-entry into offshore HVDC. Nordic interconnectors such as Viking Link and NordLink let countries arbitrage renewables across weather patterns.
North America is accelerating planning but still faces seven-to-ten-year permitting cycles. Grain Belt Express secured all approvals in 2024 for a 4 GW Kansas-Indiana line scheduled for 2028 using HVDC Light. Canada’s 300 MW Montana link and Mexico’s proposed 2 GW Baja-Mexico City corridor illustrate region-wide interest. South America’s Brazil-Argentina interconnector heads toward 2028 while Chile tenders a 500 MW northern solar link. Middle East projects remain nascent, although Saudi Arabia’s 58.7 GW renewable pipeline will likely need a 3 GW HVDC overlay by 2032.

Competitive Landscape
Hitachi Energy, Siemens Energy, and GE Vernova held roughly 60%-65% of 2025 order intake, yet Chinese players NR Electric, C-EPRI, and Xian XD are expanding abroad with 20%-30% price discounts. Hitachi Energy disclosed a USD 4.2 billion HVDC backlog covering Dogger Bank, Gansu-Zhejiang, and North Sea links. Siemens Energy booked USD 3.8 billion across Bornholm, East Anglia THREE, and Middle Eastern schemes. GE Vernova’s USD 1.4 billion Ostwind 4 award ends a four-year hiatus from offshore HVDC.
NR Electric won a 500 MW VSC link in Southeast Asia in 2025, underpricing Western bids by 25%, though IEC 62351 compliance questions limit traction in Europe. Hitachi Energy and Siemens Energy remain the only vendors with proven 400 kV, 9 kA hybrid DC breakers, causing a bottleneck that can delay meshed projects six to twelve months. Prysmian and Nexans dominate subsea cable supply, while Mitsubishi and Toshiba partner on 8.5 kV thyristors for China’s ±1,100 kV schemes.
HVDC Converter Station Industry Leaders
Hitachi Energy
Siemens Energy
GE Grid Solutions
Prysmian Group
Mitsubishi Electric
- *Disclaimer: Major Players sorted in no particular order

Recent Industry Developments
- January 2026: Hitachi Energy has received contracts from SSEN Transmission to deliver high-voltage direct current (HVDC) converter stations for two subsea cable links in northern Scotland.
- December 2025: GE Vernova Inc. has secured its inaugural HVDC refurbishment contract in India. The company's Electrification Systems division will revamp the pivotal 1,000 MW HVDC link at Chandrapur.
- October 2025: ScottishPower Renewables, a British subsidiary of Iberdrola, has successfully installed the high-voltage direct current (HVDC) marine converter station at the East Anglia THREE wind farm.
- October 2025: ScottishPower Renewables has received its largest-ever high voltage direct current (HVDC) offshore converter station, delivered by Aker Solutions, for the East Anglia THREE project.


Global HVDC Converter Station Market Report Scope
HVDC Converter Stations serve as specialized substations, converting electricity between High Voltage Alternating Current (AC) and High Voltage Direct Current (DC). These stations act as terminals for HVDC transmission lines, facilitating efficient bulk power transfers over long distances. They also bridge grids operating at different frequencies. Utilizing power electronic valves, these stations switch AC to DC (a process known as rectification) and revert DC to AC (inversion).
The global HVDC converter station market is segmented by technology, component, voltage rating, and geography. By technology, the market is segmented into voltage source converter (VSC) and line-commutated converter (LCC). By component, the market is segmented into valves, converters, transformers, harmonic filters, reactors, and others. By voltage rating, the market is segmented into up to 320 kV, 320-500 kV, 500-800 kV, and above 800 kV. The report also covers the market size and forecasts for the global HVDC converter station market across the major regions. The market size and forecasts for each segment have been done based on revenue (USD).
| Voltage Source Converter (VSC) |
| Line-Commutated Converter (LCC) |
| Valves |
| Converters Transformers |
| Harmonic Filter |
| Reactor |
| Others |
| Up to 320 kV |
| 320 to 500 kV |
| 500 to 800 kV |
| Above 800 kV (UHVDC) |
| North America | United States |
| Canada | |
| Mexico | |
| Europe | Germany |
| United Kingdom | |
| France | |
| Spain | |
| Italy | |
| NORDIC Countries | |
| Russia | |
| Rest of Europe | |
| Asia-Pacific | China |
| India | |
| Japan | |
| South Korea | |
| ASEAN Countries | |
| Australia and New Zealand | |
| Rest of Asia-Pacific | |
| South America | Brazil |
| Argentina | |
| Chile | |
| Rest of South America | |
| Middle East and Africa | Saudi Arabia |
| United Arab Emirates | |
| South Africa | |
| Egypt | |
| Rest of Middle East and Africa |
| By Technology | Voltage Source Converter (VSC) | |
| Line-Commutated Converter (LCC) | ||
| By Component | Valves | |
| Converters Transformers | ||
| Harmonic Filter | ||
| Reactor | ||
| Others | ||
| By Voltage Rating | Up to 320 kV | |
| 320 to 500 kV | ||
| 500 to 800 kV | ||
| Above 800 kV (UHVDC) | ||
| By Geography | North America | United States |
| Canada | ||
| Mexico | ||
| Europe | Germany | |
| United Kingdom | ||
| France | ||
| Spain | ||
| Italy | ||
| NORDIC Countries | ||
| Russia | ||
| Rest of Europe | ||
| Asia-Pacific | China | |
| India | ||
| Japan | ||
| South Korea | ||
| ASEAN Countries | ||
| Australia and New Zealand | ||
| Rest of Asia-Pacific | ||
| South America | Brazil | |
| Argentina | ||
| Chile | ||
| Rest of South America | ||
| Middle East and Africa | Saudi Arabia | |
| United Arab Emirates | ||
| South Africa | ||
| Egypt | ||
| Rest of Middle East and Africa | ||


Key Questions Answered in the Report
How large is the HVDC converter station market in 2031?
The HVDC converter station market size is projected to reach USD 10.85 billion in 2031 from USD 7.73 billion in 2026.
Which technology is growing fastest within converter stations?
Voltage-source converters are expanding at an 8.1% CAGR to 2031 thanks to black-start, grid-forming, and multi-terminal advantages favored by offshore wind developers.
Why does Asia-Pacific dominate global HVDC spending?
China's rollout of 45 operational UHV corridors and India's new ±800 kV links push Asia-Pacific to 66.8% of 2025 revenue and a 7.6% regional CAGR through 2031.
What is the main cost barrier to new HVDC projects?
Turnkey capital can reach USD 2 billion for a 2 GW, 1,000 km line, while permitting often stretches beyond seven years in multi-jurisdictional corridors.
Which component faces the biggest supply bottleneck?
IGBT valves and custom converter transformers now carry lead times of up to 24 months due to limited semiconductor wafer and electrical-steel capacity.
How concentrated is vendor competition?
A market concentration score of 6 reflects that the top three players hold roughly two-thirds of orders, yet price-competitive Chinese OEMs are gaining share.
Page last updated on:


