Healthcare BI Market Size and Share
Market Overview
| Study Period | 2020 - 2031 |
|---|---|
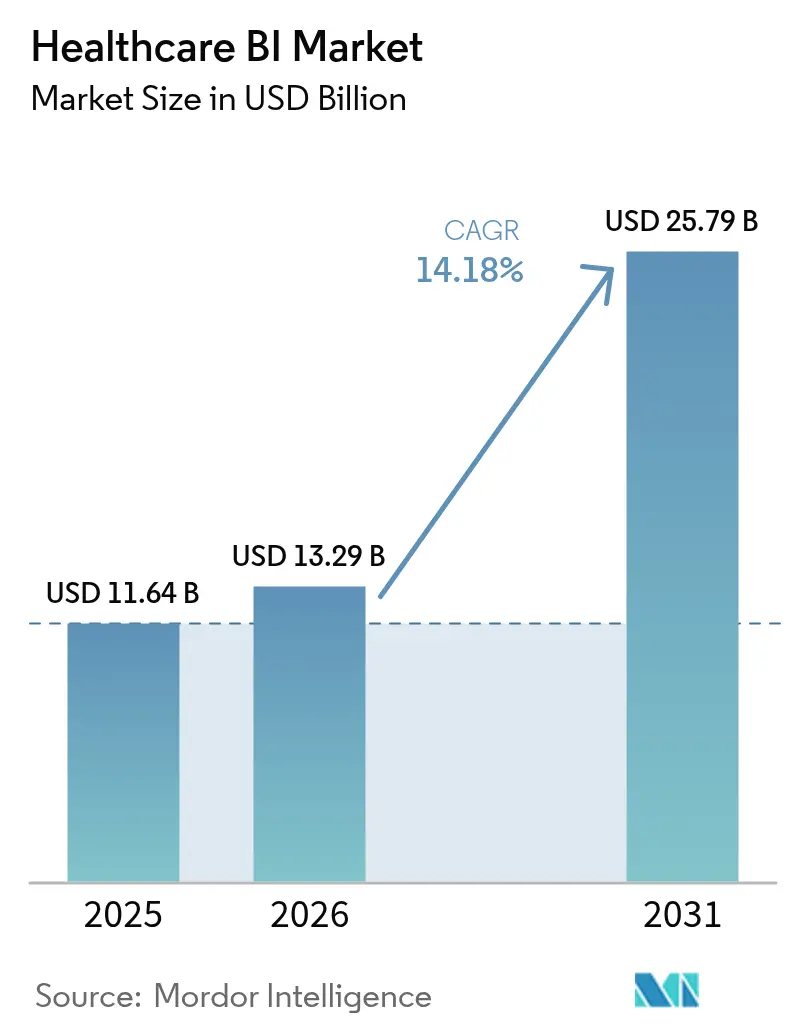
| Market Size (2026) | USD 13.29 Billion |
| Market Size (2031) | USD 25.79 Billion |
| Growth Rate (2026 - 2031) | 14.18% CAGR |
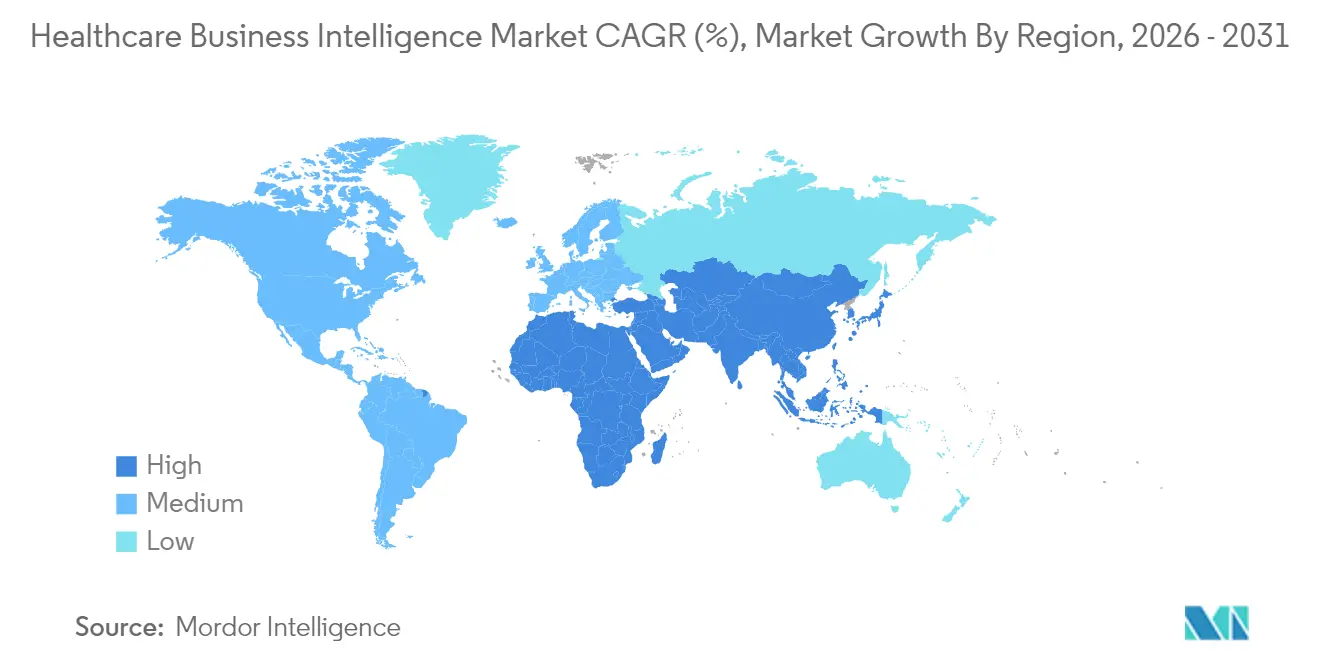
| Fastest Growing Market | Asia Pacific |
| Largest Market | North America |
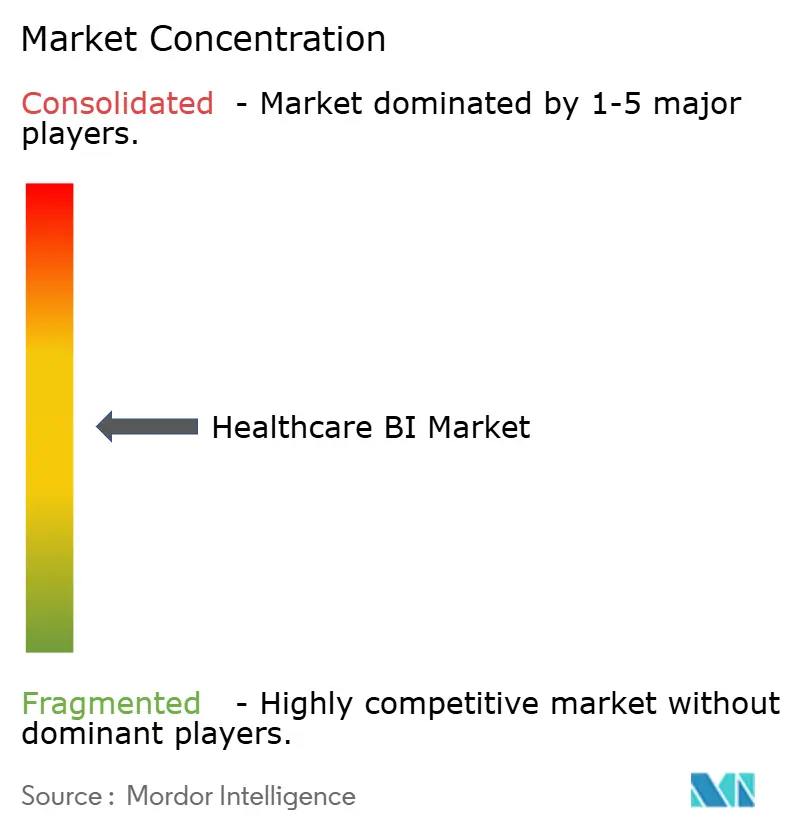
| Market Concentration | Medium |
Major Players *Disclaimer: Major Players sorted in no particular order Image © Mordor Intelligence. Reuse requires attribution under CC BY 4.0. | |
Healthcare BI Market Analysis by Mordor Intelligence
Global demand for data-driven healthcare operations is expanding rapidly.
Healthcare business intelligence market size in 2026 is estimated at USD 13.29 billion, growing from 2025 value of USD 11.64 billion with 2031 projections showing USD 25.79 billion, growing at 14.18% CAGR over 2026-2031. Robust growth reflects a confluence of regulatory mandates for value-based reimbursement, a surge in electronic health record (EHR) data, cloud cost-efficiencies, and the accelerating use of generative AI across clinical and administrative workflows. Health systems are investing heavily to turn fragmented data into actionable insights as 90% of Medicare payments link to value in 2025, while private payers push similar contracts. Rising cloud adoption underpins scale; hospitals now spend an average of USD 38 million each year on cloud services—more than any other industry vertical. At th.e same time, AI-led automated insight generation captured 60% of healthcare AI investment in 2024, indicating that analytic platforms with embedded AI have become a strategic priority healthcare.digital. Together, these drivers position the healthcare business intelligence market as one of the fastest-growing segments of digital health.
Key Report Takeaways
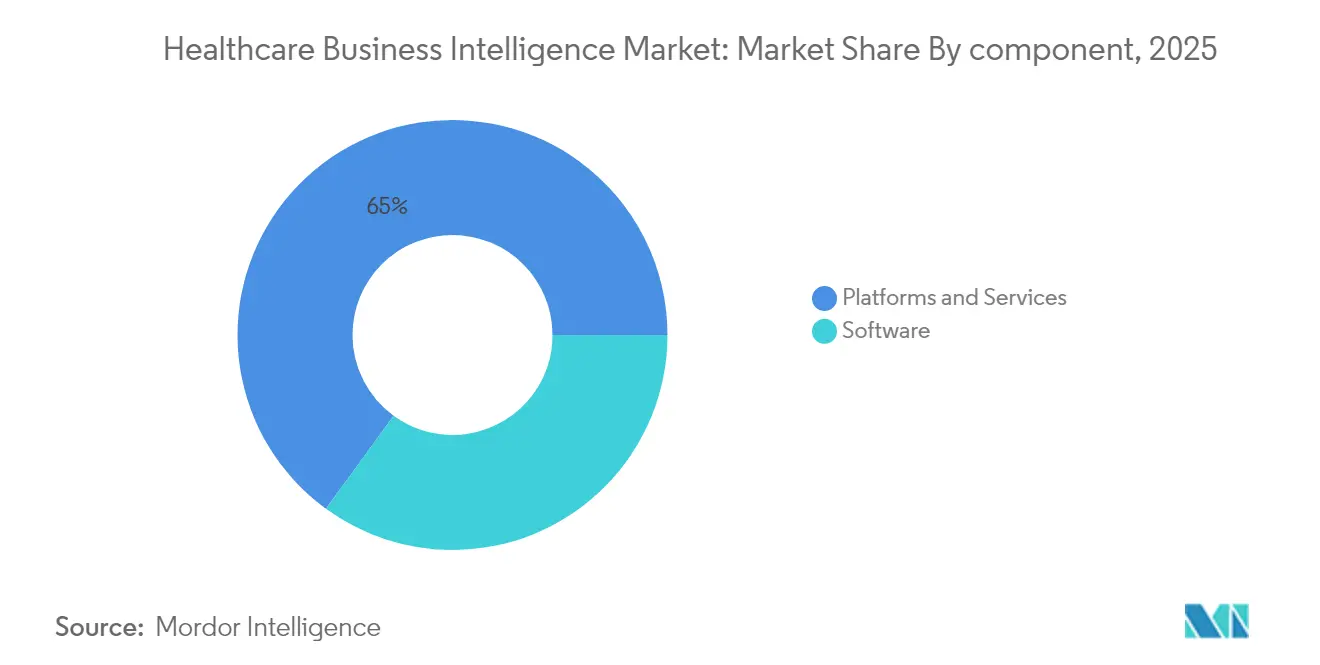
- By component, software retained 35.02% revenue share of the healthcare business intelligence market in 2025, while services recorded the highest CAGR at 14.52% through 2031.
- By function, OLAP & visualization led with 40.88% of the healthcare business intelligence market share in 2025; advanced & predictive analytics is projected to grow at a 15.01% CAGR.
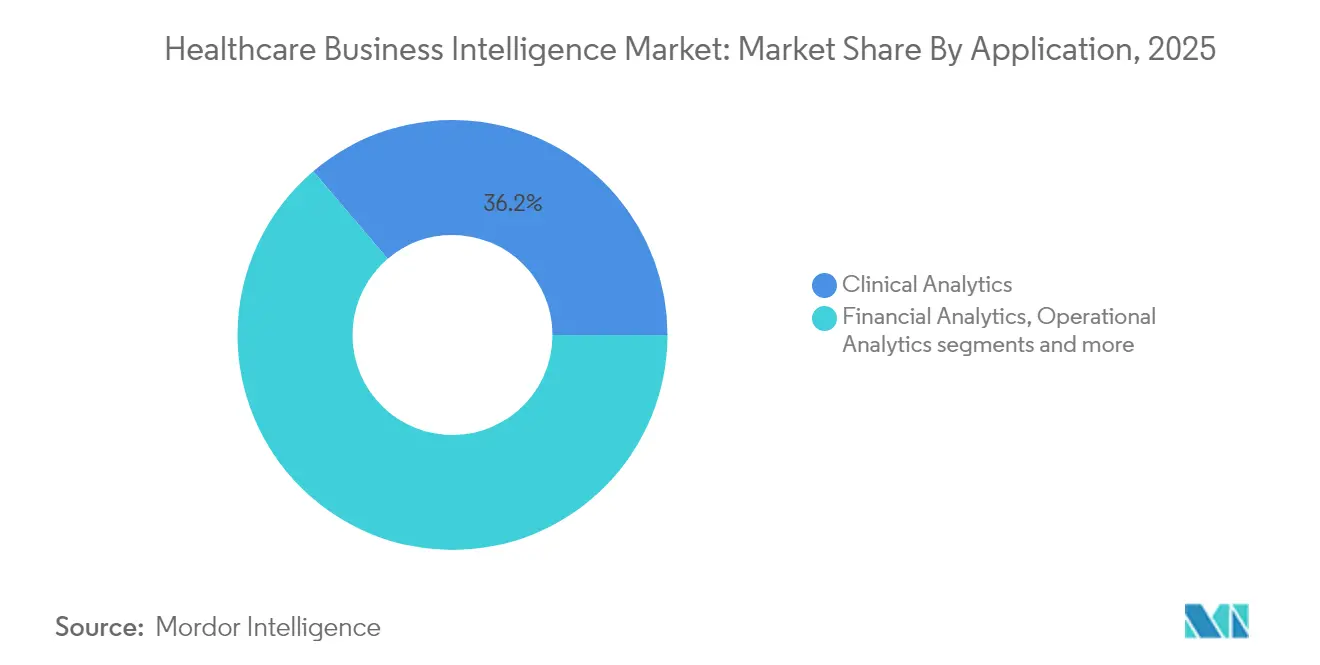
- By application, clinical analytics commanded 36.21% share of the healthcare business intelligence market size in 2025; operational analytics is advancing at a 15.54% CAGR.
- By end user, healthcare providers held 51.95% of the healthcare business intelligence market share in 2025, whereas life-science companies are forecast to expand at a 15.92% CAGR to 2031.
- By geography, North America captured 45.97% of the healthcare business intelligence market share in 2025; Asia-Pacific is expected to post the fastest 16.61% CAGR through 2031.
Note: Market size and forecast figures in this report are generated using Mordor Intelligence’s proprietary estimation framework, updated with the latest available data and insights as of 2026.
Global Healthcare BI Market Trends and Insights
Drivers Impact Analysis*
| Driver | (~) % Impact on CAGR Forecast | Geographic Relevance | Impact Timeline |
|---|---|---|---|
| Regulatory push for value-based reimbursement | +3.2% | Global, with North America leading | Medium term (2-4 years) |
| Rising EHR data volume & interoperability mandates | +2.8% | North America & EU, expanding to APAC | Long term (≥ 4 years) |
| Cloud cost-efficiencies enabling analytics at scale | +2.1% | Global, with faster adoption in developed markets | Short term (≤ 2 years) |
| AI-led automated insight generation (Gen-AI) | +3.5% | Global, with concentration in tech-advanced regions | Medium term (2-4 years) |
| FHIR-based real-time data streaming adoption | +1.8% | North America & EU primarily | Long term (≥ 4 years) |
| Availability of synthetic healthcare data sets | +1.2% | Global, with regulatory variations | Medium term (2-4 years) |
| Source: Mordor Intelligence | |||
Regulatory Push for Value-Based Reimbursement
Policies linking payments to outcomes are now mainstream. The Centers for Medicare & Medicaid Services intends to place all Medicare beneficiaries in accountable care relationships by 2030, a goal echoing across commercial payers. Organizations require near real-time analytics that synthesize clinical, financial, and social-determinant data to manage at-risk populations and predict performance under complex contracts. Health systems such as Carle Health have cut avoidable costs while boosting quality by integrating claims, EHR, and social-risk data in their BI stack. As every payment model embeds risk, demand for platforms capable of continuous measurement and predictive modeling will intensify.
Rising EHR Data Volume & Interoperability Mandates
Epic’s Cosmos now aggregates de-identified records from 246 million individuals, illustrating the unprecedented scale of healthcare data. The 21st Century Cures Act and TEFCA oblige providers to share information, yet less than 60% of available data informs decision-making because of fragmentation. Adoption of Fast Healthcare Interoperability Resources (FHIR) streams data in near real time, laying a technical foundation for advanced analytics[1]Source: U.S. Department of Health and Human Services, “FHIR Ecosystem,” healthit.gov . Tackling data quality, standardization, and governance remains essential as volumes soar.
Cloud Cost-Efficiencies Enabling Analytics at Scale
Forty-five percent of United States hospitals have migrated supply-chain applications to the cloud, while satisfaction with cloud projects reaches 72% among healthcare executives. One academic center achieved 95% cost savings after moving from a mainframe to a cloud platform and simultaneously improved data accessibility for regulators. Microsoft’s healthcare cloud revenue now exceeds USD 42 billion with 22% annual growth, underscoring provider appetite for scalable, subscription-based analytics. Such savings allow even midsize systems to deploy enterprise-grade BI without capital outlays.
AI-Led Automated Insight Generation (Gen-AI)
Eighty-five percent of healthcare leaders are piloting or deploying generative AI, largely to automate documentation and coding workflows. Administrative AI absorbed 60% of healthcare AI investment in 2024, reflecting immediate cost-reduction potential healthcare.digital. Microsoft’s Dragon Copilot already processes 9.5 million encounters per quarter and continues to scale. Epic will release more than 100 AI features, moving from simple prompts toward decision support for patient engagement. Such deployments elevate expectations for self-service analytics and natural language queries inside BI portals.
Restraints Impact Analysis*
| Restraint | (~) % Impact on CAGR Forecast | Geographic Relevance | Impact Timeline |
|---|---|---|---|
| Data silos & legacy interoperability gaps | -2.5% | Global, with acute challenges in fragmented markets | Long term (≥ 4 years) |
| High total cost of ownership for enterprise BI | -1.8% | Global, with greater impact on smaller organizations | Medium term (2-4 years) |
| Shortage of data-literate clinical staff | -1.4% | Global, with regional variations in severity | Long term (≥ 4 years) |
| Cross-border data-transfer & AI-governance risks | -1.1% | EU, APAC primarily, expanding globally | Medium term (2-4 years) |
| Source: Mordor Intelligence | |||
Data Silos & Legacy Interoperability Gaps
Disconnected systems delay care and inflate costs despite FHIR and Cures Act mandates. Many hospitals still grapple with proprietary data formats and aging architectures that block enterprise-wide analytics. Competitive concerns and privacy rules further slow data-sharing outside organizational walls. Overcoming silos will require continued investment in integration engines, master-data management, and cultural change.
High Total Cost of Ownership for Enterprise BI
Comprehensive BI programs necessitate licensing, migration, training, and upkeep that strain budgets. Hospital groups often underestimate hidden costs tied to data-quality initiatives and advanced-analytics talent. Smaller providers face additional hurdles because 56% of committed cloud spend may go unutilized without proactive governance. Pay-as-you-go models help, yet organizations must continuously refine utilization to realize promised savings.
*Our forecasts treat driver/restraint impacts as directional, not additive. The impact forecasts reflect baseline growth, mix effects, and variable interactions.
Segment Analysis
By Component: Services Drive Implementation Success
Software held the largest 35.02% share of the healthcare business intelligence market in 2025, anchored by analytics suites, visualization dashboards, and embedded AI services. However, services—covering integration, training, and managed analytics—are expanding at a 14.52% CAGR, outpacing platform sales. This divergence signals that value lies not just in owning tools but in operationalizing them within complex clinical workflows.
Organizations rely on external experts to migrate legacy data, customize dashboards, and coach users. The acute shortage of data-literate clinicians sustains services demand. Epic’s move into enterprise resource planning underscores that large platform vendors now package consulting to accelerate adoption. As systems mature, services partners will manage ongoing data governance, performance tuning, and algorithm validation, reinforcing their role as critical enablers of analytic ROI.


By Function: Advanced Analytics Accelerates Growth
OLAP & visualization accounted for 40.88% of 2025 revenue, offering intuitive dashboards for day-to-day monitoring across finance, quality, and compliance. Yet advanced & predictive analytics is projected to grow 15.01% annually as providers pursue proactive care.
Health Catalyst clients have saved millions through early detection algorithms and risk stratification models. Generative AI further lowers the barrier to sophisticated modeling by automating feature engineering and scenario testing. Microsoft’s USD 13 billion AI run rate illustrates demand for packaged frameworks that embed machine learning into the analytic fabric. As algorithms mature, organizations will transition from retrospective reporting toward prospective intervention planning in population health and precision medicine.
By Application: Operational Analytics Gains Momentum
Clinical analytics remains the largest application at 36.21% share in 2025, underpinning quality improvement, readmission reduction, and care-pathway optimization. Operational analytics now logs the fastest 15.54% CAGR as leaders confront supply-chain volatility and workforce shortages.
Hospitals adopt RFID and IoT sensors to capture real-time inventory data, then model consumption patterns for predictive restocking. Microsoft and Medline’s Mpower tool exemplifies AI-driven supply-chain optimization that pre-emptively flags disruptions. Workforce modules forecast staffing needs based on infection trends and patient acuity, helping mitigate burnout and overtime. Because operational performance directly affects margins under value-based contracts, analytic focus is shifting beyond clinical metrics.
By End User: Life Sciences Accelerates Adoption
Healthcare providers commanded 51.95% of 2025 revenue, as hospitals continue to invest in unified data platforms for clinical, financial, and regulatory reporting. Life-science companies, however, are slated for a 15.92% CAGR.
Drug developers exploit real-world evidence from provider networks to optimize trial design, accelerate recruitment, and monitor safety in near real time cdisc.org. FHIR pipelines simplify extraction of longitudinal patient data, feeding AI models that refine target populations. SAS’s alliance with Duke Health shows academic-industry collaboration around shared analytic environments . Meanwhile, payers deepen investments in risk-adjustment analytics as reimbursement grows more complex, while public-health agencies modernize surveillance dashboards for pandemic preparedness.
Geography Analysis
North America led with a 45.97% share of the healthcare business intelligence market in 2025, fueled by mature EHR penetration, mandated interoperability, and early adoption of value-based care. Epic’s base of more than 325 million patient records entrenches its influence on regional data flows. Legislative clarity, coupled with robust cloud infrastructure, speeds enterprise analytics rollouts. Anticipated pro-business policies may accelerate private-equity activity, intensifying competition and innovation in BI tooling.
Asia-Pacific is the fastest-growing region at a 16.61% CAGR to 2031, reflecting aggressive national digital-health plans and rising healthcare spending. India’s insurance-funded models demand population-health insights, while Singapore integrates IoT devices for preventive monitoring. Governments in China, Australia, and Thailand fund AI pilots to manage chronic-disease burdens amid aging populations. Even developing markets are leapfrogging legacy systems by adopting cloud-native platforms, creating outsized opportunities for scalable BI vendors.
Europe shows steady expansion as GDPR drives investment in compliant data governance and cross-border interoperability. Programs like the European Health Data Space encourage standardized analytics across member states, boosting vendor opportunities. Middle East and Africa, though starting from lower bases, invest heavily in EHRs and telemedicine, especially in Gulf Cooperation Council nations. Modernization initiatives align with the need to benchmark quality outcomes, suggesting a gradual rise in BI penetration.

Regulatory Landscape
In the United States, healthcare BI deployments are increasingly shaped by federal interoperability and certification policy alongside evolving digital health oversight. ONC/ASTP moved HTI-5 through its public process in 2026, with the comment period closing on February 27, 2026, positioning the Health IT Certification Program toward streamlined requirements and AI-enabled interoperability. In parallel, ONC announced the 2026 Standards Version Advancement Process (SVAP) cycle, approving newer standards such as HL7 FHIR US Core Implementation Guide STU 9.0.0 for use in certified systems, supporting faster uptake of current FHIR versions in production analytics pipelines.
In Europe, the European Health Data Space (EHDS) Regulation (EU) 2025/327 entered into force in 2025, creating a long implementation runway for primary and secondary data use that raises the importance of privacy-by-design analytics, data governance, and cross-border interoperability. Governance structures advanced in 2026 with Implementing Regulation (EU) 2026/771 published on April 7, 2026, establishing the European Health Data Space Board to coordinate member-state execution. Separately, FDA updated final guidance in January 2026 for General Wellness and Clinical Decision Support software, clarifying enforcement discretion criteria for software functions that provide specific recommendations, which influences how analytics and AI-driven decision support are positioned and validated.
Competitive Landscape
Market concentration remains moderate, with Epic Systems holding effectively shaping integration standards for many BI projects. Microsoft pairs Azure, Nuance, and OpenAI services to deliver ambient documentation and predictive insights, achieving a USD 13 billion healthcare AI run rate. Oracle’s 2025 alliance with Cleveland Clinic and G42 introduces a global AI delivery platform, signaling rising competition among cloud giants.
Vendor strategies increasingly feature vertical integration of AI with existing clinical workflows. Epic’s 100-plus upcoming AI tools and expansion into ERP underscore efforts to own the full operational stack. Meanwhile, specialized entrants such as Innovaccer, valued at USD 3.2 billion, differentiate through low-code data engineering and CRM capabilities tailored to population health. Consolidation continues: HEALWELL acquired Orion Health for HIE leadership, and MedeAnalytics joined SubPop Health to build integrated performance analytics.
White-space opportunities center on operational analytics and cross-industry data networks. Supply-chain visibility, workforce optimization, and patient-experience benchmarking present gaps where niche providers can thrive. Yet implementation complexity means that single-vendor ecosystems may gain favor, accelerating partnerships among platform players, device makers, and health systems seeking end-to-end solutions.
Healthcare BI Industry Leaders
Microsoft Corporation
IBM Corporation
Oracle Corporation
SAP SE
SAS Institute Inc.
- *Disclaimer: Major Players sorted in no particular order

Market Opportunities and Future Outlook
Administrative and clinical workflow digitization programs that mandate standardized data exchange are creating near-term whitespace for BI vendors that can operationalize FHIR-based data streams into usable performance, utilization, and workflow insights. In the United States, CMS and ONC advanced proposed technical requirements in April 2026 for APIs supporting electronic prior authorization and broader clinical and administrative data exchange, referencing HL7 FHIR Da Vinci implementation guides. This pushes demand toward analytics platforms that can ingest and normalize FHIR payloads at scale and deliver measurable improvements in throughput, denials management, and care coordination across providers and payers.
Targeted public funding and standards acceleration also open opportunities for services-led implementations, integration tooling, and governance layers that reduce total cost of ownership while improving data quality. ONC released a fiscal year 2026 Notice of Funding Opportunity for Leading Edge Acceleration Projects (LEAP) in Health IT totaling up to USD 2 million in cooperative agreement awards, aimed at addressing interoperability barriers that frequently block enterprise analytics. ONC also published the 2026 SVAP cycle findings enabling certified developers to adopt approved updated standards starting August 29, 2026, which supports commercial rollouts of newer FHIR-aligned capabilities without waiting for a full certification overhaul, benefiting vendors that package upgrade paths, validation, and monitoring for multi-version interoperability.
Recent Industry Developments
- June 2026: NHS England entered an agreement with Microsoft to deploy Microsoft 365 Copilot, Copilot Studio, and agent governance tooling across 505,000 clinicians and support staff. The deployment scales everyday productivity and workflow automation in a large public health system, reinforcing demand for secure, governed AI-enabled analytics experiences integrated with collaboration tools.
- August 2025: Oracle introduced a voice-first, AI-driven Oracle Health EHR for United States ambulatory providers. The move embeds automation and decision support closer to the point of care, raising expectations for BI layers that can unify EHR, financial, and operational data for near-real-time reporting and optimization.
- January 2026: FDA released final guidance clarifying enforcement discretion criteria for General Wellness and Clinical Decision Support software. The guidance informs how analytics and AI-enabled decision support are positioned and validated, shaping validation approaches and vendor-developer responsibilities. This update aligns with broader analytics governance and interoperability efforts across health IT ecosystems.


Research Methodology Framework and Report Scope
Market Definition and Coverage
This market covers business intelligence (BI) solutions used in healthcare to collect, combine, and analyze clinical, financial, and operational data, so decisions can be made faster and with better visibility. It includes BI software platforms and related services that support reporting, dashboards, and analytics for healthcare settings.
Scope exclusions: Standalone data warehouse hardware and generic enterprise BI tools that do not have healthcare-specific data models are excluded.
Segmentation Overview
- By Component
- Platforms
- Software
- Services
- By Function
- OLAP & Visualisation
- Performance Management
- Query & Reporting
- Advanced & Predictive Analytics
- By Application
- Clinical Analytics
- Population Health Management
- Precision Medicine Support
- Quality & Outcome Improvement
- Financial Analytics
- Revenue Cycle Management
- Fraud Detection & Risk Adjustment
- Operational Analytics
- Supply-Chain & Inventory Optimisation
- Staffing & Workflow Optimisation
- Strategic Planning & Benchmarking
- Clinical Analytics
- By End User
- Healthcare Providers
- Hospitals & Health Systems
- Ambulatory Surgical Centres
- Specialty Clinics
- Payers
- Public Payers
- Private Payers
- Life-Science Companies
- Government & Public-Health Agencies
- Other End Users (ACOs, CROs)
- Healthcare Providers
- By Region
- North America
- United States
- Canada
- Mexico
- South America
- Brazil
- Argentina
- Rest of South America
- Europe
- Germany
- United Kingdom
- France
- Italy
- Spain
- Russia
- Rest of Europe
- Asia-Pacific
- China
- Japan
- India
- South Korea
- Australia
- Rest of Asia-Pacific
- Middle East and Africa
- GCC
- South Africa
- Rest of Middel East and Africa
- North America
Data Sources, Market Sizing, and Validation
Desk Research
Desk research was used to set the market boundaries, build the first set of adoption assumptions, and create a regional view of healthcare digital maturity. We referenced public sources such as the World Health Organization, the World Bank, OECD health statistics, and government health IT and digital health publications, which helped us align on health system size, spending context, and policy direction.
To turn that context into sizing inputs, we also reviewed items such as company annual reports, investor presentations, reputable press coverage, and association websites discussing healthcare informatics and analytics. In a few places, we relied on paid subscriptions for company financial intelligence, news and financials tracking, and patent databases, mainly to cross-check revenue exposure and product focus. The sources listed here are illustrative only, and many other materials were also used for collection, validation, and clarification.
Primary Interviews and Surveys
Primary work was used to confirm what buyers actually purchase under healthcare BI and how budgets and deployments are shifting between on-premises and cloud setups. We spoke with a mix of solution providers, system integrators, hospital and clinic IT leaders, and payer-side analytics users across APAC, EMEA, and the Americas, and then the feedback was used to adjust adoption assumptions, pricing ranges, and replacement cycles.
Where desk research was thin, interviews helped us validate conversion factors, such as how much BI spending sits inside broader analytics budgets, and what share of revenue is services versus software in typical projects.
Distribution of primary research fieldwork respondents
| Company type | Respondent position | Region |
|---|---|---|
| Top tier: 36% | CXOs: 14% | APAC: 50% |
| Mid tier: 50% | Functional/Unit leaders: 35% | EMEA: 31% |
| Smaller Players: 14% | Managers: 51% | Americas: 19% |
Market-Sizing & Forecasting
Sizing starts with a top-down demand pool build using healthcare digitalization signals, and then the revenue tied to BI use cases is reconstructed by region based on adoption and spending intensity. In practice, the model is anchored on variables such as EHR and data-integration penetration, provider and payer IT spend direction, cloud migration pace for analytics workloads, typical BI license and subscription pricing, and services attach rates for implementation and ongoing support.
Once the regional totals are built, we use selective bottom-up approximations to keep the numbers realistic, including supplier revenue exposure checks, sampled average selling price multiplied by likely seat counts or facility counts, and channel feedback on project sizes. When a country-level datapoint is missing, we fill gaps with proxy indicators, such as comparable health system structure and similar digital health policy maturity, and then stress-test the assumption in follow-up calls.
For forecasting, scenario analysis is used so growth can be expressed under a base case and sensitivity cases that reflect budget tightening or faster cloud adoption. The year-by-year path is adjusted using interview-led expectations on renewal cycles, new module adoption, and pricing progression, rather than assuming a straight-line CAGR.
Data Validation & Update Cycle
Outputs are checked against independent signals, such as regional healthcare IT spend direction and the observed pace of analytics adoption in provider and payer workflows, and then variances are reviewed before sign-off. If any region shows an unusual jump, the drivers are re-opened, assumptions are recalculated, and targeted re-contacts are triggered to confirm whether the shift is real or just a data artifact.
Before publication, the model and narratives go through multi-step analyst reviews so inputs, calculations, and scope logic stay consistent from section to section. Reports are refreshed annually, and interim updates are made when material events change demand, pricing, or deployment behavior. Right before delivery, a fresh pass is completed so clients receive the most current view available at that time.
Mordor Intelligence's Global Healthcare Bi Market Market Size Versus Other Published Estimates
Published market sizes for healthcare BI can look different even when the titles sound similar, since each study draws the line around what counts as BI spending and what is treated as adjacent analytics or infrastructure. Differences also come from how pricing is handled across licenses, subscriptions, and services, and from whether the model is updated to reflect shifts tied to cloud migration.
Standalone data warehouse hardware sits outside Mordor Intelligence's scope, so estimates that bundle infrastructure and BI platforms together can land higher even in the same year. Another recurring gap is embedded analytics inside EMR environments, since some sources count it automatically, whereas we only count it when it is sold and priced as a separate BI module. That single rule can move totals across regions. Currency conversion timing and the choice of base year also matter, especially when vendors report in mixed currencies and healthcare IT budgets are being reprioritized.
Benchmark comparison
| Source | Market Size | Gaps in Research Methodology |
|---|---|---|
| Mordor Intelligence | USD 13.29 B (2026) | |
| Global Consultancy A | USD 11.20 B (2025) | Uses an earlier base year and applies a broad CAGR path without re-checking the current mix shift toward cloud subscriptions and services attach rates, which can depress the near-term value. |
| Industry Publisher B | USD 11.50 B (2025) | Often bundles BI with a wider set of healthcare analytics functions and may count embedded EMR dashboards as BI by default, which changes what is captured as paid BI revenue versus internal tooling. |
The comparison indicates that most of the variation comes from scope inclusions and from how pricing and mix shifts are carried through the model year by year. By tying the total to observable BI purchase patterns, and by re-checking key assumptions with interviews, the final value stays easier to trace back to clear steps and repeatable inputs.


Key Questions Answered in the Report
What is the size of the healthcare business intelligence market in 2026?
The market is valued at USD 13.29 billion in 2026.
How fast is the healthcare business intelligence market expected to grow?
It is projected to expand at a 14.18% CAGR between 2026 and 2031.
Which region currently holds the largest share of the healthcare business intelligence market?
North America accounts for 45.97% of global revenue in 2025
Which is the fastest growing region in Healthcare BI Market?
Asia Pacific is estimated to grow at the highest CAGR over the forecast period (2026-2031).
Why is value-based reimbursement a major growth driver for healthcare BI platforms?
Because 90% of Medicare payments are already tied to value metrics, providers need advanced analytics to manage risk and measure outcomes .
How quickly is the Asia-Pacific healthcare business intelligence market expanding?
Asia-Pacific is forecast to grow at a 16.61% CAGR through 2031
Page last updated on:


