Gums Market Size and Share
Market Overview
| Study Period | 2021 - 2031 |
|---|---|
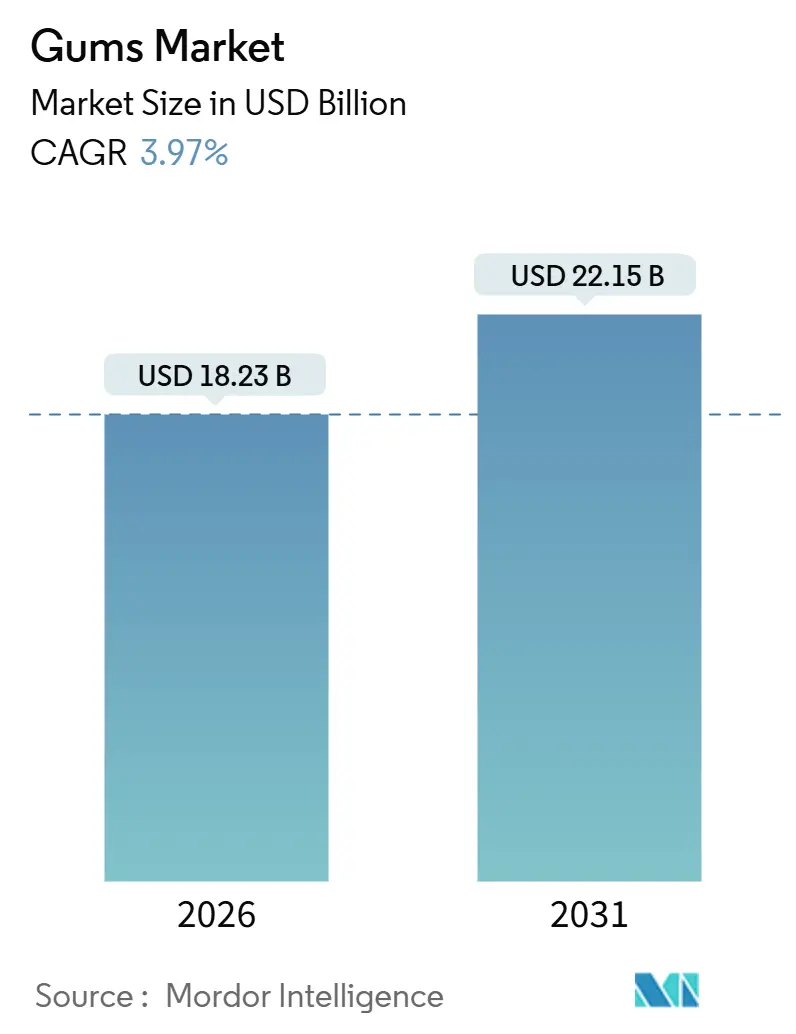
| Market Size (2026) | USD 18.23 Billion |
| Market Size (2031) | USD 22.15 Billion |
| Growth Rate (2026 - 2031) | 3.97% CAGR |
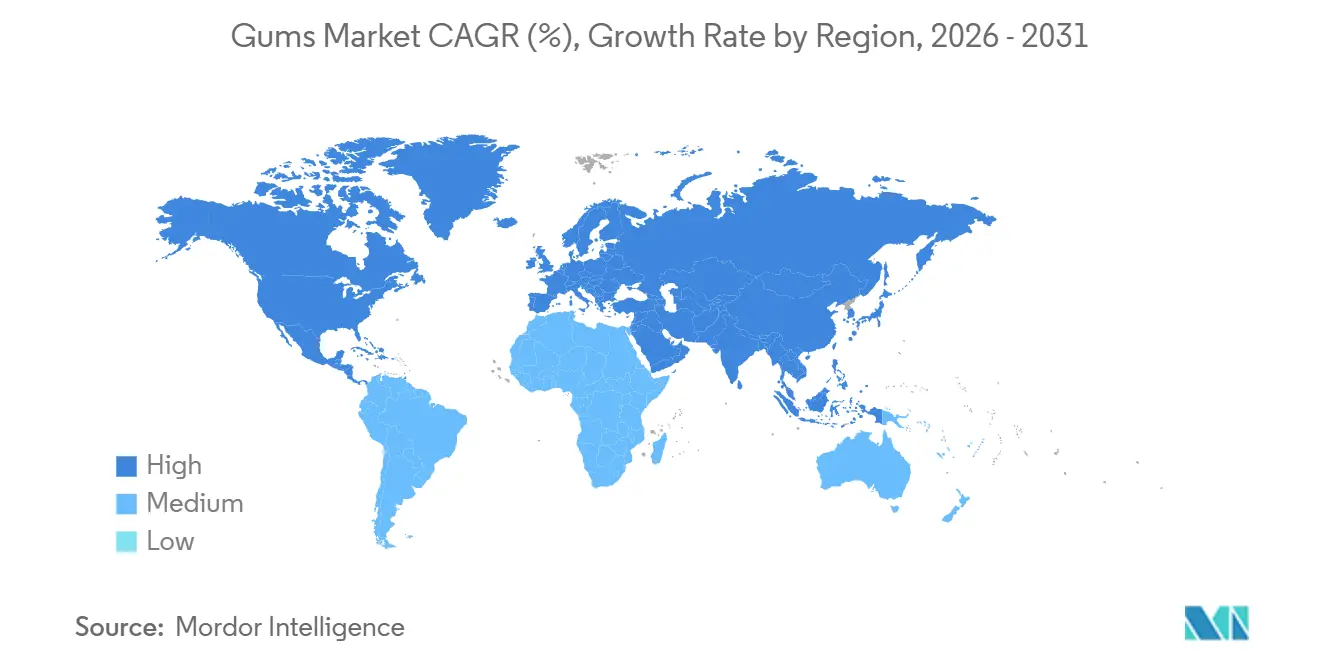
| Fastest Growing Market | North America |
| Largest Market | Asia Pacific |
| Market Concentration | High |
Major Players*Disclaimer: Major Players sorted in no particular order Image © Mordor Intelligence. Reuse requires attribution under CC BY 4.0. | |
Gums Market Analysis by Mordor Intelligence
The gums market size is USD 18.23 billion in 2026 and is projected to reach USD 22.15 billion by 2031, registering a 3.97% CAGR over the forecast period. Growth is propelled by sugar-free and functional variants that cater to oral-care and wellness trends, while conventional sugared formats lose favor amid regulatory scrutiny and rising health consciousness. Flavor innovation, premium limited editions, and viral social-media activation further stimulate trial, whereas raw-material inflation and labeling mandates weigh on manufacturer margins. Regional dynamics diverge: North America maintains leadership in value, but Asia-Pacific delivers the fastest gains as localized flavors and modern retail ecosystems expand. Competitive intensity stays high because a few global confectioners command shelf space, R&D pipelines, and marketing budgets.
Key Report Takeaways
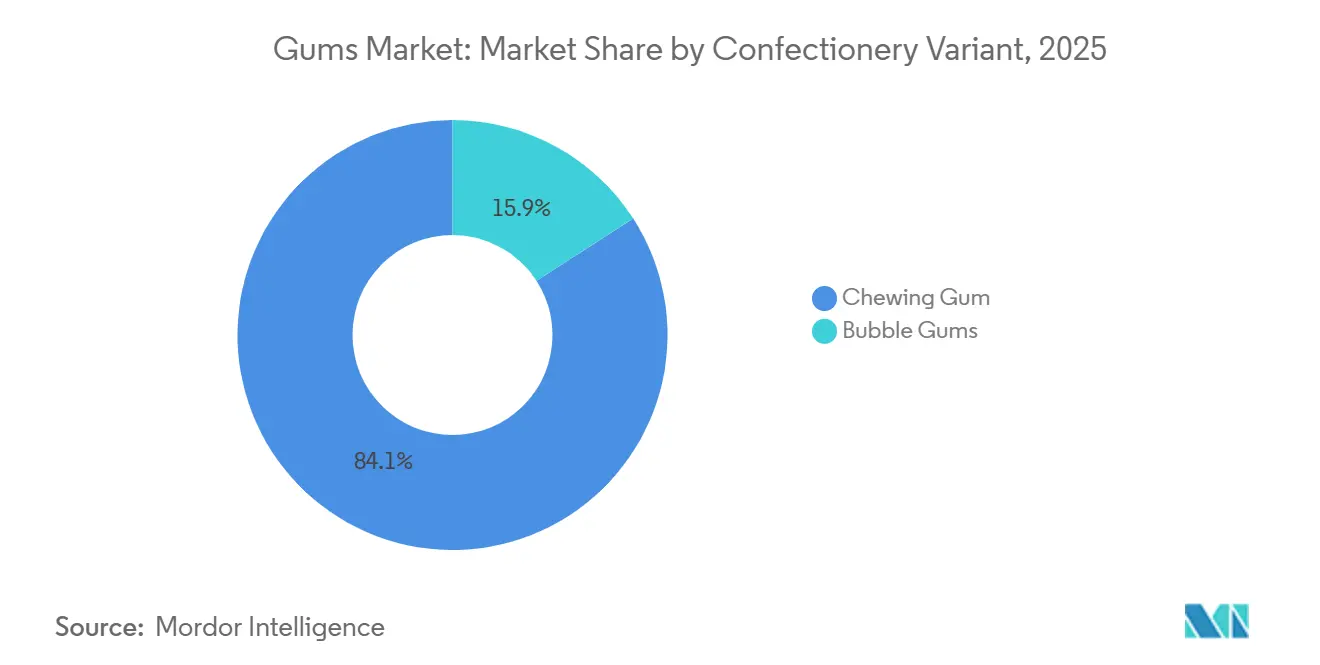
- By confectionery variant, chewing gums held 84.12% of the chewing gum market share in 2025, while bubble gums are forecast to expand at a 5.68% CAGR through 2031.
- By sugar content, sugar gums accounted for 56.27% of the chewing gum market size in 2025, whereas sugar-free gums are advancing at a 6.05% CAGR to 2031.
- By packaging format, blister packs dominated with 45.21% revenue share in 2025; stick packs are projected to grow at a 5.81% CAGR to 2031.
- By geography, North America led with 34.85% revenue share in 2025; Asia-Pacific is poised for the fastest 5.38% CAGR through 2031.
Note: Market size and forecast figures in this report are generated using Mordor Intelligence’s proprietary estimation framework, updated with the latest available data and insights as of January 2026.
Global Gums Market Trends and Insights
Drivers Impact Analysis*
| Drivers | (~) % Impact on CAGR Forecasts | Geographic Relevance | Impact Timeline |
|---|---|---|---|
| Surging Demand for Sugar-Free and Functional Gums | +1.2% | Global, with peak adoption in North America and Europe | Medium term (2-4 years) |
| Flavor Innovations Like Tropical Fruits, Nostalgic Bubblegum, and Dessert-Inspired Variants | +0.8% | Global, strongest in Asia-Pacific and North America | Short term (≤ 2 years) |
| E-Commerce and Viral Social Media Marketing | +0.6% | Global, led by North America, Europe, and urban Asia-Pacific | Short term (≤ 2 years) |
| Health Consciousness Rising, With Consumers Favoring Oral Care Options | +0.9% | Global, particularly North America and Europe | Medium term (2-4 years) |
| Premiumization Via Limited-Edition, Seasonal, and Cross-Category Flavors | +0.4% | North America, Europe, and affluent Asia-Pacific metros | Medium term (2-4 years) |
| Sustainability Shifts Toward Recyclable, Plant-Based Gum Bases and Packaging | +0.3% | Europe (strongest), North America, and select Asia-Pacific markets | Long term (≥ 4 years) |
| Source: Mordor Intelligence | |||


Surging Demand for Sugar-Free and Functional Gums
Sugar-free gums are being repositioned as oral-health aids rather than simple confections, reflecting a strategic shift supported by regulatory approvals and clinical research. The European Food Safety Authority has confirmed that xylitol-sweetened chewing gum can reduce the risk of dental caries when consumed after meals[1]Source: European Food Safety Authority, “Scientific Opinion on the Substantiation of Health Claims Related to Sugar-Free Chewing Gum Sweetened With Xylitol,” EFSA Journal, efsa.europa.eu. This validation provides manufacturers with a health claim that distinguishes sugar-free products from traditional options. Functional gum variants now include ingredients such as caffeine, B vitamins, and probiotics. In 2024, Mars Wrigley introduced RESPAWN gum, featuring green tea extract and B vitamins, aimed at gamers seeking improved focus. Similarly, Chinese brand Suifafood launched a ginseng herbal gum, marketed for its digestive and immune health benefits. As consumers increasingly view gum as a vehicle for wellness ingredients rather than a discretionary indulgence, the category's growth rate has exceeded that of the overall market. This trend is particularly notable in North America and Europe, where aging populations and a focus on preventive health are driving demand for convenient, low-calorie functional products.
Flavor Innovations Like Tropical Fruits, Nostalgic Bubblegum, and Dessert-Inspired Variants
Flavor differentiation has become a primary battleground as incumbents seek to arrest volume declines and recruit younger consumers. Mondelez introduced Ice Breakers Flavor Shifters in 2024, a dual-flavor format that transitions from one taste profile to another during chewing, while Mars rolled out EXCEL Refreshers in July 2024, featuring watermelon-raspberry and other fruit combinations designed to evoke summer nostalgia. Perfetti Van Melle launched Mentos Discovery in 2024 with 14 distinct flavors in a single pack, encouraging trial and social sharing, and followed with Mentos Sour Gum and Mentos Vitamin Gum to capture adjacent wellness and novelty segments. These launches reflect a broader industry recognition that traditional mint and spearmint profiles no longer suffice to drive repeat purchase among Gen Z, who prioritize sensory variety and Instagrammable packaging. Dessert-inspired variants, such as salted caramel, tiramisu, and matcha latte, are gaining traction in Asia-Pacific, where café culture and premium positioning command higher price points. The innovation cadence has accelerated: major brands now cycle limited-edition SKUs quarterly rather than annually, compressing product lifecycles but sustaining shelf presence and media buzz.
E-Commerce and Viral Social Media Marketing
Digital channels are reshaping how gum brands reach consumers, with social media virality and direct-to-consumer e-commerce emerging as growth levers that bypass traditional retail gatekeepers. Mars committed over USD 50 million in the first half of 2024 to the "Chew You Good" platform, deploying AR Snapchat lenses, TikTok content, and localized Instagram campaigns across more than 70 markets to reposition gum as a daily ritual for consumers aged 25 and under. The campaign's "Mind Mouth" hero films and "Chewtopia" visual identity were designed to generate earned media and user-generated content, a strategy validated by case studies in adjacent categories: a Walgreens private-label gummy candy sold out within days in 2024 after a TikTok video demonstrating its "peelable" texture garnered 8.9 million views, illustrating how viral moments can drive rapid inventory depletion and prompt SKU extensions. Smaller brands like Simply Gum leverage direct-to-consumer websites with subscription models offering 10% discounts and free shipping, capturing margin that would otherwise accrue to retail intermediaries and enabling real-time consumer feedback loops that inform flavor development. Online retail's share of gum sales remains modest but is expanding faster than brick-and-mortar, particularly in markets with high smartphone penetration and established last-mile delivery infrastructure.
Health Consciousness Rising, With Consumers Favoring Oral Care Options
Oral-health positioning is migrating from niche to mainstream as consumers seek convenient alternatives to traditional dental-care routines and regulators validate specific claims. The FDA redefined "healthy" nutrient-content claims in 2024, establishing thresholds that favor sugar-free formulations and incentivizing reformulation across the confectionery sector[2]Source: U.S. Food and Drug Administration, “Front-of-Package Nutrition Labeling Final Rule,” fda.gov. Simultaneously, the FDA finalized front-of-package labeling rules in 2025, requiring clearer disclosure of added sugars and artificial ingredients, which advantage sugar-free gums that can display positive nutrient symbols. Clinical evidence supports the oral-care narrative: peer-reviewed studies confirm that xylitol-sweetened gum reduces Streptococcus mutans colonization and stimulates saliva flow, mitigating caries risk when chewed after meals. Manufacturers are amplifying these claims through on-pack callouts and partnerships with dental associations, positioning sugar-free gum as a complement to brushing and flossing rather than a standalone indulgence. This health halo extends to functional gums marketed for smoking cessation, stress relief, and cognitive enhancement, though regulatory scrutiny is intensifying around unsubstantiated wellness claims. The UK Food Standards Agency updated food additive regulations in 2024, tightening approval pathways for novel functional ingredients and requiring more robust clinical evidence for health claims, a precedent likely to influence other jurisdictions.
Restraint Impact Analysis*
| Restraints | (~) % Impact on CAGR Forecasts | Geographic Relevance | Impact Timeline |
|---|---|---|---|
| Declining Sales of Sugared Sums due to Sugar Aversion and Health Regulations | -0.9% | Global, most acute in North America and Europe | Medium term (2-4 years) |
| Shifting Consumer Preferences Toward Healthier Alternatives | -0.6% | Global, led by developed markets | Short term (≤ 2 years) |
| Regulatory Pressures on Sugar/Artificial Ingredient Labeling | -0.4% | North America, Europe, and select Asia-Pacific markets | Medium term (2-4 years) |
| Rising Raw Material Costs for Gum Base, Sweeteners, and Flavors | -0.7% | Global, with acute impact in emerging markets | Short term (≤ 2 years) |
| Source: Mordor Intelligence | |||
Declining Sales of Sugared Gums Due to Sugar Aversion and Health Regulations
Traditional sugar-containing gums are losing ground as health policies and consumer attitudes converge against added-sugar consumption. A March 2024 Fortune article reported that U.S. gum unit sales in 2023 were approximately 32% lower than in 2018, driven in part by Gen Z's preference for sour gummies and other confections perceived as more indulgent or novel. Sugar taxes and front-of-package labeling mandates are accelerating the shift: the FDA's 2025 front-of-package labeling rule requires prominent disclosure of added sugars, effectively penalizing sugary gums at the point of purchase. Mexico, the world's second-largest gum consumer, implemented an 8% special tax on products exceeding 257 kcal per 100 g in 2014, prompting manufacturers to prioritize sugar-free innovation and reformulation. Mondelez's decision to divest its developed-market gum business in 2023 was partly driven by a structural decline in sugared-gum volumes, which no longer justified the capital allocation required to compete in a category facing secular headwinds. Sugar-free gums now command premium pricing and shelf space, leaving sugared variants relegated to value tiers and shrinking distribution footprints.
Rising Raw Material Costs for Gum Base, Sweeteners, and Flavors
Input-cost inflation is squeezing margins in a category with limited pricing power. USDA sugar outlook reports for 2024 and 2025 document elevated global sugar prices driven by adverse weather in key producing regions (Brazil, India, Thailand) and supply-chain disruptions, raising sweetener costs for manufacturers, according to the United States Department of Agriculture[3]Source: U.S. Department of Agriculture, “World Sugar Outlook 2024-25,” ers.usda.gov. Gum-base polymers, polyisobutylene, and polyvinyl acetate are petroleum derivatives subject to crude-oil price volatility, while the natural chicle supply is constrained by labor shortages and forest regeneration cycles. Flavor compounds and specialty sweeteners (xylitol, stevia) have also seen price increases as demand from functional-food and beverage categories outpaces supply. Manufacturers have limited ability to pass costs through to consumers: gum is an impulse purchase with high price elasticity, and retailers resist price increases that could depress turns in a low-margin category. Lotte Wellfood raised prices on 17 products by approximately 12% in 2024 in response to cocoa and input-cost pressures, a move that risked volume loss but was deemed necessary to preserve profitability. Smaller players lacking scale in procurement face even steeper margin compression, accelerating consolidation and favoring vertically integrated incumbents.
*Our forecasts treat driver/restraint impacts as directional, not additive. The impact forecasts reflect baseline growth, mix effects, and variable interactions.
Segment Analysis
By Confectionery Variant: Bubble Gums Gain on Nostalgia and Novelty
Chewing gums accounted for 84.12% of the confectionery-variant segment in 2025, reflecting established consumer habits and wide SKU availability across channels. However, bubble gums are projected to grow at a 5.68% CAGR through 2031, surpassing chewing gums by over 140 basis points, as brands capitalize on nostalgic flavors and social-media-driven viral trends to attract younger consumers. Perfetti Van Melle's Mentos Discovery, launched in 2024 with 14 flavors in a single pack, illustrates the approach of maximizing trial and shareability, while Mars Wrigley's Extra Refreshers introduced watermelon-raspberry and other fruit combinations designed to evoke summer nostalgia. Bubble gums benefit from tactile differentiation, the ability to blow bubbles, which appeals to Gen Z's preference for experiential and Instagrammable products. Meanwhile, chewing gums are shifting toward functional positioning (caffeine, vitamins, oral health) to retain market share, with Mars launching RESPAWN gum in 2024 to target gamers and Mentos introducing Vitamin Gum to attract wellness-focused consumers. The segment's growth divergence highlights a strategic split: chewing gums must justify higher price points through functional claims, while bubble gums can maintain volume through novelty and flavor variety.
Traditional mint and spearmint profiles continue to dominate chewing-gum sales, but their share is declining as tropical, dessert-inspired, and sour variants gain shelf space. Mondelez's Ice Breakers Flavor Shifters, which transition from one flavor to another during chewing, exemplify efforts to introduce novelty into the chewing-gum format without compromising the breath-freshening core benefit. Bubble gums face the opposite challenge: preserving flavor intensity and bubble-forming properties while incorporating functional ingredients that appeal to health-conscious parents buying for children. The segment's performance is also influenced by distribution: bubble gums perform strongly in convenience stores and small-format retail, where impulse purchases and child-focused merchandising drive sales, while chewing gums dominate in supermarkets and hypermarkets, where adult consumers purchase multi-packs and sugar-free options. Regulatory trends favor chewing gums: health claims for xylitol-sweetened products are easier to validate for adult-oriented SKUs than for bubble gums marketed to children, which face stricter advertising regulations and scrutiny over sugar content.


By Sugar Content: Sugar-Free Surge Reshapes Category Economics
Sugar-free gums are expected to grow at a CAGR of 6.05% through 2031, outpacing the overall market by more than 200 basis points. In contrast, sugar gums, which held a 56.27% share in 2025, are projected to decline structurally. This divergence is driven by multiple factors, including health regulations (such as FDA front-of-package labeling and sugar taxes in Mexico and other markets), clinical evidence supporting xylitol's oral-health benefits, and a consumer shift toward low-calorie options. The European Food Safety Authority's (EFSA) confirmation that xylitol-sweetened gum reduces dental caries risk provides a regulatory advantage for sugar-free products, which sugar-containing gums cannot replicate. Additionally, sugar-free gums typically command a premium price, 15-25% higher than sugared alternatives, allowing manufacturers to offset the higher costs of sweeteners like xylitol and stevia while expanding margins. Mondelez's decision to divest its developed-market gum business in 2023 was partly influenced by the capital investment required to reformulate and reposition sugared brands in a market where sugar-free options are increasingly becoming the norm.
Sugar gums maintain a majority share due to established consumption habits in emerging markets, where price sensitivity limits the adoption of sugar-free products and regulatory frameworks are less developed compared to mature markets. For instance, in Mexico, the world's second-largest gum consumer, per capita consumption reached approximately 0.5 kg annually. Mondelez operates the world's largest gum factory in Puebla, producing 60,000 tonnes per year, with 60-70% sold domestically. However, Mexico's 2014 confectionery tax (8% on products exceeding 257 kcal per 100 g) led to a 4-5% decline in sector volume, prompting manufacturers to introduce small, low-cost sugar-free packs to sustain growth. A similar trend is observed in the Asia-Pacific region, where rising disposable incomes and the expansion of modern retail networks are driving sugar-free premiumization in urban areas. Meanwhile, rural and lower-income consumers continue to favor sugared gums in single-stick formats priced for daily affordability. The segment's future depends on sweetener cost trends: if xylitol and stevia prices decrease due to scaling and agricultural advancements, sugar-free gums could achieve price parity with sugared variants by 2028, accelerating the shift. Conversely, if cost disparities persist, the market will likely remain bifurcated, with sugar-free gums dominating premium channels and sugared gums retaining their hold on value segments.
By Packaging Format: Stick Packs Ride On-the-Go Convenience
Blister packs held 45.21% of the packaging-format segment in 2025, benefiting from shelf visibility, portion control, and protection against moisture and contamination. Yet stick packs are forecast to grow at 5.81% CAGR through 2031, driven by on-the-go convenience and single-serve portability that align with post-pandemic mobility patterns. Stick packs, typically containing 5-15 pieces in a slim, pocketable format, over-index in convenience stores, gas stations, and impulse channels where consumers prioritize grab-and-go ease over bulk value. Mars Wrigley Australia's USD 6.5 million capacity expansion, completed in April 2025, included new packaging lines optimized for stick and single-serve formats, reflecting the company's bet on format diversification to capture incremental occasions. Bottles and jars, meanwhile, cater to home and office consumption, offering bulk pricing and resealability but lacking the portability that drives impulse purchase.
Blister packs' dominance is sustained by supermarkets and hypermarkets, where shelf space allocation favors larger formats and multi-pack promotions that drive basket size. However, blister packs face environmental scrutiny: the combination of plastic and aluminum foil complicates recycling, and extended producer responsibility schemes in the EU are prompting manufacturers to explore mono-material alternatives. Stick packs, often constructed from recyclable paperboard with minimal plastic lining, align better with circular-economy mandates and consumer sustainability preferences. The format's growth is also fueled by premiumization: limited-edition and seasonal flavors are frequently launched in stick packs to signal exclusivity and justify higher per-piece pricing. Bottles and jars are losing share in developed markets but remain relevant in emerging economies where bulk purchasing reduces per-unit cost and family-size formats dominate. The segment's evolution reflects broader retail trends: as e-commerce and convenience channels gain share, packaging must balance portability, sustainability, and shelf impact, a trilemma that favors stick packs in the near term but may shift toward refillable or compostable formats as regulatory and consumer pressures intensify.
By Distribution Channel: Online Retail Gains as Brands Bypass Gatekeepers
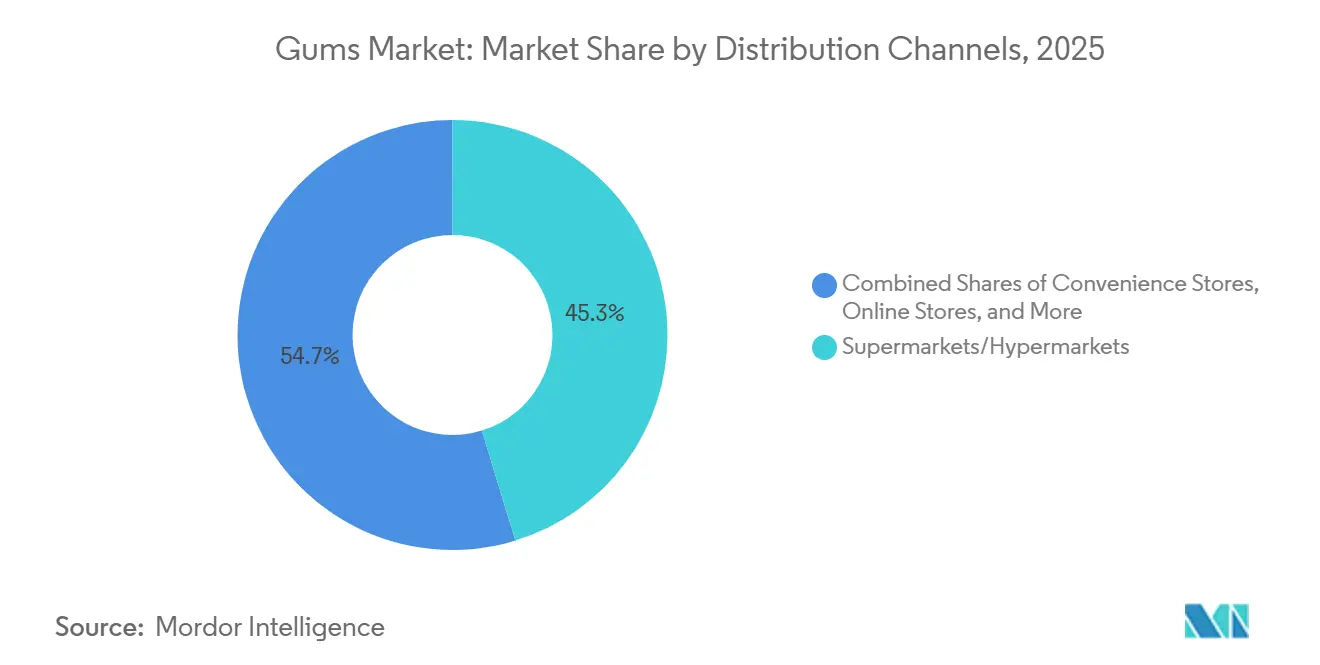
Supermarkets and hypermarkets remain the largest distribution channel for gum, with a market share of 45.26%, leveraging high foot traffic, promotional end-caps, and checkout-aisle impulse placement to drive volume. However, online retail stores are expanding rapidly as brands invest in direct-to-consumer platforms and leverage social media to drive trial. Online channels registered a CAGR of 5.48%. Mars committed over USD 50 million in early 2024 to the "Chew You Good" campaign, deploying TikTok content, Instagram activations, and AR Snapchat lenses to recruit consumers aged 25 and under, with digital channels serving as both marketing vehicles and transaction endpoints MediaPost. Smaller brands like Simply Gum offer subscription models with 10% discounts and free shipping, capturing margin that would otherwise accrue to retail intermediaries and enabling real-time consumer feedback that informs flavor development. Online retail's share of gum sales remains modest, likely a single-digit percentage of total, but is growing faster than brick-and-mortar, particularly in markets with high smartphone penetration and established last-mile delivery infrastructure.
Convenience and grocery stores over-index for impulse purchase, with gum positioned at checkout counters and near-register displays to capitalize on spontaneous buying. These channels are critical for single-serve and stick-pack formats, where portability and immediate consumption drive sales. Supermarkets and hypermarkets, by contrast, favor multi-packs and bulk formats that appeal to planned purchases and household stocking. The channel mix is shifting as e-commerce and quick-commerce platforms gain share: brands must now optimize SKU assortments for digital discovery, where search algorithms and sponsored placements replace physical shelf space as the primary battleground. Other distribution channels, including vending machines, pharmacies, and travel retail, represent smaller but strategically important touchpoints. Travel retail, in particular, offers premiumization opportunities: duty-free environments enable higher price points and limited-edition packaging that capture tourist spending. However, travel retail's recovery from pandemic lows has been uneven, with Asia-Pacific rebounding faster than Europe and North America, reflecting divergent mobility patterns and border-control policies.
Geography Analysis
In 2025, North America held 34.85% of the global chewing gum market, driven by high per capita consumption, brand loyalty, and robust retail infrastructure. However, U.S. gum unit sales in 2023 were 32% lower than in 2018 due to Gen Z's preference for sour gummies and reduced on-the-go consumption post-pandemic. Sugar-free gums dominate, supported by FDA regulations like the 2024 "healthy" claim redefinition and xylitol's oral health benefits. Canada’s imports of sugar-containing gums reached CAD 4.98 million, highlighting reliance on cross-border supply chains. Mexico, the second-largest gum consumer globally, faces margin pressures from a 2014 confectionery tax, prompting sugar-free innovations and affordable pack formats.
Europe's chewing gum market is shaped by sustainability regulations and premiumization trends. The EU's Single-Use Plastics Directive drives compostable wrappers and refillable formats, while startups like True Gum and Gud Gum promote plastic-free, chicle-based gums. Mars Wrigley’s 2024 packaging innovation, eliminating 13 tonnes of plastic annually, may influence European operations. Cloetta targets 3-4% annual organic sales growth and a 12% adjusted EBIT margin by 2027, focusing on Germany and the UK. Regulatory hurdles persist, as the European Food Safety Authority demands robust clinical evidence for health claims, limiting differentiation on functional benefits.
Asia-Pacific is set to grow at a 5.38% CAGR through 2031, fueled by rising incomes, modern retail expansion, and localized flavors. Lotte plans a USD 300 million investment in India by 2029, signaling competition in the organized confectionery market, projected to reach INR 95,521.8 crore by 2032. Core markets like China, India, Japan, and South Korea exhibit distinct preferences, from premium gums to affordable single-serve formats. South America’s market is price-sensitive, with local brands like Colombina leveraging small-format retail and exports, while regulatory frameworks like Argentina’s ANMAT registration impact market entry. The Middle East and Africa, led by the UAE, Saudi Arabia, and South Africa, offer growth potential tied to infrastructure, Halal certification, and modern retail expansion.

Competitive Landscape
Top Companies in Gums Market
The chewing gum market exhibits high concentration, with a handful of multinational confectioners controlling the majority of shelf space, innovation pipelines, and marketing spend. Perfetti Van Melle's acquisition of Mondelez's developed-market gum portfolio for USD 1.35 billion in October 2023 reshaped the competitive map, consolidating brands like Trident, Dentyne, and Stimorol under a single owner and enabling the buyer to leverage scale in procurement and distribution. Mondelez's exit reflects a strategic pivot toward chocolate and biscuits, categories with stronger growth trajectories and higher margins, while Perfetti Van Melle gains critical mass in gum to compete with Mars Wrigley, the category leader. Mars responded by committing over USD 50 million in early 2024 to the "Chew You Good" global brand platform, targeting consumers aged 25 and under with a repositioned narrative that frames gum as an everyday "me-moment" rather than occasional breath freshening. Incumbents are pursuing dual strategies: defending core mint and spearmint SKUs through functional claims (caffeine, vitamins, oral health) while launching limited-edition and seasonal flavors to recruit younger consumers and sustain media buzz.
White-space opportunities center on functional gums (energy, focus, stress relief), plant-based and plastic-free formulations, and direct-to-consumer e-commerce models that bypass traditional retail gatekeepers. Emerging disruptors like Simply Gum and True Gum are carving niches by substituting synthetic polymer bases with chicle, a natural tree sap, and marketing plastic-free credentials to sustainability-focused consumers, a move that resonates particularly in Europe where circular-economy regulations are tightening. However, these niche players collectively represent a fraction of category volume, and incumbents face the challenge of reformulating mass-market SKUs without sacrificing flavor duration or texture, attributes that synthetic bases deliver more reliably than natural alternatives.
Technology is becoming a competitive lever: Mars deployed AR Snapchat lenses and hundreds of localized social assets across more than 70 markets in 2024, illustrating how digital activation is now a core pillar of gum-category growth strategies. Lotte's USD 300 million investment in India, including a Haryana production facility operational in 2025, signals competitive intensity in Asia-Pacific, where localized manufacturing and flavor development are prerequisites for share gains Economic Times. Smaller brands are leveraging subscription models and influencer partnerships to build direct relationships with consumers, capturing margin and data that inform product development, a playbook that larger incumbents are beginning to replicate through pilot programs and brand incubators.
Gums Industry Leaders
Lotte Corporation
Mars Incorporated
Mondelēz International Inc.
Perfetti Van Melle BV
The Hershey Company
- *Disclaimer: Major Players sorted in no particular order

Recent Industry Developments
- May 2025: Perfetti Van Melle announced the relaunch of its Bubblicious bubblegum brand, introducing a new 5-piece Original flavor pack and an enhanced Watermelon variant with a bolder taste. Both feature eye-catching redesigned packaging.
- May 2025: Mars Wrigley India launched Boomer Lollipop. The product featured three flavors: Strawberry, Orange, and Watermelon. The product is available through various distribution channels across India.
- June 2024: Chupa Chups introduced Big Babol Magic Cubes, a color-changing bubble gum. Featuring soft, chewy tutti-frutti cubes in three vibrant color combinations that transform when chewed, the 86g packs launched across convenience stores with bold, playful packaging.


Global Gums Market Report Scope
Gums are both flavored, non-swallowable confectionery items with a water-insoluble rubber base, typically sweetened and flavored. Gums market is segmented by confectionery variant into bubble gums and chewing gums. By sugar content, the market is segmented into sugar and sugar-free. By packaging format, the market is segmented into blister packs, bottles/jars, and stick packs. By distribution channels, the market is segmented into supermarkets/hypermarkets, convenience/grocery stores, online retail channels, and other distribution channels. By geography, the market is segmented into North America, Europe, Asia-Pacific, South America, and the Middle East and Africa. The market sizing has been done in value terms in USD for all the abovementioned segments.
| Bubble Gums |
| Chewing Gums |
| Sugar Gums |
| Sugar-Free Gums |
| Blister Pack |
| Bottles/Jar |
| Stick Packs |
| Supermarkets/Hypermarkets |
| Convenience/Grocery Stores |
| Online Retail Stores |
| Other Distribution Channels |
| North America | United States |
| Canada | |
| Mexico | |
| Rest of North America | |
| Europe | Germany |
| United Kingdom | |
| France | |
| Spain | |
| Netherlands | |
| Italy | |
| Sweden | |
| Poland | |
| Belgium | |
| Rest of Europe | |
| Asia-Pacific | China |
| India | |
| Japan | |
| Australia | |
| South Korea | |
| Indonesia | |
| Thailand | |
| SIngapore | |
| Rest of Asia-Pacific | |
| South America | Brazil |
| Argentina | |
| Colombia | |
| Chile | |
| Peru | |
| Rest of South America | |
| Middle East and Africa | United Arab Emirates |
| South Africa | |
| Nigeria | |
| Saudi Arabia | |
| Egypt | |
| Morocco | |
| Turkey | |
| Rest of Middle East and Africa |
| By Confectionery Variant | Bubble Gums | |
| Chewing Gums | ||
| By Sugar Content | Sugar Gums | |
| Sugar-Free Gums | ||
| By Packaging Format | Blister Pack | |
| Bottles/Jar | ||
| Stick Packs | ||
| By Distribution Channel | Supermarkets/Hypermarkets | |
| Convenience/Grocery Stores | ||
| Online Retail Stores | ||
| Other Distribution Channels | ||
| By Geography | North America | United States |
| Canada | ||
| Mexico | ||
| Rest of North America | ||
| Europe | Germany | |
| United Kingdom | ||
| France | ||
| Spain | ||
| Netherlands | ||
| Italy | ||
| Sweden | ||
| Poland | ||
| Belgium | ||
| Rest of Europe | ||
| Asia-Pacific | China | |
| India | ||
| Japan | ||
| Australia | ||
| South Korea | ||
| Indonesia | ||
| Thailand | ||
| SIngapore | ||
| Rest of Asia-Pacific | ||
| South America | Brazil | |
| Argentina | ||
| Colombia | ||
| Chile | ||
| Peru | ||
| Rest of South America | ||
| Middle East and Africa | United Arab Emirates | |
| South Africa | ||
| Nigeria | ||
| Saudi Arabia | ||
| Egypt | ||
| Morocco | ||
| Turkey | ||
| Rest of Middle East and Africa | ||


Market Definition
- Milk and White Chocolate - Milk chocolates is a solid chocolate made with milk (in the form of either milk powder, liquid milk, or condensed milk) and cocoa solids. White chocolate is made from cocoa butter and milk and contains no cocoa solids whatsoever. The scope includes regular chocolates, low-sugar, and sugar-free variants
- Toffees & Nougats - Toffees include hard, chewy, and small or one-bite candies marketed with labels as toffee or toffee-like confectionery. Nougat is a chewy confection with almond, sugar, and egg white as a basic ingredient; and it originated in Europe and Middle East countries.
- Cereals Bars - A snack composed of breakfast cereal that has been compressed into a bar shape and is held together with a form of edible adhesive. The scope includes snack bars made with cereals such as rice, oats, corn, etc. mixed with a binding syrup. These also include products labeled as cereal bars, cereal treat bars, or grain bars.
- Chewing Gum - This is a preparation for chewing, usually made of flavored and sweetened chicle or such substitutes as polyvinyl acetate. The types of chewing gums included in the scope are sugar-chewing gums and sugar-free chewing gums
| Keyword | Definition |
|---|---|
| Dark Chocolate | Dark chocolate is a form of chocolate containing cocoa solids and cocoa butter without the milk. |
| White Chocolate | White chocolate is the type of chocolate containing the highest percentage of milk solids, typically around or over 30 percent. |
| Milk Chocolate | Milk chocolate is made from dark chocolate that has a low cocoa solid content and higher sugar content, plus a milk product. |
| Hard Candy | A candy made of sugar and corn syrup boiled without crystallizing. |
| Toffees | A hard, chewy, often brown sweet that is made from sugar boiled with butter. |
| Nougats | A chewy or brittle candy containing almonds or other nuts and sometimes fruit. |
| Cereal bar | A cereal bar is a bar-shaped food product, made by pressing cereals and usually dried fruit or berries, which are in most cases held together by glucose syrup. |
| Protein bar | Protein bars are nutrition bars that contain a high proportion of protein to carbohydrates/fats. |
| Fruit & Nut bar | These are often based on dates with other dried fruit and nut additions and, in some cases, flavorings. |
| NCA | The National Confectioners Association is an American trade organization that promotes chocolate, candy, gum and mints, and the companies that make these treats. |
| CGMP | Current good manufacturing practices are those conforming to the guidelines recommended by relevant agencies. |
| Unstandardized foods | Unstandardized foods are those that do not have a standard of identity or that deviate from a prescribed standard in any manner. |
| GI | The glycemic index (GI) is a way of ranking carbohydrate-containing foods based on how slowly or quickly they are digested and increase blood glucose levels over a period of time |
| Skimmed milk powder | Skimmed milk powder is obtained by removing water from pasteurized skim milk by spray-drying. |
| Flavanols | Flavanols are a group of compounds found in cocoa, tea, apples, and many other plant-based foods and beverages. |
| WPC | Whey protein concentrate- the substance obtained by the removal of sufficient nonprotein constituents from pasteurized whey so that the finished dry product contains greater than 25% protein. |
| LDL | Low density Lipoprotein- the bad cholesterol |
| HDL | High density Lipoprotein- the good cholesterol |
| BHT | butylated Hydroxytoluene is a lab-made chemical that is added to foods as a preservative. |
| Carrageenan | Carrageenan is an additive used to thicken, emulsify, and preserve foods and drinks. |
| Free form | Not containing certain ingredients, such as gluten, dairy, or sugar. |
| Cocoa butter | It is a fatty substance obtained from cocoa beans, used in the manufacture of confectionery. |
| Pastellies | A type of of Brazilian candy made from sugar, eggs, and milk. |
| Draggees | Small, round candies that are coated with a hard sugar shell |
| CHOPRABISCO | Royal Belgian Association of the chocolate, pralines, biscuit, and confectionery industry- A trade association that represents the Belgian chocolate industry. |
| European Directive 2000/13 | A European Union directive that regulates the labeling of food products |
| Kakao-Verordnung | The German chocolate ordinance, a set of regulations that define what can be labeled as "chocolate" in Germany. |
| FASFC | Federal Agency for the Safety of the Food Chain |
| Pectin | A natural substance that is derived from fruits and vegetables. It is used in confectionery to create a gel-like texture. |
| Invert sugars | A type of sugar that is made up of glucose and fructose. |
| Emulsifier | A substance that helps to mix to liquids that does not mix together. |
| Anthocyanins | A type of flavonoid that is responsible for the red, purple, and blue colors of confectionery. |
| Functional Foods | Foods that have been modified to provide additional health benefits beyond basic nutrition. |
| Kosher certificate | This certification verifies that the ingredients, production process including all machinery, and/or food-service process complies with the standards of Jewish dietary law |
| Chicory root extract | A natural extract from the chicory root that is a good source of fiber, calcium, phosphorous, and folate |
| RDD | Recommended daily dose |
| Gummies | A chewy gelatin-based candy that is often flavored with fruit. |
| Nutraceuticals | Food or dietary supplements that are claimed to have health benefits. |
| Energy bars | Snack bars that are high in carbohydrates and calories are designed to provide energy on the go. |
| BFSO | Belgian Food Safety Organization for the food chain. |


Research Methodology
Mordor Intelligence follows a four-step methodology in all our reports.
- Step-1: Identify Key Variables: In order to build a robust forecasting methodology, the variables and factors identified in Step 1 are tested against available historical market numbers. Through an iterative process, the variables required for market forecast are set, and the model is built on the basis of these variables.
- Step-2: Build a Market Model: Market-size estimations for the forecast years are in nominal terms. Inflation is not a part of the pricing, and the average selling price (ASP) is kept constant throughout the forecast period for each country.
- Step-3: Validate and Finalize: In this important step, all market numbers, variables, and analyst calls are validated through an extensive network of primary research experts from the market studied. The respondents are selected across levels and functions to generate a holistic picture of the market studied.
- Step-4: Research Outputs: Syndicated Reports, Custom Consulting Assignments, Databases & Subscription Platforms


