Market Overview
| Study Period | 2021 - 2031 |
|---|---|
| Market Size (2026) | USD 9.01 Billion |
| Market Size (2031) | USD 11.54 Billion |
| Growth Rate (2026 - 2031) | 5.07% CAGR |
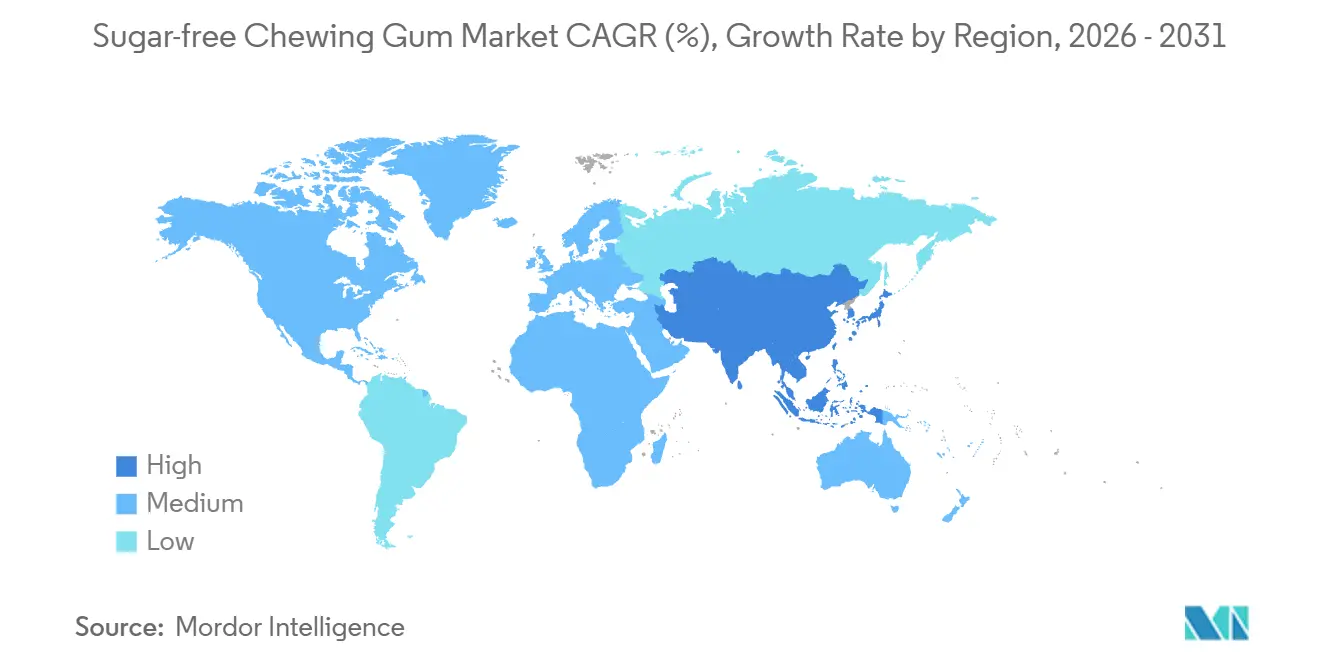
| Fastest Growing Market | Asia Pacific |
| Largest Market | North America |
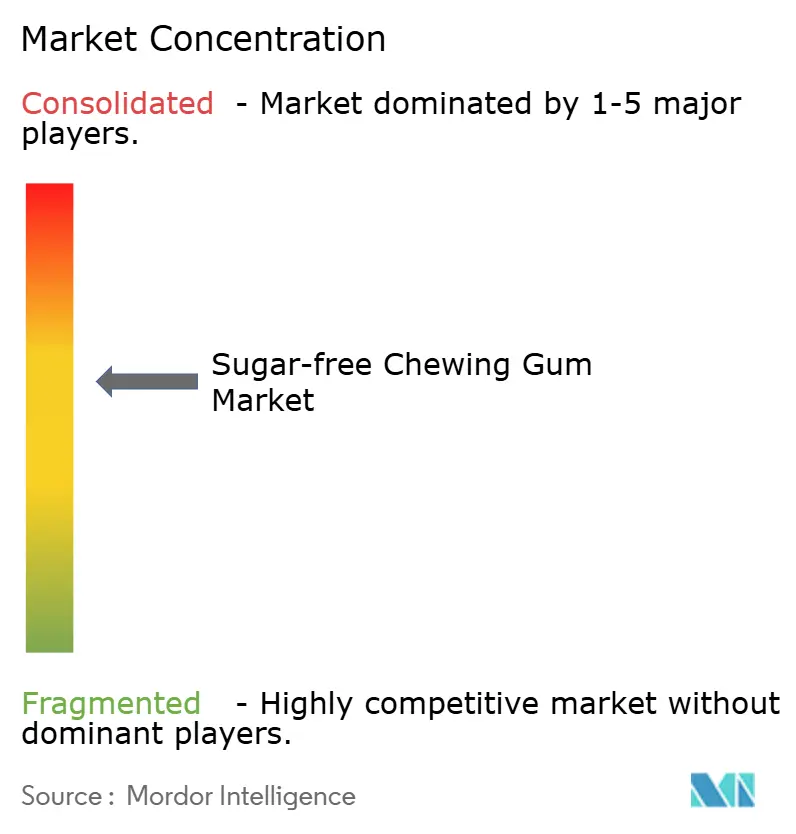
| Market Concentration | Medium |
Major Players
*Disclaimer: Major Players sorted in no particular order Image © Mordor Intelligence. Reuse requires attribution under CC BY 4.0. |
|
Sugar-free Chewing Gum Market Analysis by Mordor Intelligence
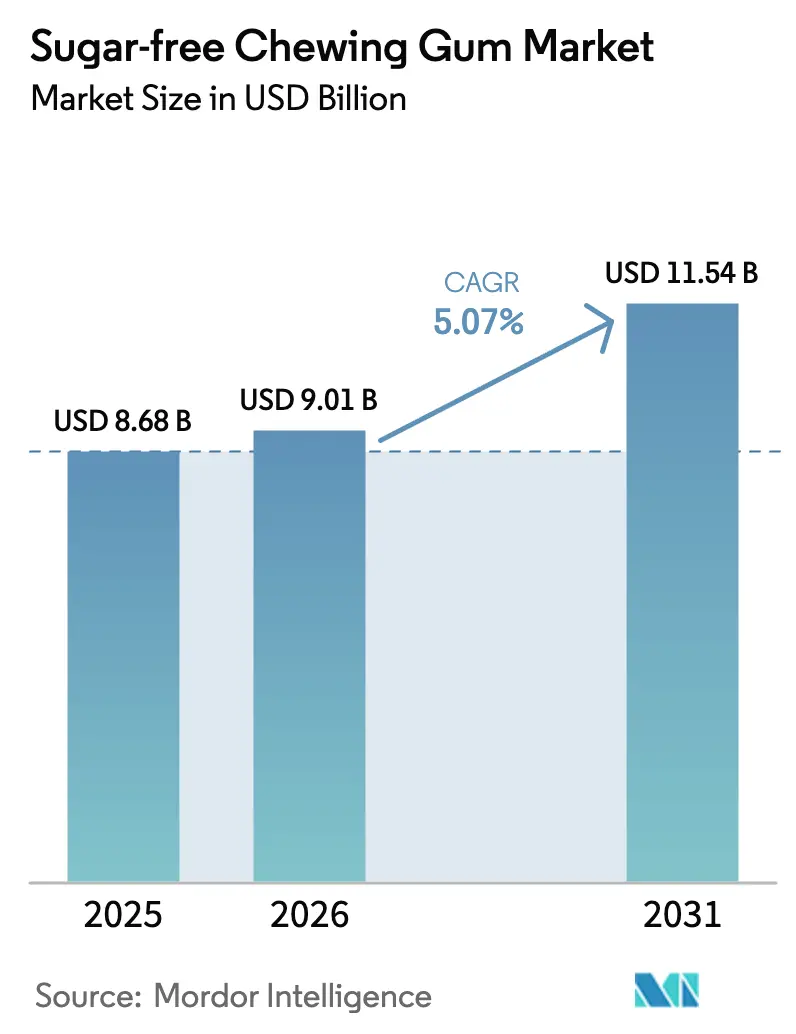
In 2025, the sugar-free chewing gum market was valued at USD 8.68 billion. Projections indicate an increase to USD 9.01 billion in 2026, with expectations to hit USD 11.54 billion by 2031, marking a CAGR of 5.07% during the forecast period (2026-2031). The market is driven by a growing preference for low-sugar confectionery, stricter regulations on caloric sweeteners, and increasing demand for functional oral-care products. Urban areas are leading this growth due to rising diabetes cases, higher dental-care spending, and greater wellness awareness. Major manufacturers are focusing on innovations such as natural polyols, dual-flavor technologies, and biodegradable gum bases, while smaller brands are targeting younger consumers with vegan formulations and compostable packaging. Consumer priorities are shifting towards flavor complexity, convenience, and social media engagement, which favor premium products and support higher pricing. North America remains the largest revenue contributor, while the Asia-Pacific region is experiencing the fastest growth, driven by a shift in countries like India and China towards sugar-free alternatives aligned with preventive health trends.
Key Report Takeaways
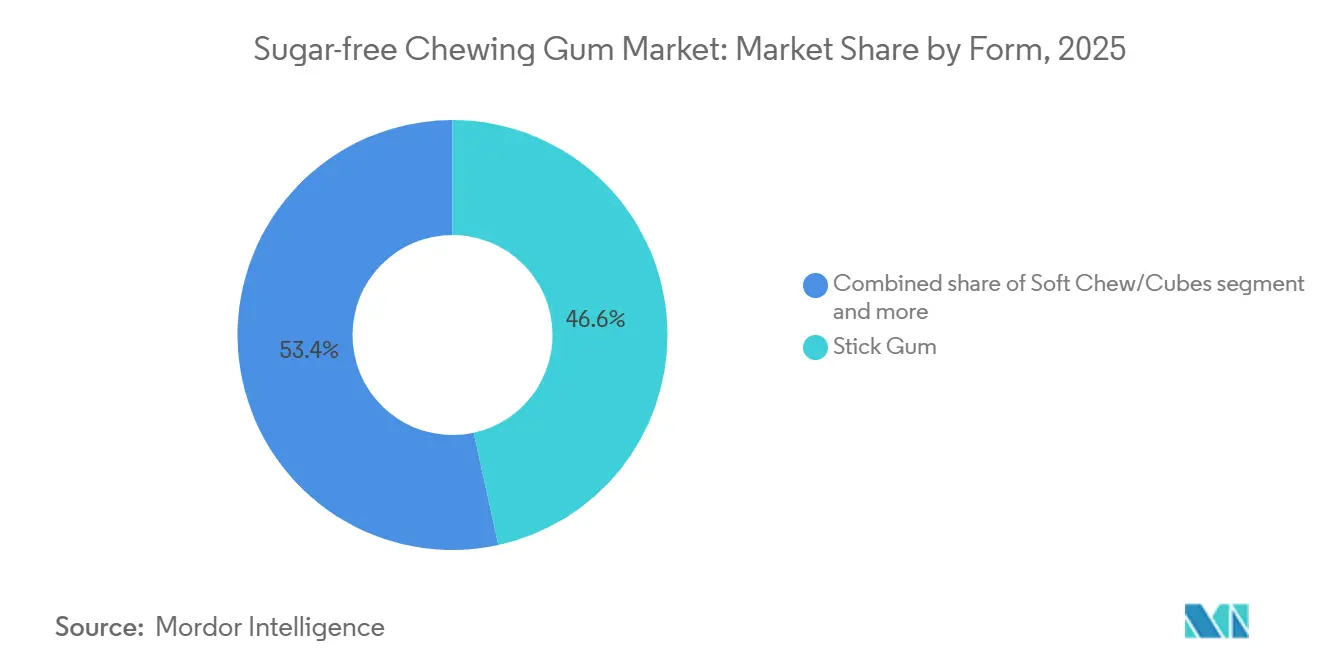
- By form, stick gum led with 46.59% of the sugar-free chewing gum market share in 2025, while soft chew/cube formats are projected to grow at a 5.89% CAGR through 2031.
- By sweetener type, artificial sweeteners commanded 71.51% volume share in 2025, whereas natural sweeteners are forecast to expand at a 5.91% CAGR to 2031.
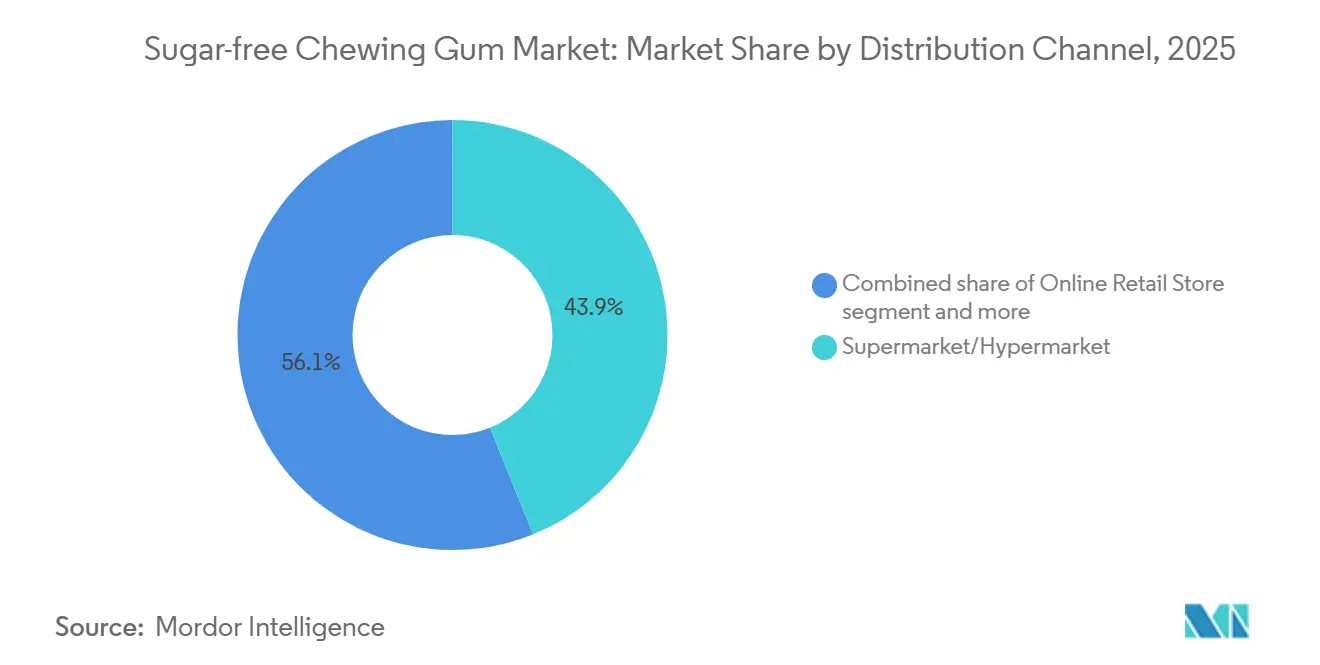
- By distribution channel, supermarkets/hypermarkets captured 43.87% share in 2025; online retail stores are on track to post a 6.84% CAGR during 2026-2031.
- By geography, North America accounted for 42.92% revenue share in 2025, but Asia-Pacific is poised for the fastest regional climb at a 5.71% CAGR through 2031.
Note: Market size and forecast figures in this report are generated using Mordor Intelligence’s proprietary estimation framework, updated with the latest available data and insights as of January 2026.
Global Sugar-free Chewing Gum Market Trends and Insights
Drivers Impact Analysis*
| Driver | (~) % Impact on CAGR Forecast | Geographic Relevance | Impact Timeline |
|---|---|---|---|
| Oral health positioning and dental endorsements | +0.9% | Global, strongest in North America and Europe | Medium term (2-4 years) |
| Rising global diabetes and pre-diabetes cases | +1.1% | Global, urban Asia-Pacific and Middle East | Long term (≥ 4 years) |
| Flavor innovation to attract younger consumers | +0.7% | North America, Europe, urban Asia-Pacific | Short term (≤ 2 years) |
| Smoking cessation and behavioral health trends driving growth | +0.5% | North America, Europe, select Asia-Pacific | Medium term (2-4 years) |
| Clean-label and natural cues driving growth | +0.8% | North America, Western Europe, affluent Asia-Pacific | Medium term (2-4 years) |
| Regulatory support for reduced-sugar products | +0.6% | Global, early enforcement in Europe and select Indian states | Long term (≥ 4 years) |
| Source: Mordor Intelligence | |||


Oral health positioning and dental endorsements
Dental associations across the globe have redefined sugar-free gum, positioning it as a clinically supported oral hygiene product rather than just a breath freshener. This shift has provided manufacturers with opportunities to collaborate through co-branding and seal-of-acceptance programs. The American Dental Association (ADA) recommends chewing polyol-based gum for 10 to 20 minutes after meals, as it helps stimulate saliva flow and lowers the risk of caries[1]Source: American Dental Association, "Chewing gum", mouthhealthy.org. The ADA awards its Seal of Acceptance only to sugar-free gums that meet strict criteria for pH neutrality and non-cariogenicity. This endorsement has allowed brands like Orbit for Kids and Trident to gain premium shelf placement in pharmacy and wellness sections, moving away from the sugary image of traditional confectionery products. Moreover, compliance with ISO 11609 standards for chewing-gum testing enhances the credibility of product claims, enabling manufacturers to use third-party validation in consumer marketing and outreach efforts aimed at pediatric dentists.
Rising global diabetes and pre-diabetes cases
The prevalence of diabetes has been increasing at a rate faster than what historical epidemiological models had predicted. According to the International Diabetes Federation (IDF), 589 million adults globally were living with diabetes in 2024. This number is expected to rise to 853 million by 2050, representing a 46% increase[2]Source: International Diabetes Federation, "Diabetes around the world in 2024", idf.org. The growth is primarily concentrated in urban areas, where sedentary lifestyles and greater access to processed foods are common. Sugar-free gum, particularly those made with xylitol (which has a glycemic index of approximately 7), is gaining traction as a diabetes-friendly option. These gums do not cause insulin spikes, making them suitable for individuals managing diabetes. Endocrinologists are increasingly recommending polyol-based gums as part of glycemic control strategies. Reflecting this trend, pharmacy chains in India and Southeast Asia have started stocking sugar-free gum in dedicated diabetic-care sections. This shift in consumer behavior, from impulse purchases to planned buying, has extended brand loyalty cycles. Additionally, it has allowed brands to justify higher price points, helping to offset the higher costs of sweeteners used in these products.
Flavor innovation to attract younger consumers
Gen Z, expected to form a significant part of India's working-age population by 2030, also holds considerable demographic importance in North America and Europe. This generation shows a clear preference for unique and complex flavors over traditional mint options. Hershey's Ice Breakers Flavor Shifters, set to launch in May 2025, highlight this trend. The product uses dual-encapsulation technology to shift flavors mid-chew, such as transitioning from Wild Berry to Coolmint or Wintergreen to Coolmint. This innovation enhances the chewing experience and creates a "flavor journey" that resonates well on social media platforms. Similarly, Mars Wrigley's Respawn by 5 gum, developed in collaboration with gaming influencers, incorporates green tea extract and vitamin B complex. It is designed to appeal to esports enthusiasts looking for a cognitive boost without the side effects of energy drinks. Flavor continues to be the leading factor influencing purchases, surpassing price and promotions. However, the concept of "flavor" has evolved to include elements like texture changes, functional ingredients, and managing aftertaste post-chew.
Smoking cessation and behavioral health trends driving growth
The nicotine-replacement therapy market is increasingly intersecting with functional gum as public health campaigns emphasize smoking cessation as a behavioral health priority rather than a test of willpower. Prescription nicotine gums continue to dominate pharmacy channels, however, over-the-counter sugar-free gums marketed for stress relief and oral fixation management are gaining popularity among ex-smokers. These products serve as a non-pharmaceutical aid during the transition away from smoking. Mars Wrigley’s "Chew You Good" campaign, launched in January 2024 with a media spend exceeding USD 50 million in the first half of the year, highlights mental well-being by positioning gum as a mindfulness tool that provides a "moment of calm" in stressful situations. Additionally, functional gum brands like NeuroGum and MindGum, which include caffeine (60 to 80 mg per serving) and B vitamins, are further bridging the gap between confectionery and wellness. These brands promote chewing gum as a tool for enhancing productivity rather than just a habitual activity.
Restraints Impact Analysis*
| Restraint | (~) % Impact on CAGR Forecast | Geographic Relevance | Impact Timeline |
|---|---|---|---|
| Consumer skepticism toward artificial sweeteners | -0.6% | Global, heightened in North America and Europe | Short term (≤ 2 years) |
| Supply chain and ingredient risks for specific sweeteners, flavors, and gum bases | -0.5% | Global, acute in Asia-Pacific reliant on Chinese polyol output | Medium term (2-4 years) |
| Price sensitivity in developing markets | -0.4% | Asia-Pacific, South America, Middle East and Africa | Long term (≥ 4 years) |
| Environmental concerns about gum base | -0.3% | Europe, North America, green-activist urban centers | Medium term (2-4 years) |
| Source: Mordor Intelligence | |||
Consumer skepticism toward artificial sweeteners
Consumer skepticism toward artificial sweeteners is a significant restraint in the sugar-free chewing gum market. Mixed messages from regulatory agencies have created confusion, leading to reduced trial rates for reformulated products. The International Agency for Research on Cancer (IARC), part of the World Health Organization (WHO), classified aspartame as possibly carcinogenic to humans (IARC Group 2B). Meanwhile, the Joint Expert Committee on Food Additives (JECFA), a collaboration between WHO and the Food and Agriculture Organization (FAO), reaffirmed the acceptable daily intake of aspartame at 40 mg/kg body weight[3]Source: IARC, "Aspartame hazard and risk assessment results released", iarc.who.int. Additionally, the WHO issued guidelines advising against the use of non-sugar sweeteners for weight control, citing observational studies that link long-term use to metabolic syndrome. However, this guidance explicitly excluded polyols such as xylitol and erythritol, which are endorsed for their dental health benefits. Manufacturers face challenges in reformulating products to replace aspartame and sucralose with alternatives like stevia or monk fruit, as these ingredients increase costs by 20% to 30%. At the same time, continuing to use legacy sweeteners risks losing health-conscious consumers to competitors offering "clean-label" products. This skepticism is particularly evident in North America and Western Europe, where higher media literacy and access to conflicting scientific studies influence cautious purchasing behavior.
Supply chain and ingredient risks for specific sweeteners, flavors, and gum bases
The production of xylitol and erythritol is heavily concentrated in China, where these sweeteners are primarily derived from corn cobs and fermented glucose. In 2024 and 2025, weather-related disruptions to corn harvests significantly impacted xylitol supply. This resulted increase in spot prices, forcing smaller gum manufacturers to either reformulate their products mid-production or absorb margin compression. Similarly, stevia cultivation faces challenges due to its dependence on specific altitude and climate conditions. Adverse weather in 2024 in key growing regions such as Paraguay and Kenya reduced yields, leading to shipment delays for buyers in Europe and North America. Additionally, gum-base supply chains remain fragile. Synthetic gum bases, made from petroleum-based elastomers, are subject to crude oil price volatility. Meanwhile, natural chicle, sourced from the sap of sapodilla trees in Central American forests, is harvested under quota systems, which restrict scalability.
*Our forecasts treat driver/restraint impacts as directional, not additive. The impact forecasts reflect baseline growth, mix effects, and variable interactions.
Segment Analysis
By Form: Texture-Led Premiumization Broadens Appeal
Stick gum is the largest segment in the sugar-free chewing gum market, holding a 46.59% share in 2025. Its dominance is driven by decades of strategic merchandising at checkout lanes across North America and Europe, ensuring consistent consumer visibility and accessibility. Dragee gum also plays a significant role in this segment, particularly in office settings where its portion-controlled and crunch-free format meets the demand for discreet consumption. Additionally, tablet gums are expanding their presence beyond pharmacies into travel retail, leveraging dentist endorsements and innovative designs that offer a convenient, mess-free experience. These established formats continue to cater to a broad consumer base, maintaining their stronghold in the market.
Cube/soft-chew gums represent the fastest-growing segment, with a projected CAGR of 5.89% through 2031. This growth is fueled by advancements in flavor-transition technologies that enhance chew duration and support premium pricing. Gen Z's preference for unique textures has further driven the introduction of innovative products like crystal-coated squares and chewable gels, which combine the characteristics of gum and lozenges. Although these sub-categories currently hold a smaller market share, they generate significant online buzz, encouraging trials across various shopping channels. Manufacturers are also capitalizing on e-commerce subscriptions with bundled variety packs to foster consumer loyalty and streamline production, further accelerating the growth of these emerging formats.


By Sweetener Type: Natural Polyols Charge Ahead Despite Cost Premiums
Artificial sweeteners held the largest share in the sugar-free chewing gum market, accounting for 71.51% of the market. Their widespread use is attributed to their cost efficiency and established role in product formulations. Aspartame, in particular, remains a key driver due to its favorable cost-to-sweetness ratio, making it a go-to choice for manufacturers. Despite growing regulatory scrutiny, artificial sweeteners continue to dominate, supported by their affordability and the ability to meet consumer demand for low-calorie options. Industry players are also leveraging these sweeteners in reformulated products to cater to shifting consumer preferences.
Natural sweeteners represent the fastest-growing segment in the market, with a projected CAGR of 5.91%. This growth is driven by increasing consumer demand for natural and "clean label" products, as well as the perceived health benefits of these sweeteners. Xylitol, a prominent polyol, is gaining popularity for its dental benefits, while innovations in stevia and monk fruit blends are addressing taste-related challenges. Although natural polyols currently face higher costs and supply chain complexities, efforts to diversify sourcing and improve production efficiencies are expected to support their adoption and enhance their competitiveness in the market.
By Distribution Channel: E-Commerce Reshapes the Impulse Paradigm
Supermarkets/hypermarkets emerged as the largest segment in the sugar-free chewing gum market, holding a significant 43.87% market share. Their dominance is attributed to high-traffic checkout racks that encourage impulse purchases and product trials. Convenience stores continue to play a vital role in regions like Japan and Mexico, where they maintain strong local relevance. However, the rise of real-time inventory apps is gradually shifting consumer preferences toward hypermarkets, which offer deep-discount multipacks. This shift highlights the evolving dynamics of traditional retail channels as they adapt to changing consumer behaviors and technological advancements.
Online retail is the fastest-growing segment in the sugar-free chewing gum market, with a projected CAGR of 6.84%. This growth is driven by the increasing popularity of subscription bundles that bypass traditional slotting fees and deliver products directly to consumers in compostable packaging. In India, quick-commerce platforms have further accelerated this trend, with 10-minute delivery windows seamlessly blending impulse and planned purchases. Additionally, e-commerce platforms are leveraging customer reviews to emphasize eco-friendly packaging and carbon-neutral distribution, appealing to environmentally conscious consumers. These factors collectively position online retail as a transformative force reshaping the impulse purchase paradigm in the market.
Geography Analysis
North America remains the largest market for sugar-free chewing gum, contributing 42.92% of the global revenue. The United States leads this region, driven by premiumization trends and functional product innovations. Canada is witnessing steady growth due to the expansion of pharmacy channels, while Mexico's high chewing frequency is rooted in cultural practices. Post-pandemic recovery in commuting has boosted impulse purchases, although the overall gum market faces challenges from shifting consumer preferences, particularly among younger demographics.
Asia-Pacific is the fastest-growing region, projected to grow at a 5.71% CAGR through 2031. Rising disposable incomes and increasing awareness of diabetes are key drivers in this region. India is experiencing a shift towards premium products, supported by the growing popularity of polyol-based gums. E-commerce is playing a significant role in the region's growth, with consumers in smaller cities adopting subscription models. China continues to dominate in scale, while Japan's aging population is driving demand for denture-safe options. Southeast Asia's growth is tied to affordability, with innovative pricing strategies expanding access to sugar-free gum.
Europe, South America, and the Middle East and Africa collectively account for the remaining market share. In Europe, regulatory mandates are pushing sugar-free gum to become the standard, with Germany leading in flavor innovation. South America faces economic challenges, but urban areas show growing interest in dentist-endorsed products. In the Middle East, premium formats are gaining traction due to duty-free sales and a large expatriate population. Sub-Saharan Africa's market remains underdeveloped due to low disposable incomes and distribution barriers, while Turkey leverages its strategic location to support exports to neighboring regions.

Competitive Landscape
The sugar-free chewing gum market is moderately concentrated, with key players focusing on innovation and sustainability to maintain their competitive edge. Niche players like Simply Gum, PUR Company, and Peppersmith are leveraging clean-label purity and direct-to-consumer strategies to capture market share. Their emphasis on chicle bases, vegan claims, and plastic-free packaging has resonated with environmentally conscious consumers. Functional-benefit specialists, including NeuroGum and Rev Gum, are carving out a unique space by incorporating caffeine and nootropics, targeting productivity-focused consumers and redefining traditional energy product segments.
Ingredient suppliers are playing a pivotal role in shaping the market landscape by driving innovation and supporting product development. Companies like Tate & Lyle and Roquette are introducing advanced solutions such as bitter-masking stevia and biodegradable starch bases, which are being piloted by multinational corporations. These developments are enabling manufacturers to align with evolving consumer preferences for sustainable and functional products. Additionally, patents for rapid-release micronutrients, moisture barriers, and compostable elastomers are becoming critical for companies aiming to differentiate themselves in the market.
Strategic partnerships and digital platforms are further influencing the competitive dynamics of the market. For instance, Mars has collaborated with Instacart to optimize product placement through algorithmic strategies. However, the industry faces challenges such as addressing gum-litter concerns, with municipalities considering levies similar to single-use plastic taxes. Resolving these issues will be crucial for companies relying on synthetic bases to sustain their market share and adapt to shifting regulatory landscapes.
Sugar-free Chewing Gum Industry Leaders
-
Chewsy UK Ltd
-
Ferndale Foods Limited
-
Ferrero International SA
-
Lotte Corporation
-
Mars Incorporated
- *Disclaimer: Major Players sorted in no particular order

Recent Industry Developments
- May 2025: Perfetti Van Melle rolled out Trident Vibes Cotton Candy, the first sugar-free cotton-candy gum, at USD 3.84 per 40-piece bottle.
- October 2024: Mars launched EXTRA plant-based gum in Germany, pairing chicle base with birch-xylitol and recyclable paper packaging to satisfy eco-lifestyle shoppers.
- September 2024: Hershey debuted Ice Breakers Flavor Shifters, delivering mid-chew transitions from Wild Berry to Coolmint, in a bid to win Gen Z attention through sensory storytelling.


Global Sugar-free Chewing Gum Market Report Scope
Sugar-free chewing gum is designed without traditional sugars like sucrose, instead utilizing alternative sweeteners. These sweeteners include sugar alcohols (such as sorbitol, xylitol, and maltitol) along with high-intensity sweeteners (like aspartame, sucralose, and stevia). This composition provides sweetness while significantly reducing or eliminating sugar content. The Sugar-Free Chewing Gum Market is segmented by Form into Stick Gum, Dragee Gum, Tablet, Soft Chew/Cubes, and Others. Sweetener Types are categorized into Natural and Artificial Sweeteners. Distribution Channels include Supermarket/Hypermarket, Online Retail Store, Convenience Store, and Others. Geographically, the market covers North America, Europe, Asia-Pacific, South America, the Middle East, and Africa. Market Forecasts are presented in USD value terms.
By Form
| Stick Gum |
| Dragee Gum |
| Tablet |
| Soft Chew/Cubes |
| Others |
By Sweetener Type
| Natural Sweeteners |
| Artificial Sweeteners |
By Distribution Channel
| Supermarkets/Hypermarkets |
| Convenience Stores |
| Online Retail Stores |
| Others Distribution Channel |
Geography
| North America | United States |
| Canada | |
| Mexico | |
| Rest of North America | |
| Europe | Germany |
| United Kingdom | |
| Italy | |
| France | |
| Spain | |
| Netherlands | |
| Poland | |
| Belgium | |
| Sweden | |
| Rest of Europe | |
| Asia-Pacific | China |
| India | |
| Japan | |
| Australia | |
| Indonesia | |
| South Korea | |
| Thailand | |
| Singapore | |
| Rest of Asia-Pacific | |
| South America | Brazil |
| Argentina | |
| Colombia | |
| Chile | |
| Peru | |
| Rest of South America | |
| Middle East and Africa | South Africa |
| Saudi Arabia | |
| United Arab Emirates | |
| Nigeria | |
| Egypt | |
| Morocco | |
| Turkey | |
| Rest of Middle East and Africa |
| By Form | Stick Gum | |
| Dragee Gum | ||
| Tablet | ||
| Soft Chew/Cubes | ||
| Others | ||
| By Sweetener Type | Natural Sweeteners | |
| Artificial Sweeteners | ||
| By Distribution Channel | Supermarkets/Hypermarkets | |
| Convenience Stores | ||
| Online Retail Stores | ||
| Others Distribution Channel | ||
| Geography | North America | United States |
| Canada | ||
| Mexico | ||
| Rest of North America | ||
| Europe | Germany | |
| United Kingdom | ||
| Italy | ||
| France | ||
| Spain | ||
| Netherlands | ||
| Poland | ||
| Belgium | ||
| Sweden | ||
| Rest of Europe | ||
| Asia-Pacific | China | |
| India | ||
| Japan | ||
| Australia | ||
| Indonesia | ||
| South Korea | ||
| Thailand | ||
| Singapore | ||
| Rest of Asia-Pacific | ||
| South America | Brazil | |
| Argentina | ||
| Colombia | ||
| Chile | ||
| Peru | ||
| Rest of South America | ||
| Middle East and Africa | South Africa | |
| Saudi Arabia | ||
| United Arab Emirates | ||
| Nigeria | ||
| Egypt | ||
| Morocco | ||
| Turkey | ||
| Rest of Middle East and Africa | ||


Market Definition
- Milk and White Chocolate - Milk chocolates is a solid chocolate made with milk (in the form of either milk powder, liquid milk, or condensed milk) and cocoa solids. White chocolate is made from cocoa butter and milk and contains no cocoa solids whatsoever. The scope includes regular chocolates, low-sugar, and sugar-free variants
- Toffees & Nougats - Toffees include hard, chewy, and small or one-bite candies marketed with labels as toffee or toffee-like confectionery. Nougat is a chewy confection with almond, sugar, and egg white as a basic ingredient; and it originated in Europe and Middle East countries.
- Cereals Bars - A snack composed of breakfast cereal that has been compressed into a bar shape and is held together with a form of edible adhesive. The scope includes snack bars made with cereals such as rice, oats, corn, etc. mixed with a binding syrup. These also include products labeled as cereal bars, cereal treat bars, or grain bars.
- Chewing Gum - This is a preparation for chewing, usually made of flavored and sweetened chicle or such substitutes as polyvinyl acetate. The types of chewing gums included in the scope are sugar-chewing gums and sugar-free chewing gums
| Keyword | Definition |
|---|---|
| Dark Chocolate | Dark chocolate is a form of chocolate containing cocoa solids and cocoa butter without the milk. |
| White Chocolate | White chocolate is the type of chocolate containing the highest percentage of milk solids, typically around or over 30 percent. |
| Milk Chocolate | Milk chocolate is made from dark chocolate that has a low cocoa solid content and higher sugar content, plus a milk product. |
| Hard Candy | A candy made of sugar and corn syrup boiled without crystallizing. |
| Toffees | A hard, chewy, often brown sweet that is made from sugar boiled with butter. |
| Nougats | A chewy or brittle candy containing almonds or other nuts and sometimes fruit. |
| Cereal bar | A cereal bar is a bar-shaped food product, made by pressing cereals and usually dried fruit or berries, which are in most cases held together by glucose syrup. |
| Protein bar | Protein bars are nutrition bars that contain a high proportion of protein to carbohydrates/fats. |
| Fruit & Nut bar | These are often based on dates with other dried fruit and nut additions and, in some cases, flavorings. |
| NCA | The National Confectioners Association is an American trade organization that promotes chocolate, candy, gum and mints, and the companies that make these treats. |
| CGMP | Current good manufacturing practices are those conforming to the guidelines recommended by relevant agencies. |
| Unstandardized foods | Unstandardized foods are those that do not have a standard of identity or that deviate from a prescribed standard in any manner. |
| GI | The glycemic index (GI) is a way of ranking carbohydrate-containing foods based on how slowly or quickly they are digested and increase blood glucose levels over a period of time |
| Skimmed milk powder | Skimmed milk powder is obtained by removing water from pasteurized skim milk by spray-drying. |
| Flavanols | Flavanols are a group of compounds found in cocoa, tea, apples, and many other plant-based foods and beverages. |
| WPC | Whey protein concentrate- the substance obtained by the removal of sufficient nonprotein constituents from pasteurized whey so that the finished dry product contains greater than 25% protein. |
| LDL | Low density Lipoprotein- the bad cholesterol |
| HDL | High density Lipoprotein- the good cholesterol |
| BHT | butylated Hydroxytoluene is a lab-made chemical that is added to foods as a preservative. |
| Carrageenan | Carrageenan is an additive used to thicken, emulsify, and preserve foods and drinks. |
| Free form | Not containing certain ingredients, such as gluten, dairy, or sugar. |
| Cocoa butter | It is a fatty substance obtained from cocoa beans, used in the manufacture of confectionery. |
| Pastellies | A type of of Brazilian candy made from sugar, eggs, and milk. |
| Draggees | Small, round candies that are coated with a hard sugar shell |
| CHOPRABISCO | Royal Belgian Association of the chocolate, pralines, biscuit, and confectionery industry- A trade association that represents the Belgian chocolate industry. |
| European Directive 2000/13 | A European Union directive that regulates the labeling of food products |
| Kakao-Verordnung | The German chocolate ordinance, a set of regulations that define what can be labeled as "chocolate" in Germany. |
| FASFC | Federal Agency for the Safety of the Food Chain |
| Pectin | A natural substance that is derived from fruits and vegetables. It is used in confectionery to create a gel-like texture. |
| Invert sugars | A type of sugar that is made up of glucose and fructose. |
| Emulsifier | A substance that helps to mix to liquids that does not mix together. |
| Anthocyanins | A type of flavonoid that is responsible for the red, purple, and blue colors of confectionery. |
| Functional Foods | Foods that have been modified to provide additional health benefits beyond basic nutrition. |
| Kosher certificate | This certification verifies that the ingredients, production process including all machinery, and/or food-service process complies with the standards of Jewish dietary law |
| Chicory root extract | A natural extract from the chicory root that is a good source of fiber, calcium, phosphorous, and folate |
| RDD | Recommended daily dose |
| Gummies | A chewy gelatin-based candy that is often flavored with fruit. |
| Nutraceuticals | Food or dietary supplements that are claimed to have health benefits. |
| Energy bars | Snack bars that are high in carbohydrates and calories are designed to provide energy on the go. |
| BFSO | Belgian Food Safety Organization for the food chain. |


Research Methodology
Mordor Intelligence follows a four-step methodology in all our reports.
- Step-1: Identify Key Variables: In order to build a robust forecasting methodology, the variables and factors identified in Step 1 are tested against available historical market numbers. Through an iterative process, the variables required for market forecast are set, and the model is built on the basis of these variables.
- Step-2: Build a Market Model: Market-size estimations for the forecast years are in nominal terms. Inflation is not a part of the pricing, and the average selling price (ASP) is kept constant throughout the forecast period for each country.
- Step-3: Validate and Finalize: In this important step, all market numbers, variables, and analyst calls are validated through an extensive network of primary research experts from the market studied. The respondents are selected across levels and functions to generate a holistic picture of the market studied.
- Step-4: Research Outputs: Syndicated Reports, Custom Consulting Assignments, Databases & Subscription Platforms


