North America Gums Market Size and Share
Market Overview
| Study Period | 2021 - 2031 |
|---|---|
| Forecast Data Period | 2026 - 2031 |
| Historical Data Period | 2021 - 2024 |
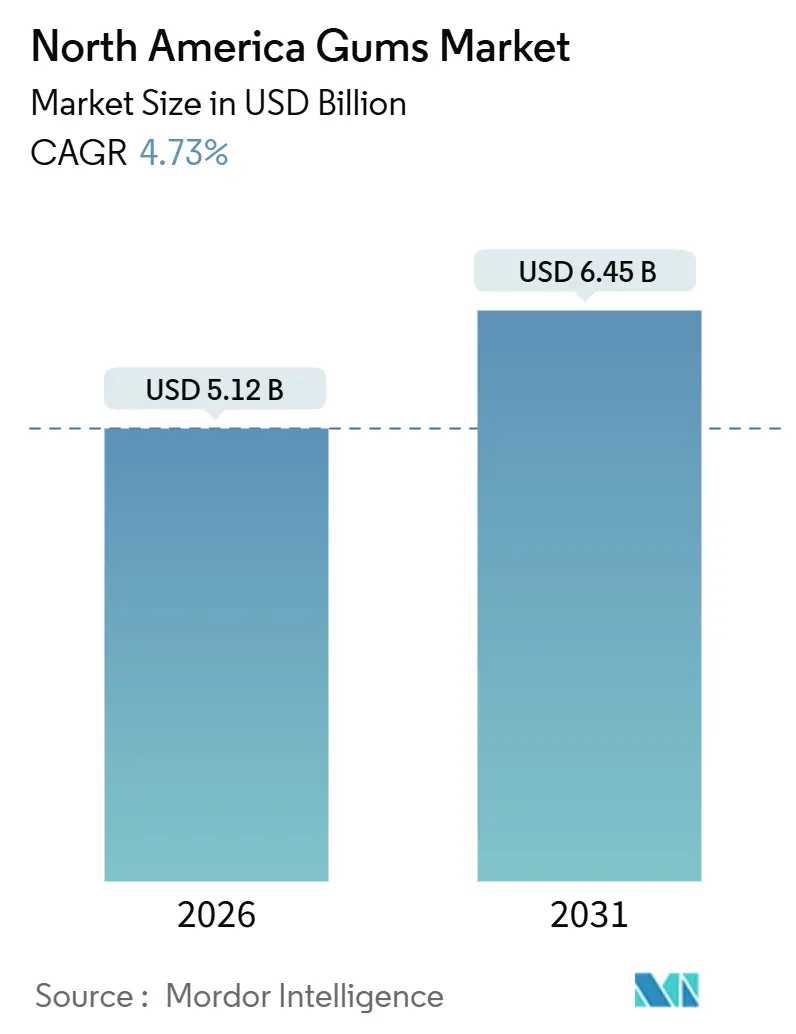
| Market Size (2026) | USD 5.12 Billion |
| Market Size (2031) | USD 6.45 Billion |
| Growth Rate (2026 - 2031) | 4.73% CAGR |
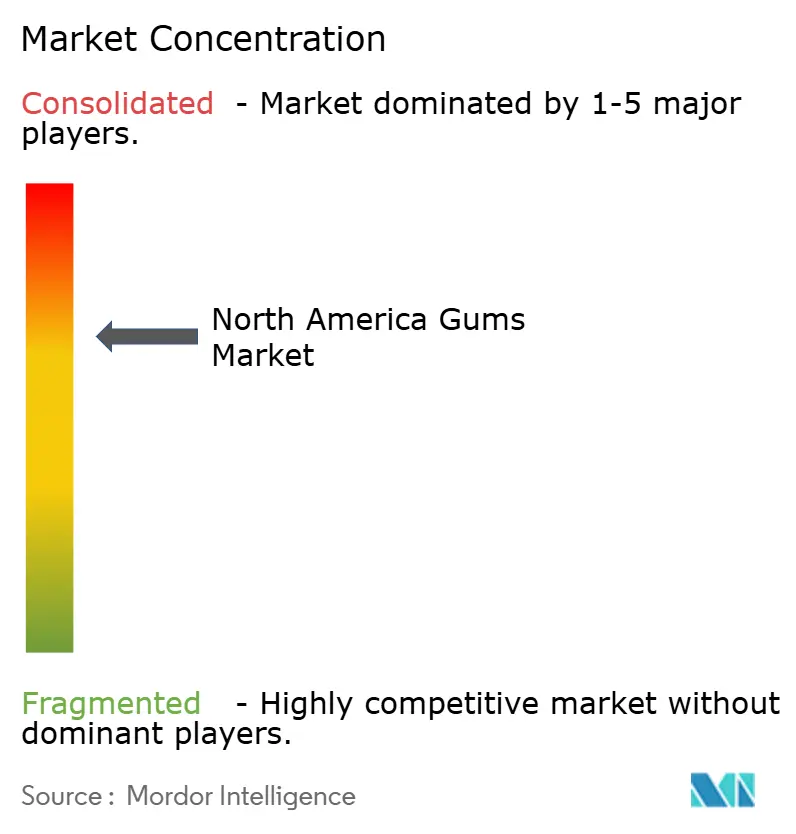
| Market Concentration | Medium |
Major Players
*Disclaimer: Major Players sorted in no particular order Image © Mordor Intelligence. Reuse requires attribution under CC BY 4.0. |
|
North America Gums Market Analysis by Mordor Intelligence
The North America chewing gum market reached a market size of USD 5.12 billion in 2026 and is projected to hit USD 6.45 billion by 2031, expanding at a 4.73% CAGR over the forecast period. Rising demand for sugar-free formulations, evidence-based oral-health positioning, portfolio consolidation among multinationals, and the rapid scale-up of online retail underpin this growth trajectory. Consolidation continues to lift the concentration as Perfetti Van Melle integrates the Mondelez gum assets and Mars refashions its flagship brands, leaving fewer but larger players with end-to-end supply chains. Functional gums fortified with caffeine, L-theanine, and vitamins widen usage occasions beyond breath-freshening, while bottles and jars win shoppers seeking value and lower packaging waste. At the same time, environmental scrutiny of non-biodegradable bases and raw-material price volatility temper volume expansion, keeping the chewing gum market on a steady but not explosive path through 2031.
Key Report Takeaways
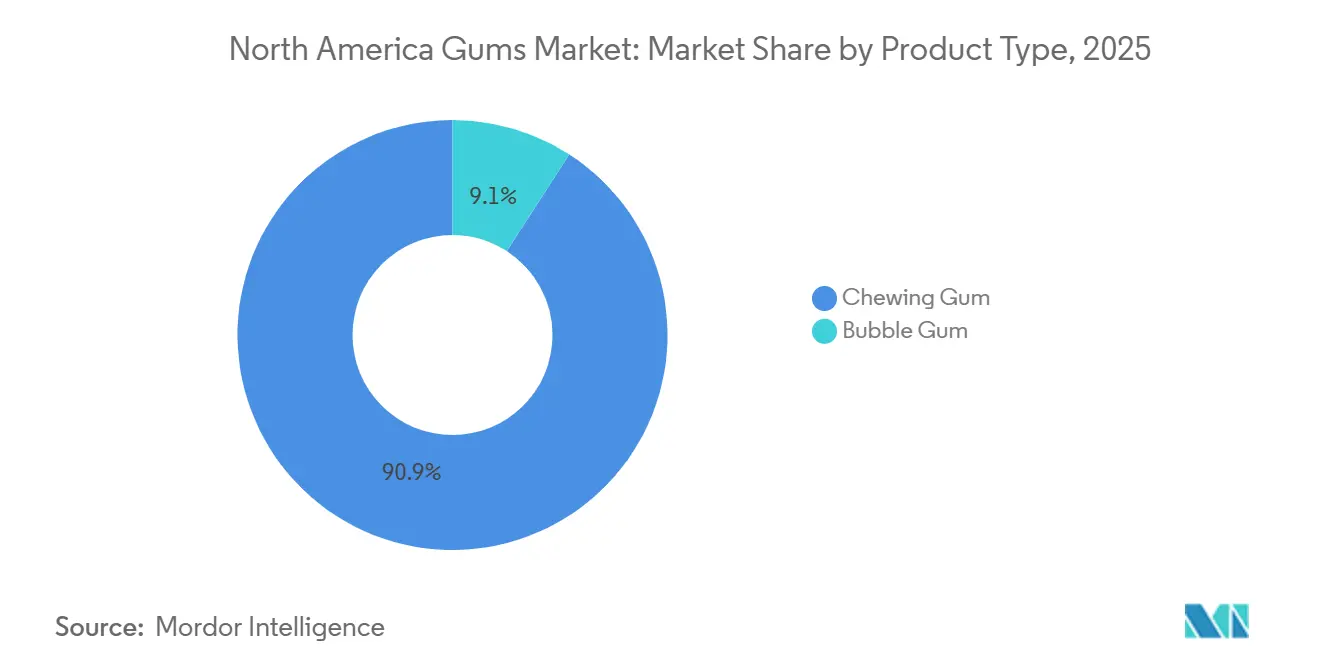
- By product type, chewing gum led with a 90.87% market share in 2025 and bubble gum is forecast to post a 5.27% CAGR through 2031.
- By packaging type, wraps/individual packs held 40.87% of the market size in 2025, while bottles/jars are advancing at a 5.54% CAGR to 2031.
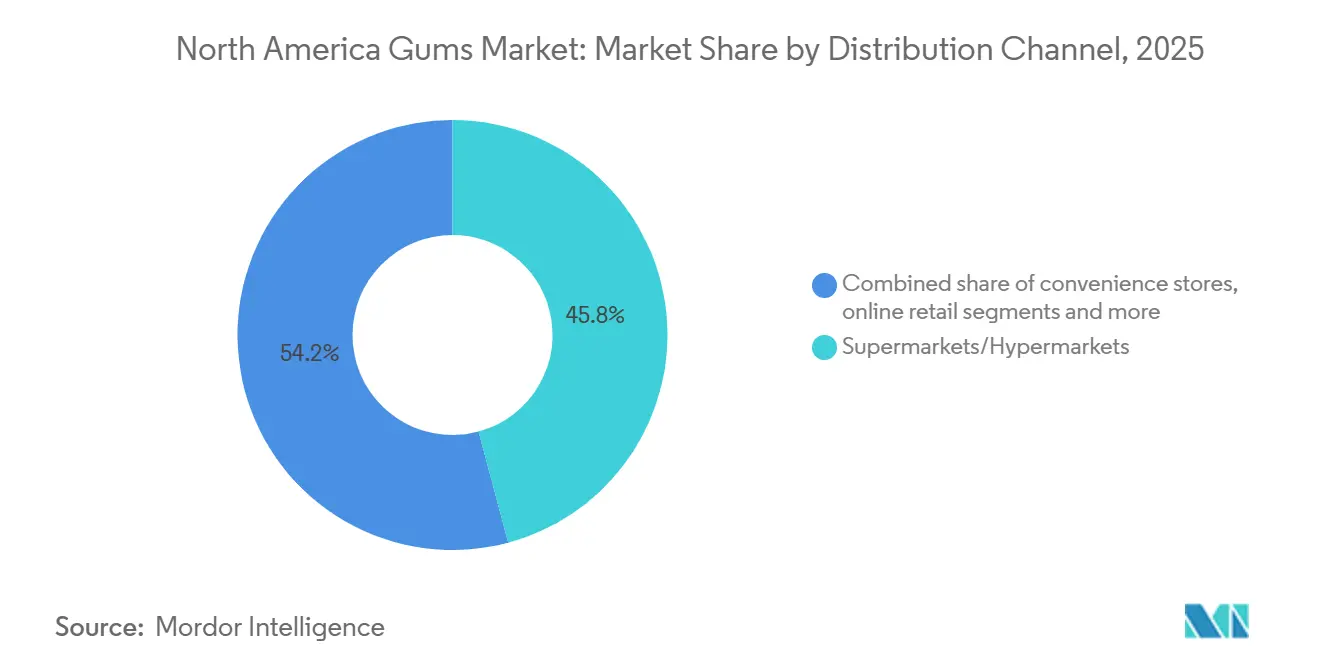
- By distribution channel, supermarkets/hypermarkets controlled 45.83% of the market size in 2025, yet online retail is expanding at a 6.03% CAGR over the same horizon.
- By geography, the United States contributed 68.92% of regional revenue in 2025 and Mexico is projected to record a 5.12% CAGR to 2031.
Note: Market size and forecast figures in this report are generated using Mordor Intelligence’s proprietary estimation framework, updated with the latest available data and insights as of January 2026.
North America Gums Market Trends and Insights
Drivers Impact Analysis*
| Driver | (~) % Impact on CAGR Forecast | Geographic Relevance | Impact Timeline |
|---|---|---|---|
| Rising demand for sugar-free and low-calorie gum products | +1.2% | North America (United States, Canada), with accelerated adoption in urban Mexico | Medium term (2-4 years) |
| Growing consumer focus on oral health and dental care | +0.9% | United States and Canada; emerging in Mexico | Long term (≥ 4 years) |
| Increasing popularity of functional and vitamin-enriched gums | +0.8% | United States (premium urban segments); early adoption in Canadian metropolitan areas | Medium term (2-4 years) |
| Product innovation in flavors, textures, and formats | +0.7% | North America-wide, with strongest impact in United States convenience and online channels | Short term (≤ 2 years) |
| Rising demand for portable and on-the-go confectionery | +0.6% | United States and Mexico (urbanization-driven); moderate in Canada | Short term (≤ 2 years) |
| High brand recognition and repeat consumption behavior | +0.5% | United States and Canada (established brand loyalty); building in Mexico | Long term (≥ 4 years) |
| Source: Mordor Intelligence | |||


Rising demand for sugar-free and low-calorie gum products
The North America gums market is witnessing increasing demand for sugar-free and low-calorie gum products, fueled by growing health consciousness among consumers. Rising awareness of diet-related health issues, particularly diabetes, is influencing purchasing behavior, as people seek alternatives that support oral care while minimizing sugar intake. According to the International Diabetes Federation (IDF) report, in 2024, approximately 13.7% of U.S. adults around 38.5 million people were living with diabetes, highlighting the significance of healthier product options[1]Source: International Diabetes Federation, “Diabetes in the United States of America, idf.org. This trend has prompted manufacturers to expand their sugar-free and low-calorie portfolios, offering a variety of flavors and functional benefits such as dental protection, fresh breath, and energy boosts. Retailers are increasingly stocking these products to meet consumer expectations, while marketing campaigns emphasize wellness and reduced sugar content.
Growing consumer focus on oral health and dental care
In North America, growing consumer focus on oral health and dental care is shaping the gums market as more individuals seek products that provide functional benefits beyond flavor and sweetness. Chewing gums enriched with xylitol, calcium, and other dental-friendly ingredients are gaining popularity for their ability to reduce cavity risk, strengthen teeth, and promote saliva production. Awareness campaigns by dental associations and educational initiatives have further encouraged the adoption of such gums as part of daily oral hygiene routines. Manufacturers are responding by launching specialized formulations that emphasize plaque reduction, enamel protection, and fresh breath. Retailers are actively promoting these products in pharmacies, supermarkets, and online platforms, highlighting their dental benefits. This heightened attention to oral health, coupled with consumer willingness to pay a premium for functional products, is contributing to sustained growth and innovation in the North American gums segment.
Increasing popularity of functional and vitamin-enriched gums
The North America gums market is experiencing rising interest in functional and vitamin-enriched gums, as consumers increasingly look for products that provide added health benefits alongside traditional chewing enjoyment. These gums are fortified with vitamins, minerals, caffeine, or herbal extracts to support immunity, energy, focus, and overall wellness. Busy lifestyles and growing health awareness have made such convenient, on-the-go formats particularly appealing to working adults and students. Manufacturers are expanding their portfolios with innovative flavors and targeted functional variants to cater to specific consumer needs. Retailers are promoting these products through both brick-and-mortar and online channels, highlighting their wellness and lifestyle benefits. Marketing campaigns often emphasize science-backed ingredients and claims, further boosting consumer trust and adoption.
Product innovation in flavors, textures, and formats
The North America gums market is being significantly shaped by product innovation in flavors, textures, and formats, as manufacturers strive to capture consumer attention and differentiate their offerings. Companies are introducing unique and exotic flavors, multi-layered taste experiences, and novel chewing textures to enhance enjoyment and maintain repeat purchases. Innovations also include diverse formats such as sugar-free sticks, bite-sized pellets, functional cubes, and resealable packs, catering to convenience and on-the-go consumption. Seasonal and limited-edition releases further stimulate interest and create excitement among younger consumers. Technological advances in gum base formulation and flavor encapsulation allow for longer-lasting taste and improved chewing experience. Retailers actively promote these new products through in-store displays, digital campaigns, and sampling programs to drive adoption.
Restraints Impact Analysis*
| Restraint | (~) % Impact on CAGR Forecast | Geographic Relevance | Impact Timeline |
|---|---|---|---|
| Environmental concerns related to non-biodegradable gum waste | -0.6% | United States and Canada (municipal cleanup costs, litter visibility); emerging regulatory pressure in urban Mexico | Medium term (2-4 years) |
| Volatility in raw material prices such as sweeteners and gum base | -0.5% | North America-wide, with greatest impact on smaller manufacturers lacking vertical integration | Short term (≤ 2 years) |
| Health concerns regarding artificial sweeteners and additives | -0.4% | United States and Canada (consumer skepticism, social-media amplification); moderate in Mexico | Medium term (2-4 years) |
| Strong competition from alternative snacks and confectionery | -0.3% | United States (saturated confectionery market); moderate in Canada and Mexico | Long term (≥ 4 years) |
| Source: Mordor Intelligence | |||
Volatility in raw material prices such as sweeteners and gum base
The North America gums market faces challenges due to volatility in raw material prices, particularly for sweeteners and gum base components. Fluctuating costs of key inputs such as chicle, jelutong, natural resins, and synthetic polymers can significantly impact production expenses and profit margins for manufacturers. According to the U.S. Bureau of Labor Statistics Producer Price Index for gum and wood chemicals, a proxy for these raw materials, values rose from 525.764 in October 2025 to 526.653 in December 2025, reflecting persistent upward pressure on supply costs[2]Source: Federal Reserve Bank of St.Louis, “Producer Price Index by Commodity: Chemicals and Allied Products: Gum and Wood Chemicals, Including Wood Distillation Products”, fred.stlouisfed.org. Rising sweetener prices, driven by changes in sugar and alternative sweetener markets, further add to cost uncertainties. These fluctuations can limit manufacturers’ flexibility in pricing and promotional strategies, while potentially increasing retail prices for consumers. Overall, the unpredictability of input costs remains a significant factor influencing operational and financial planning in the North American gums industry.
Health concerns regarding artificial sweeteners and additives
The North America gums market is increasingly influenced by health concerns related to artificial sweeteners and additives, as consumers scrutinize the safety and sustainability of synthetic ingredients. This focus extends beyond sugar content to encompass artificial flavors, sweeteners, and petroleum-based polymers commonly used in conventional gum bases. Research conducted by UCLA in March 2025 highlighted that chewing gum can release up to 3,000 microplastic particles per piece, raising concerns about long-term ingestion of microplastics[3]Source: American Chemical Society, "Chewing gum can shed microplastics into saliva, pilot study finds", www.acs.org. Such findings have heightened consumer awareness, particularly among health-conscious and environmentally aware demographics, who are often the primary market for premium and functional gums. In response, manufacturers are facing pressure to reformulate products with natural, plant-based, or biodegradable ingredients while maintaining taste and texture.
*Our forecasts treat driver/restraint impacts as directional, not additive. The impact forecasts reflect baseline growth, mix effects, and variable interactions.
Segment Analysis
By Product Type: Chewing Gum Anchors Revenue, Bubble Gum Targets Nostalgia
In 2025, the chewing gum segment dominated the North America gums market, capturing a commanding 90.87% market share. This substantial lead reflects the segment’s strong consumer preference and widespread distribution across retail channels. Chewing gum continues to benefit from established brand loyalty, innovative flavors, and functional variants, such as sugar-free and dental care gums. The segment’s maturity is supported by consistent demand from both adults and younger consumers, making it a stable revenue generator for manufacturers. Additionally, ongoing marketing campaigns and seasonal promotions further reinforce chewing gum’s market dominance.
On the other hand, bubble gum is projected to be the fastest-growing segment in the North America gums market, with an anticipated CAGR of 5.27% from 2026 to 2031. This growth is driven by increasing popularity among children and teenagers, who are attracted to its colorful packaging and playful flavors. Manufacturers are also introducing innovative variants, including sour and fizzy options, to capture emerging consumer trends. Additionally, bubble gum’s growth is supported by marketing collaborations, social media campaigns, and brand tie-ins with entertainment franchises. The segment’s rising appeal is further amplified by expansion into non-traditional retail channels, such as e-commerce and convenience stores.


By Packaging Type: Wraps Dominate, Bottles Gain on Value Proposition
The wraps/individual packs segment led the gum market in North America, accounting for 40.87% of the segment’s total market size in 2025. This dominant share reflects strong consumer preference for convenient, single-serve options that are easy to carry and consume on the go. The popularity of individual packs is further reinforced by their affordability and frequent promotions in retail outlets. Brands are continuously innovating with packaging designs and flavors to enhance consumer appeal and maintain loyalty. Additionally, wraps/individual packs benefit from widespread availability across supermarkets, convenience stores, and online channels.
Conversely, the bottles/jars segment is projected to be the fastest-growing format, with an estimated CAGR of 5.54% from 2026 to 2031. Growth in this segment is driven by consumer demand for bulk purchases, value packs, and family-sized offerings. Bottles and jars also appeal to health-conscious and budget-conscious consumers who prefer larger quantities for extended use. Manufacturers are enhancing the segment’s attractiveness through resealable packaging, premium variants, and multi-flavor assortments. Furthermore, increased presence in modern retail formats and e-commerce platforms is accelerating adoption.
By Distribution Channel: Online Retail Disrupts Traditional Shelf Dominance
In 2025, Supermarkets and Hypermarkets emerged as the dominant distribution channel for gums in North America, capturing 45.83% of the market. This leading share is attributed to the extensive reach of these retail formats, which provide consumers with convenient, one-stop shopping experiences. Supermarkets and hypermarkets benefit from high foot traffic, wide product assortments, and frequent promotional campaigns that drive sales. Additionally, brand visibility and in-store marketing efforts, such as end-cap displays and seasonal promotions, further reinforce their market dominance. The availability of both premium and value packs in these outlets caters to diverse consumer preferences.
In contrast, online retail is poised to be the fastest-growing distribution channel, with an expected CAGR of 6.03% from 2026 to 2031. Growth in this channel is fueled by the rising popularity of e-commerce platforms and increasing consumer comfort with digital shopping. Online retail offers advantages such as doorstep delivery, subscription services, and access to niche or international gum brands that may not be widely available in physical stores. Moreover, targeted digital marketing, personalized recommendations, and bundle deals are driving higher consumer engagement. The segment also benefits from changing lifestyle trends, including busy schedules and a preference for contactless shopping.
Geography Analysis
In 2025, the United States dominated the North America gums market, contributing 68.92% of the region’s total revenue. This commanding share reflects the country’s large consumer base, high per capita consumption of gums, and the presence of established global and domestic brands. Strong retail infrastructure, extensive marketing campaigns, and widespread availability across supermarkets, convenience stores, and online platforms further reinforce the U.S. market’s dominance. Additionally, innovation in flavors, functional variants such as sugar-free and dental care gums, and seasonal promotions continue to drive consumer demand. The mature market also benefits from brand loyalty and repeated purchases, ensuring steady revenue streams.
Meanwhile, Mexico is projected to emerge as the fastest-growing market in the region, with an estimated CAGR of 5.12% from 2026 to 2031. Growth in Mexico is fueled by increasing urbanization, rising disposable incomes, and growing awareness of oral care and confectionery products. Manufacturers are expanding distribution channels, including supermarkets, convenience stores, and e-commerce platforms, to tap into the growing demand. Innovative product launches, localized flavors, and affordable pricing strategies are also contributing to the market’s expansion. The rising popularity of chewing and bubble gums among younger consumers further supports growth prospects.
Canada represents another significant geography within the North American gums market, characterized by steady growth and consistent consumer demand. The market in Canada is driven by high-quality standards, health-conscious consumers, and widespread adoption of sugar-free and functional gum variants. Retail channels such as supermarkets, convenience stores, and pharmacies dominate product distribution, while e-commerce is gradually gaining traction. Canadian consumers also exhibit strong brand loyalty, favoring established global and local gum brands. Additionally, innovative packaging formats and seasonal promotions contribute to maintaining consumer engagement.
Competitive Landscape
The North America gums market exhibits a moderately high concentration, with a few leading global and regional players dominating a significant portion of the market. Companies such as Mars Inc., Perfetti Van Melle, Mondelez International, and The Hershey Company hold substantial market shares due to their strong brand portfolios and extensive distribution networks. These players leverage established consumer loyalty, extensive marketing campaigns, and frequent product innovations to maintain their leadership positions. Their dominance is reinforced by widespread presence across supermarkets, convenience stores, and e-commerce platforms, ensuring consistent availability of their products.
Smaller brands are leveraging unique flavors, natural ingredients, and eco-friendly packaging to differentiate themselves and capture niche consumer segments. The rise of sugar-free, functional, and organic gums has provided opportunities for these companies to innovate and expand their offerings. Moreover, digital marketing, social media engagement, and direct-to-consumer e-commerce strategies allow emerging players to reach younger audiences effectively. Although these companies operate on a smaller scale compared to the industry leaders, their agile approach enables rapid response to changing consumer preferences.
Strategic initiatives such as mergers, acquisitions, partnerships, and regional expansions are shaping the competitive landscape in North America. Leading companies are actively pursuing collaborations with retailers and online platforms to enhance distribution and strengthen brand visibility. Additionally, innovation in packaging formats, flavor extensions, and functional variants remains a key differentiator among competitors. Investments in marketing campaigns and promotional activities further intensify rivalry in the market. Sustainability initiatives, including recyclable packaging and reduced sugar content, are also emerging as important competitive factors.
North America Gums Industry Leaders
-
Mondelēz International Inc.
-
The Hershey Company
-
Perfetti Van Melle B.V.
-
The PUR Company, Inc.
-
Mars, Incorporated
- *Disclaimer: Major Players sorted in no particular order

Recent Industry Developments
- January 2026: Milliways, a global leader in chewing gum, has successfully raised USD 3 million to accelerate its expansion efforts in the United States. The brand actively offers a diverse range of flavors, including Spearmint, Peppermint, and Strawberry, which are conveniently packaged in 10- and 30-piece packs to cater to varying consumer preferences.
- May 2025: Perfetti Van Melle USA announced a range of new and relaunched products for its gum portfolio, including the Bubblicious bubblegum with an original five‑piece flavor and enhanced watermelon variant. The company also introduced Trident Vibes Cotton Candy the only sugar‑free cotton candy‑flavored gum nationally available—and Mentos Chewy Mint Discovery Rolls featuring 14 combined fruity flavors in a single roll.
- January 2024: Mars, Incorporated announced a monumental makeover for its flagship gum brand, encompassing updated packaging, refreshed brand identity, and a comprehensive marketing campaign aimed at strengthening competitive positioning and consumer engagement in the North American market. The investment signals Mars' commitment to defending market share amid intensifying competition and shifting consumer preferences toward functional and health-oriented gum formulations.


North America Gums Market Report Scope
Gums are chewable, flavored, and often sweetened products made primarily from a gum base, which gives them elasticity and texture. The North America gums market is segmented by product type, packaging type, distribution channel and geography. By product type, the market is segmented into chewing gum and bubble gum. By packaging type, the market is segmented by wraps/individual packs, bottles/jars, boxes and others. Based on distribution channel, the market is segmented into supermarkets/hypermarkets, convenience stores, online retail and other distribution channels. By geography, the market is segmented into the United States, Canada, Mexico, and the rest of North America. The Market Forecasts are Provided in Terms of Value (USD).
| Bubble Gum |
| Chewing Gum |
| Bottles/Jars |
| Wraps/Individual Packs |
| Boxes |
| Others |
| Supermarkets/Hypermarkets |
| Convenience Stores |
| Online Retail |
| Other Distribution Channels |
| United States |
| Canada |
| Mexico |
| Rest of North America |
| By Product Type | Bubble Gum |
| Chewing Gum | |
| By Packaging Type | Bottles/Jars |
| Wraps/Individual Packs | |
| Boxes | |
| Others | |
| By Distribution Channel | Supermarkets/Hypermarkets |
| Convenience Stores | |
| Online Retail | |
| Other Distribution Channels | |
| By Geography | United States |
| Canada | |
| Mexico | |
| Rest of North America |


Market Definition
- Milk and White Chocolate - Milk chocolates is a solid chocolate made with milk (in the form of either milk powder, liquid milk, or condensed milk) and cocoa solids. White chocolate is made from cocoa butter and milk and contains no cocoa solids whatsoever. The scope includes regular chocolates, low-sugar, and sugar-free variants
- Toffees & Nougats - Toffees include hard, chewy, and small or one-bite candies marketed with labels as toffee or toffee-like confectionery. Nougat is a chewy confection with almond, sugar, and egg white as a basic ingredient; and it originated in Europe and Middle East countries.
- Cereals Bars - A snack composed of breakfast cereal that has been compressed into a bar shape and is held together with a form of edible adhesive. The scope includes snack bars made with cereals such as rice, oats, corn, etc. mixed with a binding syrup. These also include products labeled as cereal bars, cereal treat bars, or grain bars.
- Chewing Gum - This is a preparation for chewing, usually made of flavored and sweetened chicle or such substitutes as polyvinyl acetate. The types of chewing gums included in the scope are sugar-chewing gums and sugar-free chewing gums
| Keyword | Definition |
|---|---|
| Dark Chocolate | Dark chocolate is a form of chocolate containing cocoa solids and cocoa butter without the milk. |
| White Chocolate | White chocolate is the type of chocolate containing the highest percentage of milk solids, typically around or over 30 percent. |
| Milk Chocolate | Milk chocolate is made from dark chocolate that has a low cocoa solid content and higher sugar content, plus a milk product. |
| Hard Candy | A candy made of sugar and corn syrup boiled without crystallizing. |
| Toffees | A hard, chewy, often brown sweet that is made from sugar boiled with butter. |
| Nougats | A chewy or brittle candy containing almonds or other nuts and sometimes fruit. |
| Cereal bar | A cereal bar is a bar-shaped food product, made by pressing cereals and usually dried fruit or berries, which are in most cases held together by glucose syrup. |
| Protein bar | Protein bars are nutrition bars that contain a high proportion of protein to carbohydrates/fats. |
| Fruit & Nut bar | These are often based on dates with other dried fruit and nut additions and, in some cases, flavorings. |
| NCA | The National Confectioners Association is an American trade organization that promotes chocolate, candy, gum and mints, and the companies that make these treats. |
| CGMP | Current good manufacturing practices are those conforming to the guidelines recommended by relevant agencies. |
| Unstandardized foods | Unstandardized foods are those that do not have a standard of identity or that deviate from a prescribed standard in any manner. |
| GI | The glycemic index (GI) is a way of ranking carbohydrate-containing foods based on how slowly or quickly they are digested and increase blood glucose levels over a period of time |
| Skimmed milk powder | Skimmed milk powder is obtained by removing water from pasteurized skim milk by spray-drying. |
| Flavanols | Flavanols are a group of compounds found in cocoa, tea, apples, and many other plant-based foods and beverages. |
| WPC | Whey protein concentrate- the substance obtained by the removal of sufficient nonprotein constituents from pasteurized whey so that the finished dry product contains greater than 25% protein. |
| LDL | Low density Lipoprotein- the bad cholesterol |
| HDL | High density Lipoprotein- the good cholesterol |
| BHT | butylated Hydroxytoluene is a lab-made chemical that is added to foods as a preservative. |
| Carrageenan | Carrageenan is an additive used to thicken, emulsify, and preserve foods and drinks. |
| Free form | Not containing certain ingredients, such as gluten, dairy, or sugar. |
| Cocoa butter | It is a fatty substance obtained from cocoa beans, used in the manufacture of confectionery. |
| Pastellies | A type of of Brazilian candy made from sugar, eggs, and milk. |
| Draggees | Small, round candies that are coated with a hard sugar shell |
| CHOPRABISCO | Royal Belgian Association of the chocolate, pralines, biscuit, and confectionery industry- A trade association that represents the Belgian chocolate industry. |
| European Directive 2000/13 | A European Union directive that regulates the labeling of food products |
| Kakao-Verordnung | The German chocolate ordinance, a set of regulations that define what can be labeled as "chocolate" in Germany. |
| FASFC | Federal Agency for the Safety of the Food Chain |
| Pectin | A natural substance that is derived from fruits and vegetables. It is used in confectionery to create a gel-like texture. |
| Invert sugars | A type of sugar that is made up of glucose and fructose. |
| Emulsifier | A substance that helps to mix to liquids that does not mix together. |
| Anthocyanins | A type of flavonoid that is responsible for the red, purple, and blue colors of confectionery. |
| Functional Foods | Foods that have been modified to provide additional health benefits beyond basic nutrition. |
| Kosher certificate | This certification verifies that the ingredients, production process including all machinery, and/or food-service process complies with the standards of Jewish dietary law |
| Chicory root extract | A natural extract from the chicory root that is a good source of fiber, calcium, phosphorous, and folate |
| RDD | Recommended daily dose |
| Gummies | A chewy gelatin-based candy that is often flavored with fruit. |
| Nutraceuticals | Food or dietary supplements that are claimed to have health benefits. |
| Energy bars | Snack bars that are high in carbohydrates and calories are designed to provide energy on the go. |
| BFSO | Belgian Food Safety Organization for the food chain. |


Research Methodology
Mordor Intelligence follows a four-step methodology in all our reports.
- Step-1: Identify Key Variables: In order to build a robust forecasting methodology, the variables and factors identified in Step 1 are tested against available historical market numbers. Through an iterative process, the variables required for market forecast are set, and the model is built on the basis of these variables.
- Step-2: Build a Market Model: Market-size estimations for the forecast years are in nominal terms. Inflation is not a part of the pricing, and the average selling price (ASP) is kept constant throughout the forecast period for each country.
- Step-3: Validate and Finalize: In this important step, all market numbers, variables, and analyst calls are validated through an extensive network of primary research experts from the market studied. The respondents are selected across levels and functions to generate a holistic picture of the market studied.
- Step-4: Research Outputs: Syndicated Reports, Custom Consulting Assignments, Databases & Subscription Platforms


