
Aquafeed Additives Market Size and Share
Market Overview
| Study Period | 2021 - 2031 |
|---|---|
| Market Size (2026) | USD 3.03 Billion |
| Market Size (2031) | USD 3.79 Billion |
| Growth Rate (2026 - 2031) | 4.55 % |
| Fastest Growing Market | Europe |
| Largest Market | Asia Pacific |
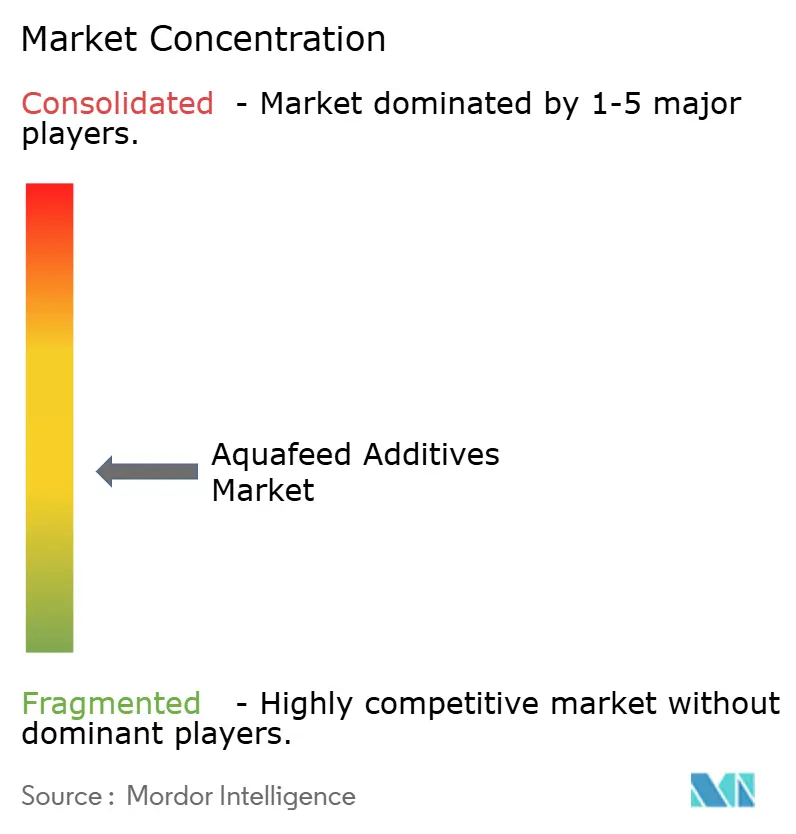
| Market Concentration | Medium |
Major Players *Disclaimer: Major Players sorted in no particular order Image © Mordor Intelligence. Reuse requires attribution under CC BY 4.0. | |
Aquafeed Additives Market Analysis by Mordor Intelligence
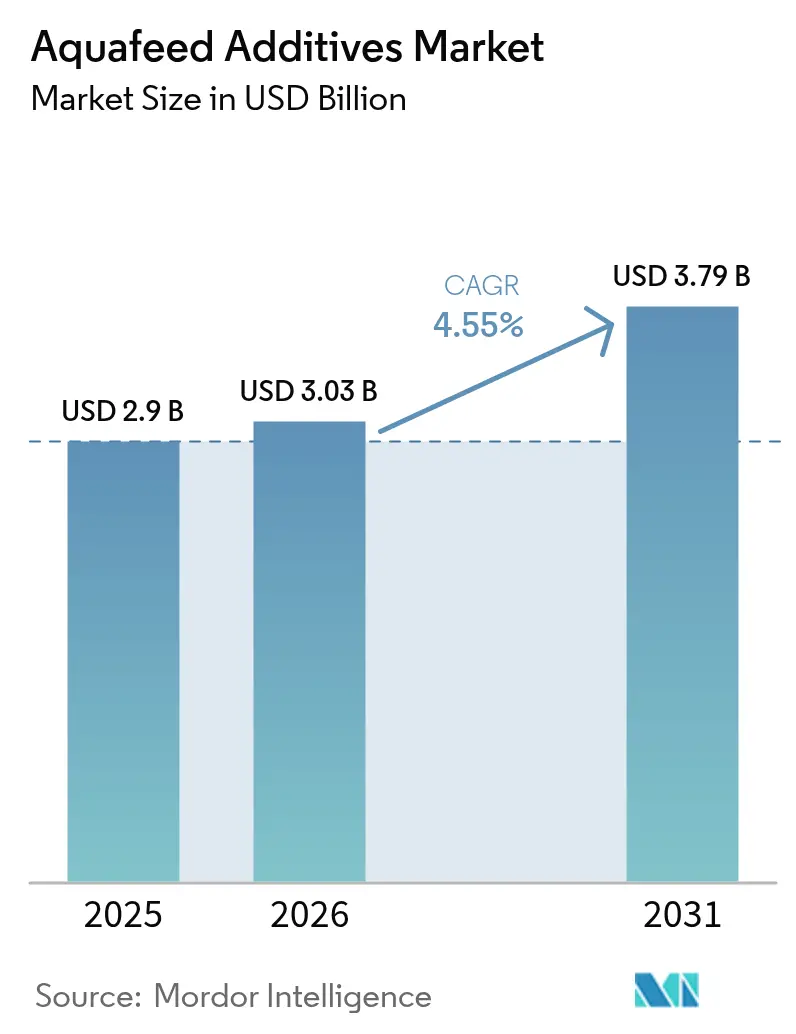
Aquafeed Additives Market size market size in 2026 is estimated at USD 3.03 billion, growing from 2025 value of USD 2.9 billion with 2031 projections showing USD 3.79 billion, growing at 4.55% CAGR over 2026-2031. Strong demand for functional nutrition, tighter antibiotic-use rules, and finite fishmeal supplies are steering feed formulators toward precision-engineered additives that raise feed conversion efficiency and protect fish health. Europe’s regulatory push for sustainable aquaculture and Asia-Pacific’s production scale jointly underpin volume growth, while emerging protein sources such as single-cell biomass widen the portfolio of compatible additives. Investments in AI-driven feeding systems that cut wastage by 10-20% further enhance uptake, especially among high-value salmon and shrimp operators. Volatile fishmeal prices and lengthy approval timelines temper progress, yet government incentive programs from the European Union's (EU’s) Horizon funds to Saudi Arabia’s Vision 2030 offset part of the risk.
Key Report Takeaways
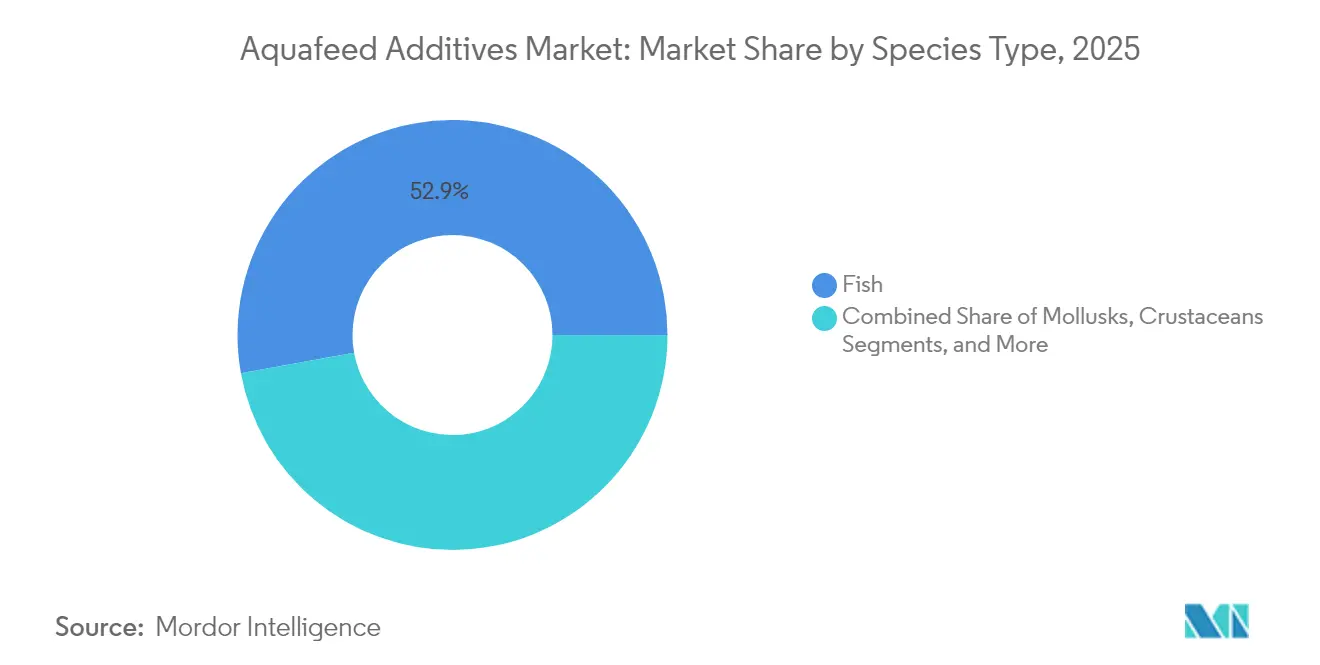
- By species type, fish held 52.85% of the aquafeed additives market share in 2025, while crustaceans are projected to rise at a 8.92% CAGR by 2031.
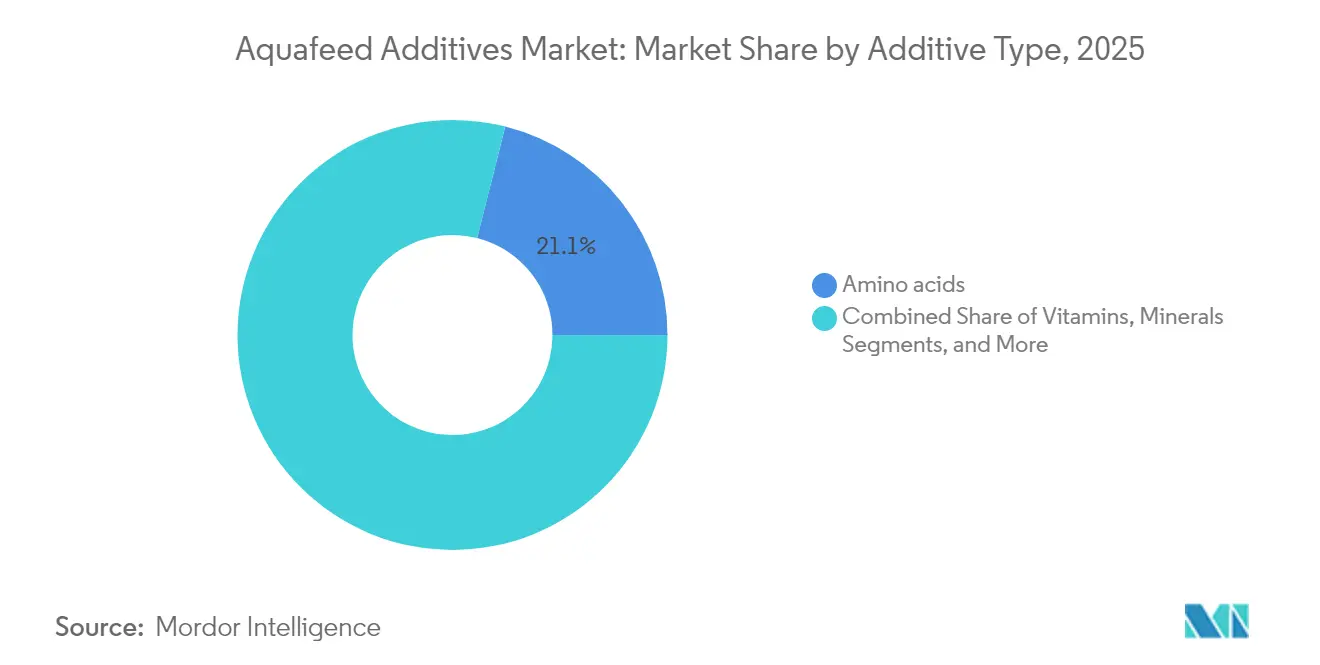
- By additive type, amino acids led with 21.05% of the aquafeed additives market size in 2025; probiotics and prebiotics post the fastest growth at 9.21% CAGR.
- By form, dry extruded pellets accounted for 67.05% of the aquafeed additives market size in 2025, and the micro-encapsulated powders are projected at an 10.78% CAGR.
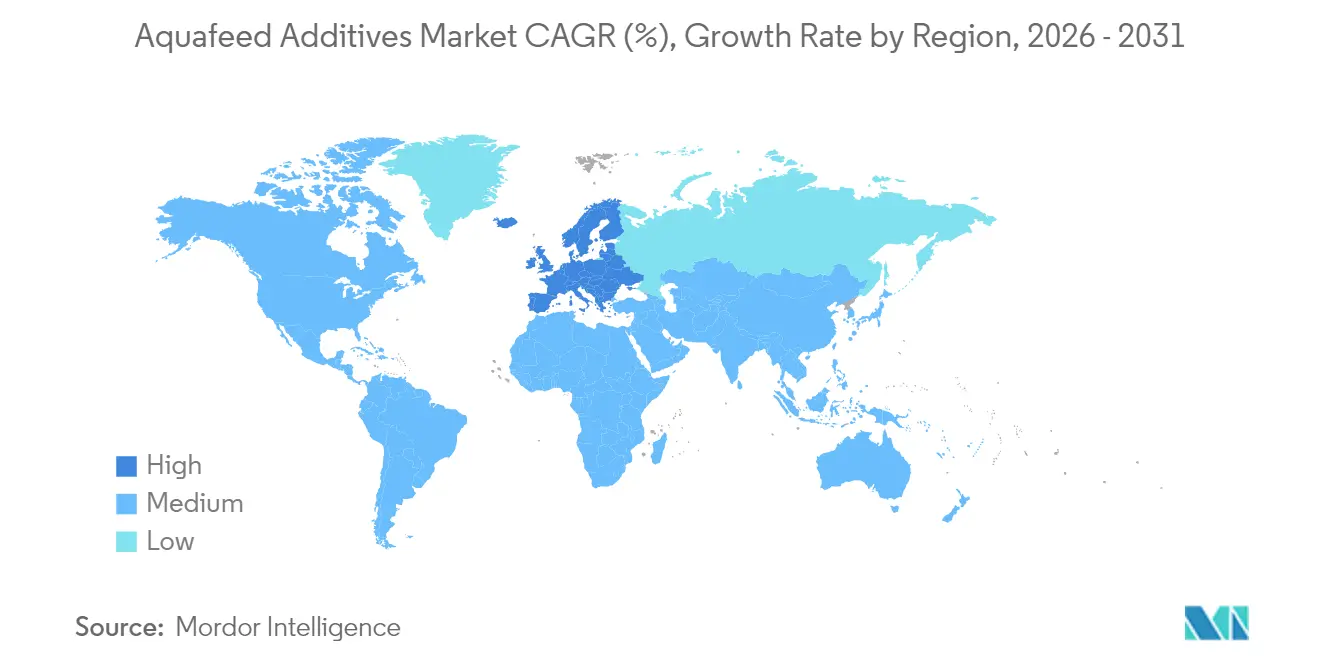
- By geography, Asia-Pacific captured 61.05% revenue share in 2025, but Europe registers the highest regional CAGR of 8.05% through 2031.
Note: Market size and forecast figures in this report are generated using Mordor Intelligence’s proprietary estimation framework, updated with the latest available data and insights as of 2026.
Market Trends and Insights
Drivers Impact Analysis of Aquafeed Additives Market*
| Driver | (~) % Impact on CAGR Forecast | Geographic Relevance | Impact Timeline |
|---|---|---|---|
| Rising global seafood consumption and protein shift | +1.2% | Global, strongest in Asia-Pacific and Europe | Medium term (2-4 years) |
| Expansion of intensive aquaculture capacity | +0.9% | Asia-Pacific core, spill-over to Middle East and Africa | Long term (≥4 years) |
| Government subsidies and sustainability mandates in aquaculture | +0.7% | Europe and North America, rising in Middle East | Medium term (2-4 years) |
| Functional additives replacing in-feed antibiotics | +0.8% | Global, led by EU, adopted in Asia-Pacific | Short term (≤2 years) |
| Carbon-footprint labeling spurring micro-algae and single-cell additives | +0.5% | Europe and North America | Long term (≥4 years) |
| AI-driven precision feeding enabling higher specialty-additive inclusion | +0.4% | Europe, North America, select Asia-Pacific | Medium term (2-4 years) |
| Source: Mordor Intelligence | |||
Rising Global Seafood Consumption and Protein Shift
Global protein demand is moving toward aquatic sources. Africa alone is forecast to raise seafood intake from 10 million metric tons to 29 million metric tons by 2050,[1] a trajectory mirrored in Asia, where tilapia integrators are localizing feed mills to cut imports. FAO expects farm-raised fish prices to climb 24% by 2030, encouraging producers to adopt additives that deliver faster growth and shorten production cycles. Retailers such as Albert Heijn now stock shrimp fed on insect meal and algal oil, signaling buyer acceptance of alternative feed technologies. This demand pivot supports amino acid and enzyme use in plant-based diets that replace fishmeal while sustaining optimal amino-acid profiles for performance. Consequently, the aquafeed additives market gains resilience against fishmeal volatility.
Expansion of Intensive Aquaculture Capacity
Saudi firm NAQUA operates 500 ponds and targets 250,000 metric tons of annual output by 2030, highlighting the global shift toward high-density systems that rely on robust probiotic and water-quality programs. In China, intensive shrimp farms produced 2.09 million metric tons in 2022, yet faced germplasm depletion and disease risks that drive uptake of immune-boosting additives. Recirculating aquaculture systems and biofloc require precision nutrient packages to sustain microbial balance, creating premium demand pockets. The aquafeed additives market, therefore, benefits from clustered, technology-driven expansions across Asia, the Middle East, and South America.
Government Subsidies and Sustainability Mandates in Aquaculture
The EU-funded Care4Aqua project channels EUR 4.8 million (USD 5.05 million) into antibiotic-free feed solutions and selective breeding support, accelerating additive trials that target water quality and immunity. Updated European green-feed codes reward sustainable formulations, while the US Strategic Plan for Aquaculture advances infrastructure backing that welcomes novel additives.[2] In Saudi Arabia, SALIC’s acquisition of a 42.4% stake in NAQUA aligns with state-driven scale-up goals, channeling funds into feed plants and additive partnerships. Nonetheless, fragmented subsidy reporting hampers full market transparency. Overall, policy incentives lower (Capital Expenditure) CAPEX risk and accelerate product validation across the aquafeed additives market.
Functional Additives Replacing In-Feed Antibiotics
European Union approval of juniper essential oil for all food-producing animals underscores the regulatory preference for phytogenic antimicrobials over antibiotics. Probiotic Bacillus licheniformis cultures have yielded superior growth and survivability in hybrid grouper trials. Studies indicate that digital monitoring platforms can effectively track probiotic performance in aquaculture, supporting integration with data-driven feeding systems. FDA (Food and Drug Administration) guidance has clarified petition routes, yet mandates exhaustive safety dossiers that lengthen lead times. Turmeric oil’s quorum-sensing disruption against Aeromonas hydrophila exemplifies dose-dependent pathogen control via botanicals. The aquafeed additives market thus pivots toward multi-functional blends that satisfy health, regulatory, and consumer criteria.
Restraints Impact Analysis of Aquafeed Additives Market*
| Restraint | (~) % Impact on CAGR Forecast | Geographic Relevance | Impact Timeline |
|---|---|---|---|
| Volatile fishmeal and fish-oil pricing impacting additive cost pass-through | -0.8% | Global, strongest in cost-sensitive Asian markets | Short term (≤ 2 years) |
| Stringent multi-region approval timelines for novel feed additives | -0.6% | Europe and North America regulatory markets, affecting global launches | Medium term (2-4 years) |
| Micro-plastics scrutiny on pellet binders and coating agents | -0.4% | Europe and North America, emerging concerns in Asia-Pacific | Medium term (2-4 years) |
| Climate-induced crop failures tightening phytobiotic supply | -0.5% | Global, especially Mediterranean and tropical regions | Short term (≤ 2 years) |
| Source: Mordor Intelligence | |||
Volatile Fishmeal and Fish-Oil Pricing Impacting Additive Cost Pass-Through
Volatile fishmeal and fish-oil prices disrupt aquafeed additive manufacturers, complicating cost pass-through and profitability. Peru’s 300% surge in fishmeal output lifted global production by 75% in January 2025, yet price swings restrict manufacturers’ ability to price through additive premiums. Fish oil output climbed 34%, but suppliers leveraged compressed margins as feed makers struggled to absorb dual cost pressures. China’s aquafeed output fell 3.5% in 2024 amid flooding and farmer cost-cutting, illustrating how volatility curbs additive uptake. FAO foresees fishmeal prices rising 30% by 2030, quickening the search for insect meal or single-cell proteins that demand new additive calibrations. Supply-chain uncertainty, particularly the reliance on frozen fish inputs until September 2025, complicates inventory planning for the aquafeed additives market.
Stringent Multi-Region Approval Timelines for Novel Feed Additives
Lengthy evaluation processes, varying compliance requirements, and extensive safety trials delay market entry, increasing costs for innovators. EFSA (European Food Safety Authority) authorizations average 3-4 years, and the 2021 Transparency Regulation layers extra disclosure steps that can trigger resubmissions if data gaps appear. The Magni-PHI case for poultry shows that toxicology and environmental studies often extend beyond the initial scope before approval. In the US, Food Additive Petitions remain the most onerous path, prompting some developers to pursue (Generally Recognized as Safe) GRAS or AAFCO (Association of American Feed Control Officials) listing first. Divergent dossiers for EU and US regulators elevate legal and scientific costs, a drag on smaller innovators. Mealworm-powder authorization in January 2025 came two years after European Food Safety Authority (EFSA) safety clearance, illustrating typical pacing.[3] Such lags defer revenue capture across the aquafeed additives market.
*Our forecasts treat driver/restraint impacts as directional, not additive. The impact forecasts reflect baseline growth, mix effects, and variable interactions.
Aquafeed Additives Market Segment Analysis
By Species Type:
Fish Hold the Majority While Crustaceans Lead GrowthFish represented 52.85% of the aquafeed additives market share in 2025, remaining the largest consumer group due to the extensive farming of salmon, tilapia, and carp globally. This dominance converted into an estimated USD 1.53 billion slice of the aquafeed additives market size in 2025, illustrating the purchasing power of operators that have standardized additive protocols to safeguard feed-conversion ratios. Salmon producers in Norway and Chile continue to layer functional amino acids and antioxidants that counteract stress during high-density grow-out and transport phases, the Asian carp farms emphasize cost-effective vitamin and enzyme packages to hit tight feed budgets. Established feed mills already integrate digital traceability, so any additive that demonstrates a measurable uplift in feed efficiency or fillet yield quickly scales through long-term supply contracts. Consequently, fish farming sets the baseline specification that most suppliers use when validating new ingredients.
Crustaceans, led by shrimp, display the fastest adoption curve with a 8.92% CAGR through 2031 as producers justify the higher additive spend to offset still-elevated disease risks and achieve premium coloration. Trials using 5% astaxanthin-rich krill oil have delivered 100% survival under salinity stress while raising market value through deeper pigmentation, reinforcing willingness to pay for specialty inputs. Chinese farmers continue turning to multi-phase functional diets that include immunostimulant probiotics, the South American growers focus on encapsulated phytogenics that resist leaching in brackish ponds. Mollusks and niche species such as sea cucumbers remain small but notable, with micronized mineral blends enhancing shell strength and texture attributes that fetch superior prices in gourmet channels. As demand diversifies, suppliers tailor species-specific additive bundles, positioning the aquafeed additives market for steady volume and value gains across distinct production segments.

By Form:
Micro-Encapsulation Transforms Delivery SystemsDry extruded pellets dominated with 67.05% of the aquafeed additives market share in 2025, translating into the largest slice of the aquafeed additives market size because most commercial ponds and cages already rely on automated feeders that dispense uniform pellets with predictable sink rates. High output lines in Asia and South America prefer this form since its hardness, moisture profile, and dust level can be adjusted quickly to suit species' needs while keeping production costs low. Feed mills now fine-tune pellet matrices with heat-stable enzymes and encapsulated vitamins to cut nutrient losses during extrusion and subsequent bulk handling. Operators also monitor pellet breakage because fines clog precision feeders and inflate wastage, prompting suppliers to refine binder ratios and introduce optical sorters for tighter quality control.
Micro-encapsulated powders post the fastest 10.78% CAGR through 2031 as coacervation and electrostatic spray drying shield sensitive bioactives from heat and humidity, extending shelf life to 18 months under warehouse conditions. Encapsulation efficiencies as high as 99% preserve omega-3 fatty acids, essential oils, and probiotics until they hit the gut, which improves efficacy and lets formulators lower inclusion rates without sacrificing performance. Uniform particle size supports homogeneous dispersion in mash or pellet coatings, reducing hotspot risks that can trigger palatability dips or off-flavors. As farms install AI-guided dispensers capable of dosing micron-scale supplements directly into water columns, demand for low-dust, free-flowing powders is set to accelerate. Together, these trends are reshaping formulation strategy, pushing suppliers to balance the cost advantages of traditional pellets with the performance edge that advanced encapsulation brings.
By Additive Type:
Probiotics Surge Past Traditional CategoriesAmino acids retain a 21.05% market share in 2025, anchoring protein synthesis in diets and pushing fishmeal replacement above 35%. Probiotics and prebiotics exhibit a 9.21% CAGR, reflecting broad regulatory endorsement and field efficacy. Multi-strain blends at 2 grams per kilogram have enhanced growth and antioxidant enzyme activity in Cirrhinus mrigala, reducing FCR by 0.1 points on average. The aquafeed additives market size for probiotics is projected to climb from USD 0.38 billion in 2026 to USD 0.59 billion in 2031.
Enzyme innovation is another lever. Protease inclusion raises amino-acid digestibility, while phytase unlocks bound phosphorus, curbing mineral leaching in ponds. Vitamins A and E in nano-emulsions see uptake during temperature stress events, supporting oxidative resilience. Meanwhile, microbial astaxanthin from Phaffia rhodozyma offers a scalable alternative to crustacean by-product extraction, freeing supplies for salmonids. Collectively, these shifts deepen product diversity across the aquafeed additives market.
Geography Analysis
APAC Aquafeed Additives Market
Asia-Pacific contributed 61.05% of global revenue in 2025 and continues to anchor volume growth, led by China’s shrimp production surpassing 2 million metric tons. Disease outbreaks and protein-source shifts compel farms to layer immune-enhancing additives on top of core amino-acid packages. Vietnam and India are expanding export-oriented aquaculture, but price sensitivity shapes a two-tier market where premium additives coexist with cost-optimized blends.
Europe Aquafeed Additives Market
Europe’s aquafeed additives market size is projected to expand from USD 0.56 billion in 2026 to USD 0.83 billion by 2031 on an 8.05% CAGR as EU directives elevate sustainability requirements. Norway’s salmon sector leads precision feeding adoption, catalyzing trials of AI-supported dosing systems that elevate functional additive use efficiency. Horizon Europe projects funnel more than EUR 6 million (USD 6.95 million) into green-feed research annually, accelerating the commercialization of algae-derived antioxidants and phytonutrients.
North America Aquafeed Additives Market
North America presents a mature but innovation-friendly landscape. The US Strategic Plan for Aquaculture backs public-private infrastructures where additive developers pilot novel proteins or bacteriophage solutions under controlled conditions. Canada’s engagement with indigenous rights adds ESG layers that reward eco-friendly formulations. Meanwhile, Mexico’s shrimp operators deepen cross-border supplier ties, boosting additive throughput.
Regulatory Landscape
Aquafeed additives are shaped by additive-specific premarket authorization regimes in major regulatory markets, which in turn affect portfolio selection and launch sequencing for global suppliers. In the European Union, feed additives require authorization under Regulation (EC) No 1831/2003, with EFSA responsible for scientific risk assessment. Procedural requirements have continued tightening through updates to application and species-definition requirements, including 2026 changes to electronic application processes. The authorization pipeline also progresses via targeted renewals and amendments, such as the European Commission implementing action in February 2026 on thiamine forms used in animal nutrition.
China and the United States operate distinct pathways that can increase dossier duplication for multinational producers. In China, the Ministry of Agriculture and Rural Affairs (MARA) approves new feed additives and can attach multi-year post-approval monitoring obligations, which extends compliance timelines alongside market access. In the United States, FDA oversight under the Federal Food, Drug, and Cosmetic Act continues to rely on formal routes such as Food Additive Petitions. Meanwhile, legislative activity in 2025 (Innovative FEED Act, S. 1906) points to efforts to modernize review and create a new category for zootechnical-type substances, a direction that may support faster evaluation for certain functional ingredients, while still requiring robust safety and efficacy substantiation.
Competitive Landscape
The aquafeed additives market shows moderate fragmentation. Companies like Nutreco N.V. (Skretting), Evonik Industries AG, and Cargill, Incorporated are leveraging integrated chemical and commodity footprints. Their Research and Development budgets exceed USD 200 million annually, funding enzyme and phytogenic platforms. Mid-tier firms like ADM, Alltech, and Nutreco broaden portfolios via acquisitions, exemplified by Alltech’s EUR 7 million (USD 7.57 million) purchase of Raisio’s feed facility to scale Nordic nutrition solutions.
Technology remains a key differentiator. AKVA’s GBP 13.7 million (USD 17.5 million) acquisition of Observe Technologies embeds AI analytics into integrated farm management, a move anticipated to lift feed conversion by 5–7% on early deployments. Venture funding of USD 808 million flowed into aquaculture in the past year, highlighted by eFishery’s USD 200 million round targeting smart-feeding adoption. Start-ups such as String Bio gain traction after securing GRAS (Generally Recognized as Safe) status for microbial proteins, enabling additive pairing with novel substrates.
Expertise in regulatory compliance serves as a competitive advantage, with firms proficient in EFSA (European Food Safety Authority) dossier submissions collaborating with smaller ingredient innovators to accelerate market entry in the EU. Sustainability accreditation carbon labeling, ASC (Aquaculture Stewardship Council) compliance, and traceability platforms now feature heavily in supplier pitches. These dynamics collectively keep the aquafeed additives market competitive yet open to disruption.
Aquafeed Additives Industry Leaders
-
Nutreco N.V. (Skretting)
-
BioMar Group
-
Alltech
-
Evonik Industries AG
-
Cargill, Incorporated
- *Disclaimer: Major Players sorted in no particular order
Aquafeed Additives Market Companies Covered in this Report
- Benchmark Holdings plc (INVE Aquaculture)
- BASF SE
- Evonik Industries AG
- Adisseo
- Cargill, Incorporated
- Archer Daniels Midland (ADM)
- BioMar Group
- Alltech
- Nutreco N.V. (Skretting)
- Zeigler Feeds
- Kemin Industries, Inc.
- Phibro Animal Health Corporation
- Calysta Inc.
- Bentoli
- Phytobiotics Futterzusatzstoffe GmbH
Market Opportunities and Future Outlook
Opportunities are widening where sustainability mandates and fishmeal substitution push formulators toward alternative proteins and functional additive packages that protect performance. Industrial scale-up of insect ingredients offers a concrete pathway for additive suppliers to co-develop amino acid balancing, palatants, enzymes, and gut-health solutions that fit new raw material matrices. Innovafeed’s industrialization completion at its Nesle facility, along with its announcement of a EUR 51 million funding round in June 2026 for Hilucia product range commercialization, provides a clear example of this shift. Commercial partnerships that integrate insect ingredients into aquafeed for Mediterranean species, including Innovafeed and NaturAlleva in January 2026, also create near-term demand for stability, antioxidant, and digestive-support additives tailored to higher-fat and novel-protein diets.
A second opportunity is emerging in high-value pigmentation and functional health stacks for shrimp and salmonids, backed by new production investments in natural astaxanthin and vertical integration moves that secure additive access. Kuehnle AgroSystems (KAS) secured Series B funding in July 2026 to scale natural astaxanthin production via dark fermentation in collaboration with Corbion, reinforcing momentum for carotenoid-based additive programs. At the same time, consolidation by large feed players into additive manufacturing, such as Guangdong Yuehai Feed Group approving the acquisition of a majority stake in additive producer Yixing TianShi Feed in November 2024, highlights the strategic value of in-house or tightly aligned additive capability. This dynamic can open partnership and supply opportunities for specialist probiotic, phytogenic, encapsulation, and precision-nutrition providers that integrate with large feed mill platforms.
Recent Industry Developments in Aquafeed Additives Market
- June 2026: Alltech introduced Olerix, a phytogenic feed blend positioned to improve feed performance through gut health support. While launched for swine, the rollout points to continued investment in botanical functional ingredients that also compete for formulation space and supplier attention across animal nutrition, including aquafeed additive portfolios.
- December 2025: Mowi entered a strategic feed partnership with Skretting (Nutreco) aimed at improving cost efficiency and feed performance across Mowi’s farming operations. The agreement strengthens Skretting’s position as a key partner to large-scale salmon producers, reinforcing demand for differentiated additive systems embedded in premium functional feeds.
- September 2024: Skretting introduced Ignis, a Calanus finmarchicus-based feed for marine juveniles developed with Zooca Calanus. The product highlights ongoing innovation in early-life-stage nutrition, where higher-value formulations typically incorporate specialized attractants, antioxidants, and functional health additives.
Aquafeed Additives Market Report Scope and Research Methodology
Market Definition and Coverage
This market covers the value of commercial additives that are blended into compound aquaculture feed to support growth, health, and feed efficiency for farmed aquatic species.
Scope exclusions: We exclude home-mixed or on-farm additive use and non-feed pharmaceutical water treatments.
Segments Covered in This Report
- By Species Type
- Fish
- Salmonids
- Tilapia
- Carp
- Catfish
- Mollusks
- Crustaceans
- Others
- Fish
- By Additive Type
- Vitamins
- Minerals
- Antioxidants
- Amino Acids
- Enzymes
- Acidifiers
- Probiotics and Prebiotics
- Phytogenics and Essential Oils
- Others (Carotenoids/Astaxanthin, Pellet Binders/Bentonite, etc.)
- By Form
- Dry Extruded Pellets
- Moist Pellets
- Micro-encapsulated Powders
- By Geography
- North America
- United States
- Canada
- Mexico
- Rest of North America
- Europe
- Germany
- United Kingdom
- France
- Spain
- Russia
- Rest of Europe
- Asia-Pacific
- China
- India
- Japan
- Vietnam
- Rest of Asia-Pacific
- South America
- Brazil
- Argentina
- Rest of South America
- Middle East
- Turkey
- Saudi Arabia
- Rest of Middle East
- Africa
- South Africa
- Rest of Africa
- North America
Data Sources, Market Sizing, and Validation
Desk Research
Desk research is used to build the starting demand pool and keep basic assumptions realistic. We typically refer to public sources such as FAO FishStat for aquaculture output, national agriculture and fisheries ministries for production trends, and customs trade statistics (including HS 2309 feed preparations) to sanity-check feed ingredient flows.
To add practical context, we also review association publications such as IFFO and regional aquaculture bodies, along with peer-reviewed nutrition papers on inclusion rates and feed conversion patterns. Company filings, investor decks, and reputable press are used to confirm product positioning and route-to-market, and a paid subscription for company financials and news helps keep timelines and one-off events consistent. These examples are not exhaustive, and many other public sources were also consulted for data collection, validation, and clarification.
Primary Interviews and Surveys
Primary work is used to pressure-test the desk-built model and tighten the ranges that matter most. We spoke with feed nutritionists, additive and premix suppliers, feed mill procurement teams, and aquaculture producers across the main producing regions, and then we rechecked assumptions where responses disagreed, for example on inclusion rates and price realization.
Distribution of primary research fieldwork respondents
| Company type | Respondent position | Region |
|---|---|---|
| Top tier: 31% | CXOs: 14% | APAC: 46% |
| Mid tier: 47% | Functional/Unit leaders: 30% | EMEA: 34% |
| Smaller Players: 22% | Managers: 56% | Americas: 20% |
Market-Sizing & Forecasting
We start with a top-down demand pool that is reconstructed from aquaculture output by major species, typical feed conversion ratios, and the share of production using compound feed, which then gets translated into additive demand through practical inclusion-rate ranges. Once that backbone is built, totals are corroborated using selective bottom-up checks such as sampled supplier revenue by additive families, channel conversations with premix blenders, and simple ASP times volume math for a few high-volume additives.
Key inputs used in the model include farmed biomass trends, compound feed penetration, species mix shifts (finfish versus crustaceans), typical inclusion rates for functional and nutritional additives, and observed price movement for common additive groups like amino acids and organic acids. When a country or species has missing datapoints, we fill gaps using regional analogs, then reduce error by revalidating the proxy with interview feedback. For forecasting, ARIMA is used on the key time series and then adjusted through scenario checks around aquaculture expansion plans, regulatory pressure on medicated approaches, and likely reformulation pace in feed mills, so the final curve stays believable to industry participants.
Data Validation & Update Cycle
Validation happens in layers so we can catch errors early. We compare model outputs against independent signals like aquaculture production growth, feed output direction, and trade movement patterns, and then we run variance checks to see whether any region or additive group moves out of line with known industry behavior.
Before sign-off, the work is reviewed in multiple steps by another analyst, and follow-up calls are triggered when interview inputs conflict with desk indicators or when implied pricing moves too sharply year to year. The report is refreshed annually, and interim updates are made if a material event changes supply, regulation, or demand. Right before delivery, a final update pass is completed so clients receive the latest revised view.
Mordor Intelligence's Aquafeed Additive Market Size Compared With Other Published Estimates
Published market sizes for aquafeed additives can differ even when the topic label sounds the same, because each publisher draws the scope line in a slightly different place and then uses different pricing and timing assumptions. Differences also come from how compound feed volumes are built, how inclusion rates are chosen, and how quickly the model is refreshed when raw material prices or farming output shifts.
Some estimates appear to fold in adjacent feed ingredient value or broader aquaculture health inputs when they report the total. In Mordor Intelligence's model, only commercially manufactured additives blended into compound aquafeed are counted, and home-mixed farm use and non-feed pharmaceutical water treatments are left out so the demand pool stays tied to feed mill purchasing.
Benchmark comparison
| Source | Market Size | Gaps in Research Methodology |
|---|---|---|
| Mordor Intelligence | USD 3.03 B (2026) | |
| Global Consultancy A | USD 2.47 B (2026) | Uses a different base year build and may apply more conservative inclusion-rate and price realization assumptions across species, which can understate value in high-growth APAC feed systems. |
| Research House B | USD 2.46 B (2025) | Reports a different year and builds forward using a shorter forecast window, and the scope appears centered on ingredient-style definitions, which can exclude some functional additive use captured through premix channels. |
The spread in the table is mainly explained by year selection and what is treated as an additive purchase versus a broader aquaculture input. By keeping the demand pool anchored to species output, compound feed usage, and validated inclusion-rate ranges, the estimate stays traceable to simple variables that can be rechecked and repeated.
Key Questions Answered in the Report
What is the aquafeed additives market size in 2026?
The aquafeed additives market size stands at USD 3.03 billion in 2026 and is forecast to climb to USD 3.79 billion by 2031 on a 4.55% CAGR.
Which region leads the aquafeed additives market?
Asia-Pacific leads with 61.05% of revenue share in 2025, backed by China’s high-volume aquaculture sector and growing demand for functional feed solutions.
Why are probiotics gaining traction in aquafeed?
Regulatory restrictions on antibiotics and proven immunity benefits push probiotics to a 9.21% CAGR, the highest among additive categories to 2031.
How do fishmeal price swings affect additive demand?
Fishmeal volatility raises overall feed costs, making performance additives crucial for feed-conversion gains but sometimes delaying adoption in cost-sensitive markets.
Which species segment is growing fastest?
Crustaceans exhibit a 8.92% CAGR due to premium shrimp prices and the need for health-enhancing additives in intensive pond and RAS systems.
What technologies are reshaping the aquafeed additives industry?
AI-driven precision feeding, micro-encapsulation for bioactive protection, and microbial protein ingredients are notable innovations driving competitive advantage.