
Fire Safety Systems Market Size and Share
Market Overview
| Study Period | 2020 - 2031 |
|---|---|
| Market Size (2026) | USD 79.97 Billion |
| Market Size (2031) | USD 110.19 Billion |
| Growth Rate (2026 - 2031) | 6.61 % |
| Fastest Growing Market | Asia Pacific |
| Largest Market | North America |
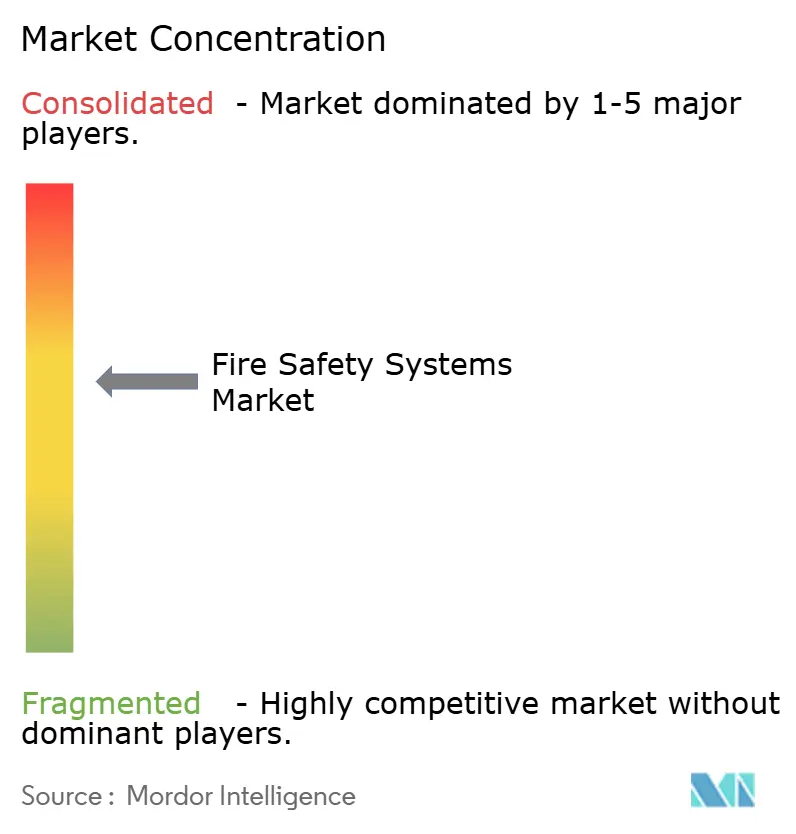
| Market Concentration | Medium |
Major Players *Disclaimer: Major Players sorted in no particular order Image © Mordor Intelligence. Reuse requires attribution under CC BY 4.0. | |
Fire Safety Systems Market Analysis by Mordor Intelligence
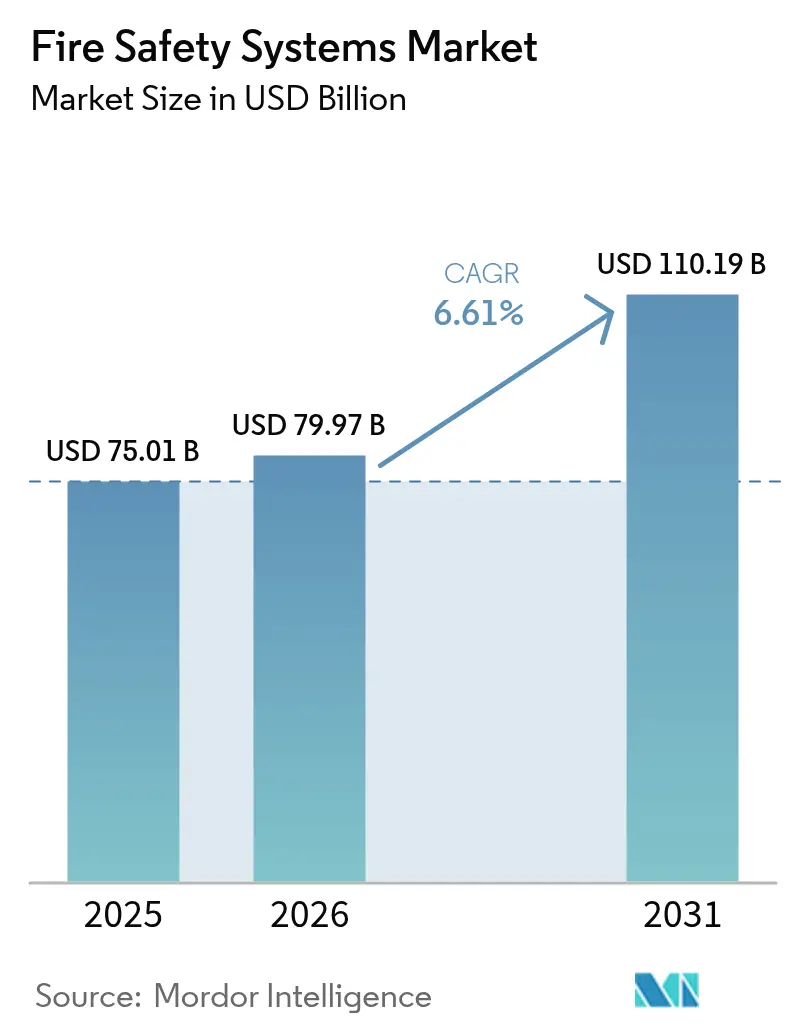
Fire Safety Systems market size in 2026 is estimated at USD 79.97 billion, growing from 2025 value of USD 75.01 billion with 2031 projections showing USD 110.19 billion, growing at 6.61% CAGR over 2026-2031. Tightening code enforcement, rapid urbanization in Asia Pacific, and the shift toward wireless IoT-enabled detection shape this expansion. Active suppression and detection platforms are displacing passive-only barriers as insurers reward monitored systems with premium discounts. Wireless architectures cut retrofit labor by up to 60%, unlocking underserved heritage and occupied-building segments. Supply shortages in microcontrollers push integrators to stockpile parts, while data-center operators accelerate gas-suppression rollouts to protect high-value racks. Competitive pressure from regional specialists remains intense, yet platform ecosystems from large incumbents deepen customer lock-in.
Key Report Takeaways
- By technology, active systems led the Fire Safety Systems market with 62.58% of the market share in 2025, and this segment is forecast to post the highest CAGR of 7.69% through 2031.
- By product, fire-detection equipment accounted for 47.78% of revenue in 2025, whereas wireless detectors are projected to grow the fastest, at an 7.97% CAGR to 2031.
- By end-user, commercial facilities held 41.35% of 2025 demand, while data centers are poised for the quickest 7.72% CAGR through 2031.
- By connectivity, wired platforms retained a 71.12% share in 2025; however, wireless configurations are expected to expand the most rapidly, advancing at a 7.31% CAGR to 2031.
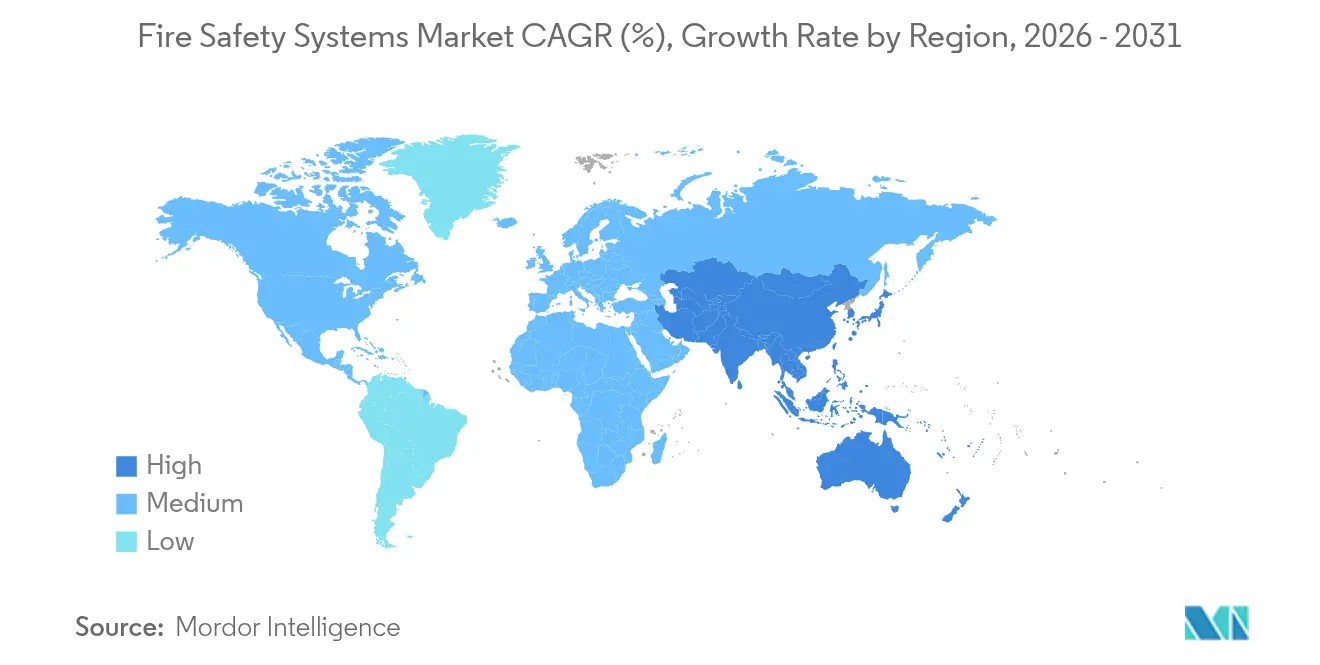
- By geography, North America commanded a 35.68% share in 2025, but the Asia Pacific is on track for the fastest 8.55% CAGR through 2031.
Note: Market size and forecast figures in this report are generated using Mordor Intelligence’s proprietary estimation framework, updated with the latest available data and insights as of 2026.
Market Trends and Insights
Drivers Impact Analysis of Fire Safety Systems Market*
| Driver | (~) % Impact on CAGR Forecast | Geographic Relevance | Impact Timeline |
|---|---|---|---|
| Stringent Government Fire-Safety Mandates | +1.8% | Global, with early enforcement in EU, North America, and China | Short term (≤2 years) |
| Rapid Urbanization and High-Rise Construction Boom | +1.5% | APAC core, spill-over to Middle East and Africa | Medium term (2-4 years) |
| Surge in Insurance Premium Discounts for Compliant Buildings | +0.8% | North America, Australia, select EU markets | Short term (≤2 years) |
| Growing Adoption of Wireless IoT-Enabled Detection Systems | +1.3% | Global, accelerated in APAC and North America | Medium term (2-4 years) |
| Expansion of Data Centers Requiring Specialized Suppression | +1.0% | North America, APAC, EU | Medium term (2-4 years) |
| Emergence of ESG-Linked Facility Management Budgets | +0.9% | Global, led by EU and North America corporates | Long term (≥4 years) |
| Source: Mordor Intelligence | |||
Stringent Government Fire-Safety Mandates
The 2025 edition of NFPA 72 mandates cloud-connected monitoring for commercial panels, prompting legacy upgrades and penalizing noncompliant owners during occupancy renewals. The 2024 International Fire Code now requires automatic suppression in assembly occupancies above 300 persons, expanding coverage to mid-sized venues previously exempt.[1]International Code Council, “2024 International Fire Code,” iccsafe.org China requires sprinklers in residential towers over 100 meters, sparking retrofit activity in tier-one cities. Japan extended inspection cycles for addressable systems from three to five years, raising demand for higher-reliability components that offset maintenance visits. The UAE adopted performance-based design, permitting CFD modeling but adding certification costs and lengthening project timelines. Publicly posted violation lists intensify reputational risk, nudging voluntary compliance beyond statutory minimums.
Rapid Urbanization and High-Rise Construction Boom
The United Nations forecasts that urban residency will rise to 68% by 2030, concentrating fire risk in taller structures. Asia Pacific represents more than half of new high-rise starts, with India and Indonesia contributing the bulk of units. Built-up area in the region’s megacities expanded 12% between 2020 and 2024, while fire-station density increased only 3%, elevating reliance on on-site suppression. Mixed-use towers in Dubai and Riyadh include zones that require distinct code compliance, complicating integration and raising system costs. OECD analysis notes that infrastructure lag in sub-Saharan Africa widens protection gaps, prompting insurers to flag fire safety in underwriting. Underground facilities such as transit stations introduce further complexity, demanding premium smoke-extraction and heat-detection arrays.
Growing Adoption of Wireless IoT-Enabled Detection Systems
Wireless detection captured 28% of 2024 installs and is projected to grow at 7.48% through 2030 as mesh protocols eliminate conduit runs and slash retrofit labor. NIST released a 2024 framework that standardizes encryption and five-year battery life, accelerating vendor consolidation. Johnson Controls’ OpenBlue platform merges fire data with HVAC and access-control feeds, reducing nuisance dispatches by 30% in pilot sites. Multi-criteria wireless detectors perform well in particulate-rich settings like commercial kitchens, trimming false alarms and maintenance costs. Heritage structures benefit most because drilling through masonry violates preservation rules. Singapore now demands wireless-capable systems in new commercial buildings over 24 meters, aligning with its Green Mark certification.
Expansion of Data Centers Requiring Specialized Suppression
Hyperscale data-center operators specify clean-agent suppression to prevent water damage that could sideline racks worth millions of USD. Gas systems cost three to four times more than sprinklers but reduce downtime risk. IEC 60079 now covers lithium-ion battery rooms adjoining data halls, adding dual-interlock requirements that extend commissioning. Carrier’s Fire and Security division reported USD 1.7 billion in Q3 2024 revenue, with a mid-teens share from data-center projects. Edge sites in tier-two cities often retrofit industrial shells, preferring modular suppression that installs within 72 hours. NFPA 2001 adoption across the Middle East and Southeast Asia harmonizes clean-agent design, enabling cross-border hardware procurement.
Restraints Impact Analysis of Fire Safety Systems Market*
| Restraint | (~) % Impact on CAGR Forecast | Geographic Relevance | Impact Timeline |
|---|---|---|---|
| High Installation and Maintenance Costs | -1.2% | Emerging markets in APAC, Africa, and South America | Medium term (2-4 years) |
| Supply-Chain Volatility in Electronic Components | -0.9% | Global, acute in North America and Europe | Short term (≤2 years) |
| Limited Skilled Workforce for System Integration | -0.7% | APAC, Middle East, Africa | Long term (≥4 years) |
| Slow Retrofit Cycles in Price-Sensitive Emerging Markets | -0.8% | South America, sub-Saharan Africa, Southeast Asia | Long term (≥4 years) |
| Source: Mordor Intelligence | |||
High Installation and Maintenance Costs
Addressable panels with network connectivity cost AUD 15,000-45,000 (USD 9,800-29,400) for mid-sized Australian buildings, stretching facility budgets.[2] Fire and Rescue NSW, “Fee Schedule 2024,” fire.nsw.gov.au Wireless detectors list at USD 180–320 each triple wired units posing adoption hurdles where insurance offsets are absent. Annual service contracts run 8-12% of installed cost because certified technicians are needed for firmware updates. Retrofitting older buildings often requires new conduit or compromise on device density, inflating capex. Enforcement gaps in lower-income regions limit compliance pressure, further slowing upgrades. Rural areas face 30–50% higher labor rates owing to scarce contractors, worsening affordability.
Supply-Chain Volatility in Electronic Components
Microcontroller lead times lengthened from 12 weeks to 26 weeks in 2024, compelling integrators to pre-buy inventory and tie up cash. Shortages in ADCs and power ICs restricted detector shipments to 60–70% of requested volumes. Passive-component prices jumped 18% year over year, squeezing margins and prompting consolidation among mid-tier players. Wireless systems bear the brunt because they share Bluetooth and Zigbee chipsets with consumer electronics. Project delays of two to four months erode buyer confidence, occasionally steering owners back to wired platforms despite higher labor inputs. Forthcoming fabs under the EU Chips Act remain years away, offering little near-term relief.
*Our forecasts treat driver/restraint impacts as directional, not additive. The impact forecasts reflect baseline growth, mix effects, and variable interactions.
Fire Safety Systems Market Segment Analysis
By Technology:
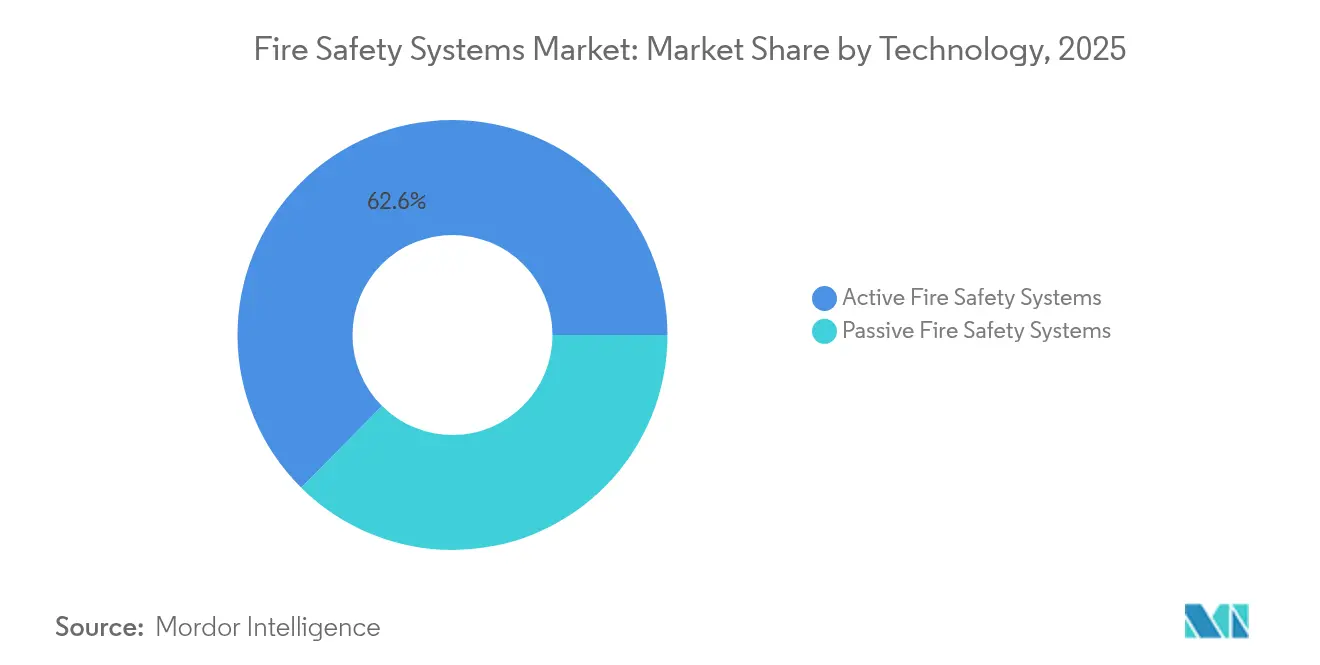
Active Platforms Gain Ground on Real-Time ProtectionActive systems captured 62.58% of 2025 revenue and are set to expand at 7.69% through 2031, reflecting owners’ preference for automatic mitigation that curbs loss events by up to 80%. Passive measures remain essential for compartmentation but surrender share as insurers insist on monitored suppression for premium relief. Integrated installations in high-rise residences pair fire-rated shafts with pressurization fans, exemplifying the combined approach. Hybrid deployments preserve barrier integrity by using wireless detectors that avoid drilling through rated walls, boosting retrofit rates in older stock. The International Building Code now obliges suppression in atriums taller than three stories, broadening the Fire Safety Systems market.
Active platforms increasingly embed analytics that predict hazard escalation, differentiating vendors on software prowess. Battery-powered sprays for lithium-ion battery rooms illustrate specialized niches within the Fire Safety Systems market. Passive providers respond with smarter materials, such as intumescent coatings that signal end-of-life status through color change. Yet funding gravitates toward active portfolios because service contracts yield recurring cash flows, an attraction for integrators pursuing annuity revenue. The migration from passive-only designs elevates the Fire Safety Systems market size tied to active solutions throughout the forecast.



By Product:
Detection Leads, Wireless Sensors AccelerateFire detection remained the chief revenue driver at 47.78% in 2025, anchored by addressable panels that pinpoint alarm origin and speed first-responder action. Wireless detectors, posting an 7.97% CAGR, outpace the broader Fire Safety Systems market as mesh networks trim installation labor in occupied spaces. Gas suppression dominates sensitive environments like museums and data halls where water presents unacceptable damage risk. Foam systems retain leadership in petrochemical sites yet grapple with fluorine-free transitions demanded by environmental rules.
The convergence of detection and suppression data within unified dashboards fosters predictive maintenance, a feature that cuts nuisance alarms by 30% in pilot offices. Voice-evacuation alarms, now demanded in properties exceeding 75,000 square feet, improve occupant guidance during incidents. Detectors integrating smoke, heat, and CO inputs reduce false positives in high-particulate plants, enhancing management confidence. These advances enlarge the Fire Safety Systems market size attached to premium detection gear and reinforce vendor differentiation on software sophistication.
By End-User:
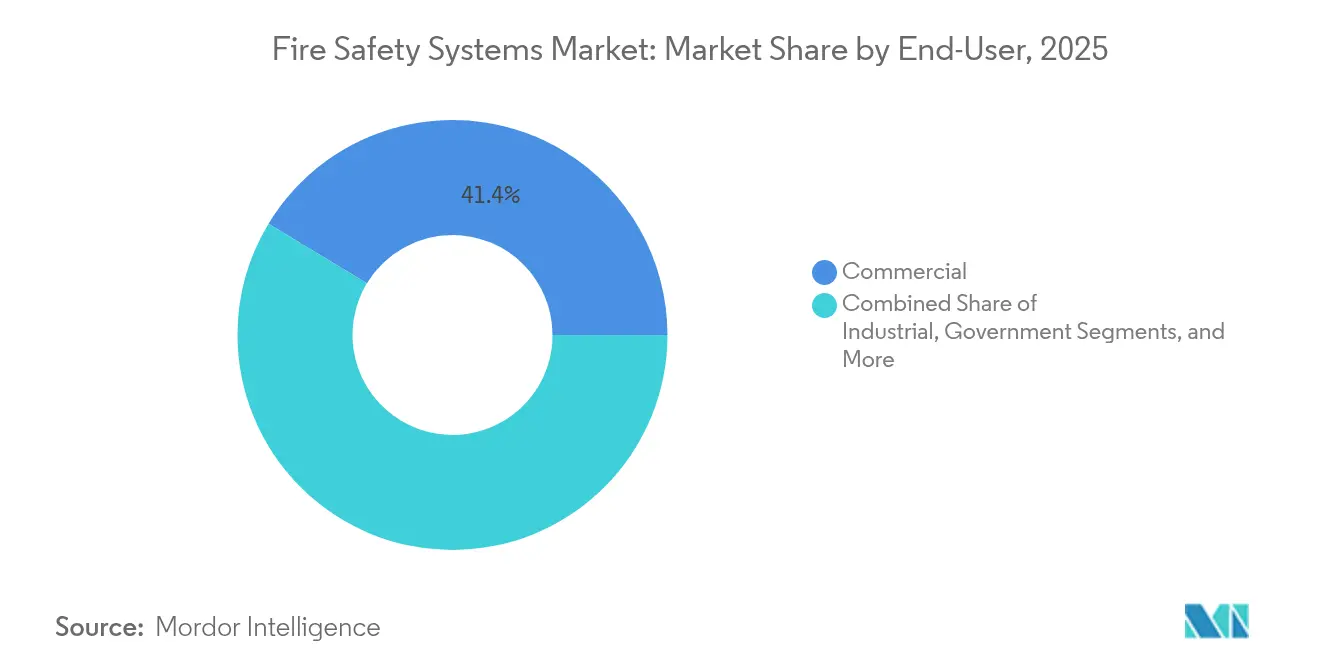
Commercial Dominates, Data Centers Scale FastCommercial buildings generated 41.35% of 2025 demand through offices, malls, and hotels that require broad occupant protection. Data centers, though smaller, advance at 7.72% CAGR as hyperscale firms standardize clean-agent suppression to safeguard multi-million-USD racks. Industrial plants prioritize early warning to minimize downtime, sometimes adding thermal cameras that detect hot spots before ignition and cut insurance costs.
Government facilities, including transit hubs and defense sites, often exceed code minimums, specifying redundant zones and 72-hour backup power. Residential high-rises incorporate multilingual voice-evacuation to serve diverse occupants. Edge data centers in secondary cities present white-space potential for modular systems that install within three days, widening the Fire Safety Systems market across geographies. The requirement for pre-action sprinklers in data halls, codified by NFPA 75:2024, cements clean-agent purchases and lifts the Fire Safety Systems market share of specialized suppression offerings.
By Connectivity:
Wired Remains Predominant while Wireless Rises on RetrofitsWired platforms held 71.12% share in 2025 thanks to decades of embedded cable runs. Wireless systems, advancing at 7.31% CAGR, win retrofits where conduit costs exceed USD 50 per linear foot. Reliability fears have eased as mesh networks reach 99.9% uptime and batteries last five years. Mission-critical sites, such as nuclear plants, still favor shielded cable for EMI resistance, keeping wired solutions dominant in high-risk zones.
Hybrid architectures blend wired backbones with wireless endpoints, marrying reliability with flexibility on campus estates. Preservation codes in heritage districts further spur battery-powered devices, since drilling masonry is barred. Singapore’s 24-meter trigger for wireless readiness exemplifies regulatory nudges that enlarge the Fire Safety Systems market. Component shortages mildly hamper wireless growth but are offset by labor savings and faster commissioning.
Geography Analysis
North America Fire Safety Systems Market
North America accounted for 35.68% of 2025 revenue, reflecting the impact of rigorous NFPA updates and insurance incentives that reduced premiums by up to 20% for monitored suppression. High-rise construction along U.S. coasts, and wildfire retrofits in California, sustain orders. Canada’s performance-based building code accelerates the adoption of water-mist systems in dense residential towers. Nearshoring in Mexico fuels demand for addressable panels in new industrial hubs.
APAC Fire Safety Systems Market
Asia Pacific is set for the fastest 8.55% CAGR through 2031 on urbanization and high-rise proliferation. Chinese codes require sprinklers in towers above 100 meters, igniting retrofit cycles in Beijing and Shanghai. India mandates addressable detection in residential blocks over 15 meters, although enforcement varies. Japan rewards reliable components with extended inspection intervals, lifting upfront system spend. Australia’s 2025 code demands interlinked smoke alarms, stimulating wireless detector uptake. South Korea enforces sprinklers in apartments taller than 11 stories, compelling wet-pipe adoption despite freeze-protection costs.
EMEA Fire Safety Systems Market
Europe shows fragmented standards that benefit local integrators. Germany’s DGNB certification awards credits for advanced protection, nudging voluntary upgrades. The Middle East experiences brisk demand from mega-projects that embed performance-based design in master plans, with UAE regulations endorsing CFD modeling. Africa’s adoption remains uneven, with South Africa and Kenya leading but limited penetration elsewhere due to contractor shortages.

Regulatory Landscape
Fire safety compliance is anchored to building and fire codes that are regularly updated and enforced locally by authorities having jurisdiction (AHJs). The 2024 International Fire Code (International Code Council) expanded requirements such as carbon monoxide detection across occupancy types, while NFPA 72 (2025 edition) was approved as an American National Standard on September 18, 2024, supporting modernization of alarm, signaling, and monitoring in commercial installations.
Jurisdiction-specific updates continue to drive retrofit and documentation demand. The Fire Code of New York State (2025) governs requirements for new and existing buildings through referenced standards, and Connecticut moved to adopt the 2024 International Fire Code within the 2026 Connecticut State Fire Safety Code with the State Fire Marshal as the primary AHJ. In the UK, Approved Document B amendments published in September 2024 took effect March 2, 2025, with a further update cycle scheduled to take effect September 30, 2026, creating another compliance waypoint for designers, installers, and building owners.
Value Chain Analysis
The value chain starts with component and materials suppliers (sensors, microcontrollers, power ICs, batteries, valves, nozzles, and piping), then moves to OEMs that design and manufacture detection devices, addressable panels, notification appliances, and suppression hardware. System integrators and contractors sit at the center of delivery, handling design-to-code, permitting with AHJs, installation, commissioning, and ongoing inspection and maintenance, increasingly supported by cloud platforms that unify fire data with building management systems (BMS), HVAC, and access control for automated response workflows.
Downstream, distributors and service networks support spares, periodic testing, and compliance documentation, while software layers (remote diagnostics, event logging, and cybersecurity controls) capture a larger share of lifecycle value. Supply-chain volatility in electronics remains a practical constraint for delivery schedules, particularly for wireless endpoints that rely on chipsets used across broader IoT markets. Standards and conformity assessment also influence product flow in Europe, where EU Delegated Regulations 2026/331 and 2026/557 define performance classes for construction products related to reaction and resistance to fire, and where updates such as EU Implementing Regulation 2025/625 affect certification requirements tied to stationary fire protection equipment and newer agents.
Competitive Landscape
The top five suppliers, Johnson Controls, Honeywell, Siemens, Carrier, and Bosch, control roughly 40–45% of revenue, indicating moderate concentration. Platform ecosystems such as OpenBlue integrate fire data with HVAC and access control, raising customer switching costs and differentiating incumbents. Honeywell mirrors this bundling, offering unified dashboards that cut facility labor by up to 30%. Wireless detection attracts agile entrants leveraging Bluetooth and Zigbee to price hardware 30–40% lower, though they lack deep service networks.
Service revenue now drives strategic positioning. Remote diagnostics and over-the-air firmware updates slash truck rolls by up to 50%, protecting margins. Suppliers invest in AI models that predict flashover, guided by a 2024 NIST framework. Patent filings for printable sensors hint at future disruption but remain several years from commercialization. Consolidation continues: Halma acquired two European detector firms in 2024, broadening its mid-tier portfolio.
Fire Safety Systems Industry Leaders
Johnson Controls International PLC
Honeywell International Inc.
Siemens AG
Bosch Sicherheitssysteme GmbH
Gentex Corporation
- *Disclaimer: Major Players sorted in no particular order
Fire Safety Systems Market Companies Covered in this Report
- Johnson Controls International PLC
- Honeywell International Inc.
- Siemens AG
- Bosch Sicherheitssysteme GmbH
- Gentex Corporation
- Halma PLC
- Hochiki America Corporation
- Viking Group Inc.
- Victaulic Company
- Fike Corporation
- Securiton AG
- Carrier Global Corporation
- Nittan Company Limited
- Apollo Fire Detectors Limited
- Advanced Electronics Limited
- Minimax GmbH
- Robertshaw Controls Company
- Ravel Electronics Private Limited
- Panasonic Corporation
- Edwards Fire Safety (Carrier)
- Tyco Fire Protection Products

Market Opportunities and Future Outlook
Wireless and cloud-connected upgrades create whitespace in retrofit-heavy building stock where labor and disruption remain key barriers, especially for occupied commercial sites and heritage properties. Product roadmaps from major incumbents are converging on remote diagnostics, event intelligence, and tighter integration with smart-building stacks, as reflected by Siemens Smart Infrastructure launching cloud-connected Sinteso Nova and Cerberus Nova detectors integrated with Building X Fire Apps in March 2026. That has reinforced demand for interoperable architectures, including BACnet gateway-based integration between fire alarm systems and building management systems, along with service models that reduce onsite visits through centralized monitoring and software-assisted maintenance.
Special-hazard and critical-infrastructure protection is also an active opportunity, with lithium-ion battery risks driving new use cases across residential, commercial, and industrial settings. In June 2026, Samsung C&T formed a dedicated Fire Safety Technology Group and highlighted solutions such as a smart charging cabinet for lithium-ion batteries in residential complexes, pointing to demand for specialized detection and suppression around battery rooms and charging areas. Buyers are also building capability through acquisitions, including MSA Safety completing its acquisition of Autronica Fire and Security in July 2026 to expand fire and gas detection and alarm systems, and APi Group completing the acquisition of WTech Fire Group in July 2026 to broaden European sprinkler, suppression, and detection services, reinforcing the role of large service platforms in multi-site compliance and lifecycle support.
Recent Industry Developments in Fire Safety Systems Market
- June 2026: Honeywell introduced next-generation smoke control and carbon monoxide purge capabilities within its NOTIFIER INSPIRE platform and added cloud-connected tools including Zone Sync and CLSS Rescue Assist. The release strengthens Honeywell’s push toward connected life-safety workflows that tie devices, annunciation, and operational response into a single digital layer.
- March 2026: Siemens Smart Infrastructure launched the Sinteso Nova and Cerberus Nova fire detector portfolio, positioning cloud connectivity and the ASAplus multi-criteria approach as core design elements. The move raises the competitive bar for false-alarm reduction and remote maintenance, and it reinforces the broader market shift toward software-supported detection ecosystems.
- January 2025: Halma completed the acquisition of Zettler Group, expanding its European fire detection lineup. The deal adds product depth and strengthens channel reach in a region where local compliance practices and installer relationships influence vendor selection.


Fire Safety Systems Market Report Scope and Research Methodology
Market Definition and Coverage
For this study, the fire safety systems market includes hardware and system-level solutions that detect a fire event, alert occupants, and suppress or control fire. This covers passive and active protection installed in buildings and facilities.
Scope exclusions: We exclude routine building maintenance work that is not tied to fire safety systems installation, upgrades, monitoring, or replacement.
Segments Covered in This Report
- By Technology
- Passive Fire Safety Systems
- Active Fire Safety Systems
- By Product
- Fire Detector
- Detectors
- Alarms
- Fire Suppression
- Gas
- Foam
- Other Fire Suppression Products
- Fire Detector
- By End-User
- Commercial
- Industrial
- Government
- Other End-Users
- By Connectivity
- Wired Systems
- Wireless Systems
- By Geography
- North America
- United States
- Canada
- Mexico
- South America
- Brazil
- Argentina
- Rest of South America
- Europe
- United Kingdom
- Germany
- France
- Spain
- Italy
- Rest of Europe
- Asia Pacific
- China
- India
- Japan
- Australia
- South Korea
- Rest of Asia Pacific
- Middle East and Africa
- Middle East
- Saudi Arabia
- United Arab Emirates
- Turkey
- Rest of Middle East
- Africa
- South Africa
- Kenya
- Rest of Africa
- Middle East
- North America
Data Sources, Market Sizing, and Validation
Desk Research
Desk research was used to set the market frame and to anchor the model to measurable signals, before any assumptions were applied. We mainly relied on public safety codes and fire incident statistics to understand adoption drivers, and we used construction and industrial activity series to understand where systems are being deployed.
Typical inputs included public sources such as the National Fire Protection Association (NFPA) for standards and incident context, the US Fire Administration and the National Institute of Standards and Technology (NIST) for safety research, the International Code Council (ICC) and similar code bodies for regulatory direction, and broad construction and manufacturing indicators from agencies such as the US Census Bureau and the World Bank. We also reviewed annual reports, investor presentations, and reputable trade association publications, and we selectively used paid subscriptions for company financials, patent lookups, and shipment-level trade checks where they helped validate volumes and pricing. These examples are not exhaustive, and many other public and paid sources were consulted to collect, cross-check, and clarify data points.
Primary Interviews and Surveys
Primary work focused on confirming what gets counted as a fire safety system sale, and on validating pricing, replacement cycles, and the split between new installs and retrofit demand. We spoke with a mix of manufacturers, distributors, installers, and facility-side buyers across major regions so secondary indicators could be corrected for local code enforcement, procurement timing, and product-mix shifts.
Distribution of primary research fieldwork respondents
| Company type | Respondent position | Region |
|---|---|---|
| Top tier: 34% | CXOs: 14% | APAC: 49% |
| Mid tier: 52% | Functional/Unit leaders: 27% | EMEA: 33% |
| Smaller Players: 14% | Managers: 59% | Americas: 18% |
Market-Sizing & Forecasting
Sizing starts with a top-down demand reconstruction that ties fire safety system spending to the active building and facility base, and then applies adoption and upgrade rates that reflect code requirements and risk profiles. Once that structure was set, results were corroborated using selective bottom-up approximations, such as sampled average selling prices times shipment volumes for key device groups, and channel checks on installer throughput in high-activity markets.
Inputs that shaped the model included new commercial floor space additions, industrial capex cycles, retrofit intensity in older buildings, the share of sites requiring monitored alarms, and the mix shift between wired and wireless deployments. Pricing was treated carefully because suppression and detection products behave differently, and currency timing was standardized before regional rollups were finalized.
For forecasting, scenario analysis was used so growth could be flexed based on construction cycles, enforcement strength, and replacement demand timing. The scenario weights were adjusted using expert consensus from primary discussions. Where bottom-up evidence was thin for smaller countries, proxy indicators, such as construction starts, import signals, and installed base scaling, were used first and then normalized during regional reviews.
Data Validation & Update Cycle
We cross-checked model outputs against independent signals such as building activity, fire incident trends, and trade flow direction, and then outliers were investigated before totals were finalized. When a region showed an unusual jump, assumptions were revisited and primary respondents were re-contacted to confirm whether it was driven by pricing, one-time projects, or a real adoption change.
Each report goes through multi-step analyst review, followed by a final consistency check across regions and product groupings. The study is refreshed annually, and interim updates are made when major regulations, large-scale construction slowdowns, or sharp pricing shifts materially change the outlook. Before delivery, a fresh pass is completed so clients receive the most up-to-date view.
Mordor Intelligence's Fire Safety Systems Market Market Size Compared Against Other Published Estimates
Published market sizes for fire safety systems often differ, even when the topic name looks the same, because each publisher makes different choices on what to include, which year to anchor, and how pricing and currency are treated. Differences also come from whether the model follows installed base demand signals or leans more on high-level revenue totals.
Some external estimates expand the scope to include broader fire protection categories such as analysis and response layers, and they may also blend services more heavily into the headline value. In Mordor Intelligence, the count is limited to passive and active fire safety systems tied to detectors and alarms plus suppression products, and the 2026 value is anchored to a consistent forecast window and product-mix pricing checks.
Benchmark comparison
| Source | Market Size | Gaps in Research Methodology |
|---|---|---|
| Mordor Intelligence | USD 79.97 B (2026) | |
| Trade Journal A | USD 68.20 B (2024) | Uses an earlier base year and a different refresh timing, and the market may be shaped more by packaged segment totals rather than a building-base demand build with wired versus wireless mix and replacement cycles. |
| Industry Profile B | USD 81.90 B (2024) | Covers a broader fire protection system framing (including analysis and response elements) and reports a revenue figure for 2024, which can shift totals depending on how integrated solutions and service-heavy contracts are treated. |
Overall, the spread across the three figures is mainly explained by scope boundaries, the base year chosen, and how pricing and solution bundles are handled. By keeping the definition tied to detectors and alarms plus suppression hardware and system deployments, and then validating adoption and pricing with real-world buying and installation signals, the estimate stays transparent and repeatable for planning.


Key Questions Answered in the Report
What is the projected value of the Fire Safety Systems market in 2031?
The market is forecast to reach USD 110.19 billion by 2031 at a 6.61% CAGR.
Which technology segment is expanding the fastest?
Active systems will grow at 7.69% CAGR, driven by real-time suppression mandates.
Why are wireless detectors gaining traction?
They cut retrofit labor up to 60% and meet new code requirements for cloud connectivity.
Which end-user sub-segment shows the highest growth potential?
Data centers, with a 7.72% CAGR, require clean-agent suppression to protect high-value equipment.
Which region offers the most robust growth outlook?
Asia Pacific is forecast to expand at 8.55% CAGR due to rapid urbanization and stricter codes.
How does supply-chain volatility affect project timelines?
Component shortages can delay installations by two to four months, prompting inventory pre-purchases.
Page last updated on:




