Dairy Free Ice Cream Market Size and Share
Market Overview
| Study Period | 2021 - 2031 |
|---|---|
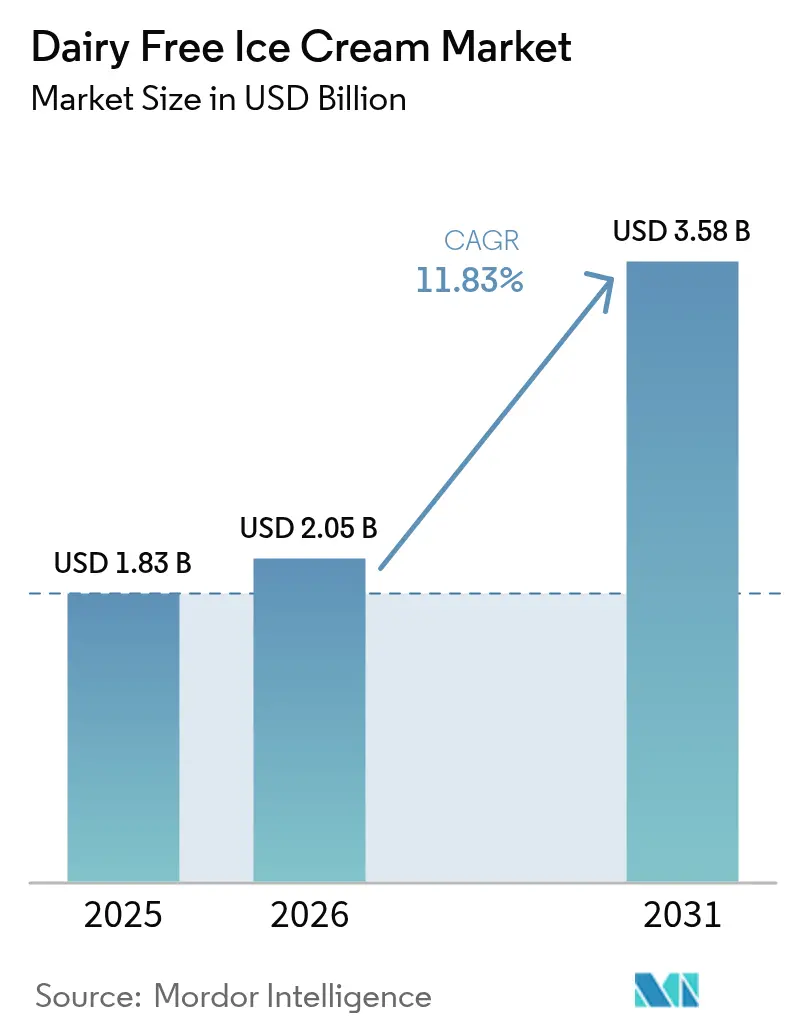
| Market Size (2026) | USD 2.05 Billion |
| Market Size (2031) | USD 3.58 Billion |
| Growth Rate (2026 - 2031) | 11.83% CAGR |
| Fastest Growing Market | Asia Pacific |
| Largest Market | North America |
| Market Concentration | Low |
Major Players *Disclaimer: Major Players sorted in no particular order Image © Mordor Intelligence. Reuse requires attribution under CC BY 4.0. | |
Dairy Free Ice Cream Market Analysis by Mordor Intelligence
The dairy-free ice cream market size was valued at USD 1.83 billion in 2025 and estimated to grow from USD 2.05 billion in 2026 to reach USD 3.58 billion by 2031, at a CAGR of 11.83% during the forecast period (2026-2031). Demand growth reflects rising lactose intolerance diagnoses, vegan lifestyle adoption, and clean-label preferences that position plant-based desserts as both indulgent and functional. The U.S. Food and Drug Administration’s January 2025 draft guidance removed labeling uncertainty, letting producers state plant-based attributes next to conventional ice cream descriptors without regulatory risks. Premium pricing holds as brands pair allergen-free credentials with novel flavors, while precision-fermentation partnerships squeeze conventional cost barriers. Geographic divergence is clear: North America leads retail penetration, but Asia Pacific records the fastest adoption surge on the back of expanding alternative-protein infrastructure.
Key Report Takeaways
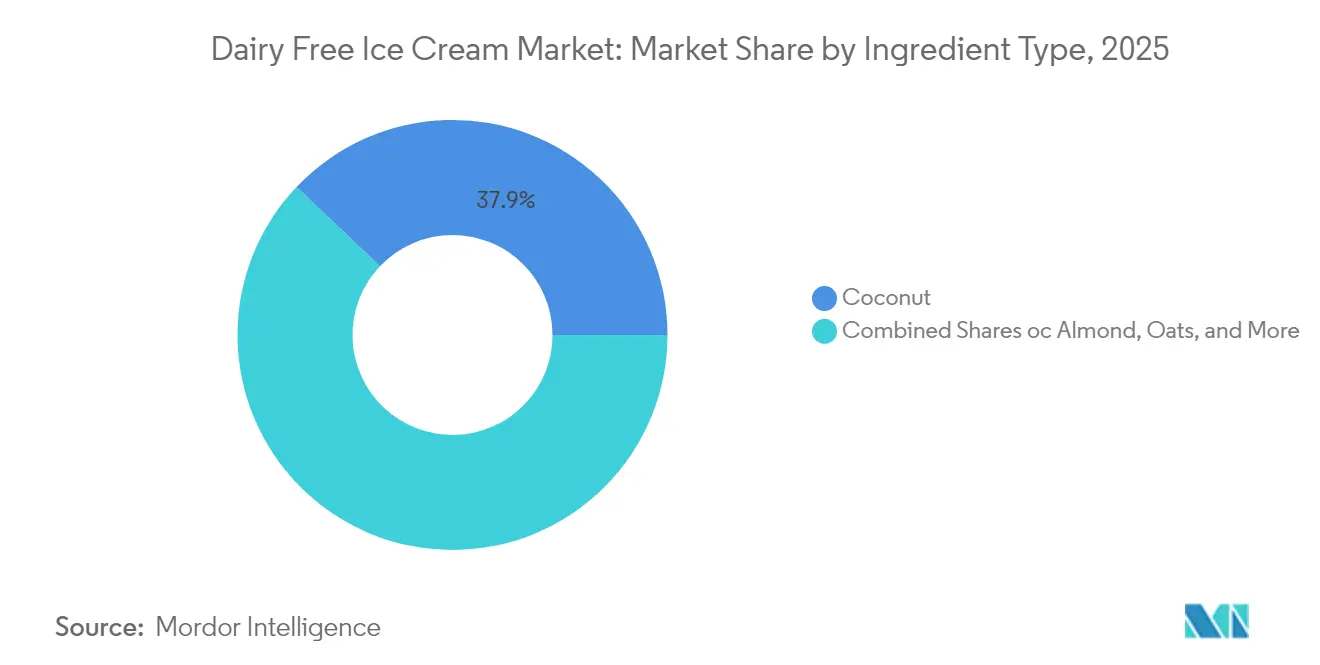
- By ingredient type, coconut formulations held 37.92% of the dairy-free ice cream market share in 2025, while oat variants are projected to advance at a 16.58% CAGR through 2031.
- By flavor type, vanilla led with 34.25% revenue share in 2025; chocolate is set to grow at a 14.73% CAGR to 2031.
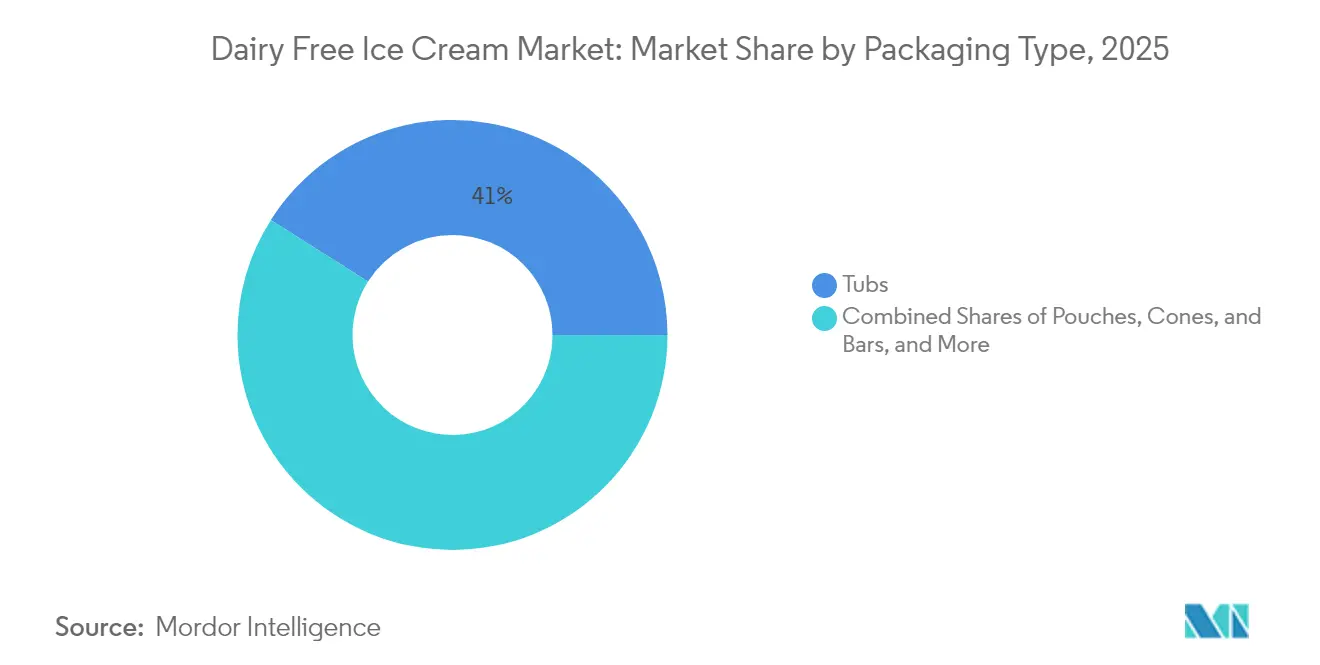
- By packaging type, tubs accounted for 41.02% share of the dairy-free ice cream market size in 2025, and cones & bars will expand at a 14.09% CAGR to 2031.
- By distribution channel, off-trade outlets commanded a 64.55% share in 2025, and the same channel shows the highest projected CAGR at 17.52% through 2031.
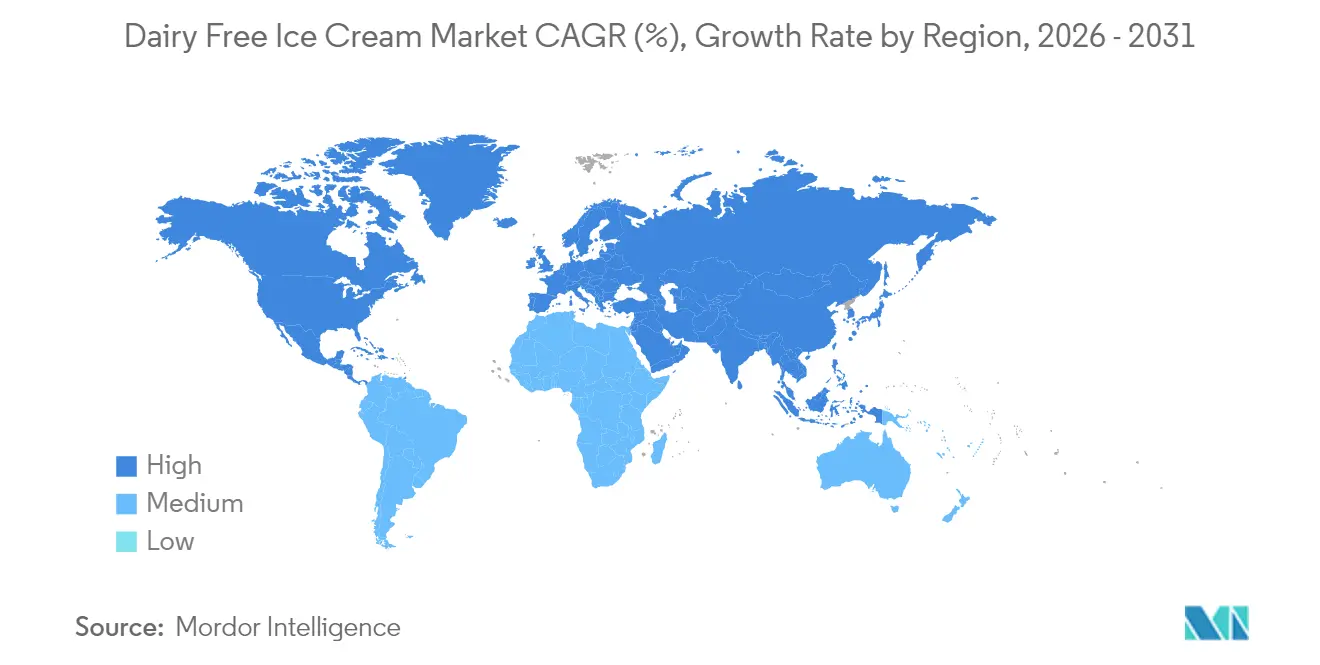
- By geography, North America captured 46.72% market share in 2025, whereas the Asia Pacific is forecast to register a 14.62% CAGR over 2026-2031.
Note: Market size and forecast figures in this report are generated using Mordor Intelligence’s proprietary estimation framework, updated with the latest available data and insights as of 2026.
Global Dairy Free Ice Cream Market Trends and Insights
Drivers Impact Analysis*
| Drivers | (~)% Impact on CAGR Forecasts | Geographic Relevance | Impact Timeline |
|---|---|---|---|
| Rising vegan and lactose-intolerant populations | +2.1% | Global, with concentration in North America & Europe | Medium term (2-4 years) |
| Increasing health consciousness and desire for clean-label, allergen-friendly ice cream options. | +2.8% | Global, strongest in developed markets | Long term (≥ 4 years) |
| Innovations in plant-based ingredients improving taste, texture, and nutritional profiles. | +2.3% | Global, led by North America & Europe R&D centers | Short term (≤ 2 years) |
| Growing consumer preference for lower cholesterol, reduced saturated fat, and allergen-free indulgence | +1.9% | North America & Europe primarily, expanding to APAC | Medium term (2-4 years) |
| Expansion of premium, artisanal, and craft dairy-free ice creams | +1.7% | North America & Europe, emerging in urban APAC | Medium term (2-4 years) |
| Social media-driven awareness and endorsements bolster consumer interest | +1.4% | Global, strongest impact in APAC & younger demographics | Short term (≤ 2 years) |
| Source: Mordor Intelligence | |||


Rising Vegan and Lactose-Intolerant Populations Drive Market Expansion
Population demographics reveal structural demand drivers that extend beyond lifestyle choices into medical necessity. The USDA's[1]USDA, “Dietary Guidelines for Americans,” U.S. Department of Agriculture, usda.gov 2024 dietary guidelines acknowledge that approximately 65% of adults worldwide experience some degree of lactose malabsorption, creating an addressable market that transcends voluntary dietary preferences. Vegan population growth, particularly concentrated in urban centers across developed markets, has accelerated from 1% to 6% of total population in key metropolitan areas between 2020-2024. This demographic shift correlates with higher disposable income and willingness to pay premium prices for specialized food products. The intersection of medical necessity and lifestyle choice creates dual purchase motivations that traditional dairy alternatives cannot address. Regulatory frameworks increasingly recognize lactose intolerance as a legitimate health concern, with FDA guidance supporting clear allergen labeling that facilitates product discovery for affected consumers.
Increasing health consciousness and desire for clean-label, allergen-friendly ice cream options.
Consumer behavior trends highlight a significant shift as indulgent products increasingly adopt health-focused positioning without compromising taste. The CDC's[2]CDC, “Nutrition Data and Statistics,” Centers for Disease Control and Prevention, cdc.gov 2024 nutrition surveillance data reveals that 73% of consumers actively seek products with lower saturated fat content, even in traditionally indulgent categories. The 'clean-label' concept has grown beyond ingredient transparency to include production methods, sourcing ethics, and environmental impact. Dairy-free products naturally align with clean-label standards by avoiding artificial hormones, antibiotics, and other dairy-specific additives that concern health-conscious consumers. This fusion of indulgence and wellness has created opportunities for premium pricing, with consumers willing to pay 20-30% more for products that combine sensory satisfaction with health benefits. Additionally, the inclusion of plant-based proteins, probiotics, and functional ingredients is transforming ice cream from a source of empty calories into a product with purposeful nutrition.
Innovations in plant-based ingredients improving taste, texture, and nutritional profiles.
Advancements in manufacturing technology have effectively addressed the longstanding texture and mouthfeel challenges that previously limited the adoption of dairy-free products. Research published in the Journal of Food Engineering reveals that combining high-pressure processing with enzyme modification can replicate dairy-like texture profiles in plant-based formulations. Precision fermentation facilitates the production of dairy-identical proteins without involving animals, eliminating the reliance on complex stabilizer systems that once caused artificial mouthfeel. Oat-based formulations utilize their natural beta-glucan content to deliver a creamy texture without requiring added gums or emulsifiers. Additionally, the development of plant-based fat systems that crystallize similarly to dairy fat has resolved the melting characteristics that previously differentiated dairy-free products. Advanced homogenization techniques now prevent ice crystal formation, which historically led to grainy textures in plant-based frozen desserts.
Expansion of premium, artisanal, and craft dairy-free ice creams
Artisanal and craft positioning strategies have successfully repositioned dairy-free ice cream from dietary restriction products to premium indulgence options. Market analysis reveals that premium-positioned dairy-free brands achieve 40-50% higher per-unit pricing than mass-market equivalents, indicating successful value proposition communication. Small-batch production methods, exotic ingredient sourcing, and limited-edition flavors create scarcity-driven demand that supports premium pricing structures. The craft positioning enables direct-to-consumer sales channels that capture higher margins while building brand loyalty through personalized customer experiences. Sustainability messaging integrated with premium positioning appeals to environmentally conscious consumers willing to pay premiums for products aligned with their values. Geographic expansion of premium brands from coastal urban markets to secondary cities demonstrates mainstream acceptance of dairy-free products as legitimate indulgence options.
Restraints Impact Analysis*
| Restraints | (~)% Impact on CAGR Forecasts | Geographic Relevance | Impact Timeline |
|---|---|---|---|
| High production costs due to specialized processing technologies | -1.8% | Global, most acute in emerging markets | Medium term (2-4 years) |
| Regulatory hurdles related to allergen declarations, vegan certifications, and clean-label compliance. | -1.2% | Europe & North America primarily, expanding globally | Short term (≤ 2 years) |
| Taste and texture challenges | -1.5% | Global, particularly in price-sensitive segments | Medium term (2-4 years) |
| Supply chain constraints for specialty plant-based ingredients | -0.9% | Global, acute in regions with limited agricultural diversity | Long term (≥ 4 years) |
| Source: Mordor Intelligence | |||
High production costs due to specialized processing technologies
Manufacturing economics reveal structural cost disadvantages that limit market penetration beyond premium segments. Specialized processing equipment for plant-based formulations requires capital investments 30-40% higher than conventional dairy processing lines, creating barriers for smaller manufacturers seeking market entry. Energy-intensive freezing processes combined with shorter shelf-life requirements increase operational costs compared to dairy alternatives that benefit from established cold-chain infrastructure. Ingredient costs for specialty plant proteins, natural stabilizers, and organic certifications add 15-25% to raw material expenses versus conventional formulations. The absence of economies of scale in plant-based ingredient supply chains perpetuates cost disadvantages that prevent price parity with dairy alternatives. Manufacturing complexity increases quality control requirements, with batch-to-batch consistency challenges that necessitate additional testing and potential waste.
Regulatory hurdles related to allergen declarations, vegan certifications, and clean-label compliance.
Compliance requirements across various jurisdictions lead to development delays, postponing product launches, and increasing regulatory expenses. The FDA's[3]FDA, “Food Labeling Guide: Guidance for Industry,” U.S. Food and Drug Administration, fda.gov changing guidelines on plant-based product labeling demand ongoing legal evaluations and, at times, reformulation to ensure compliance. Vegan certification processes require third-party audits of entire supply chains, creating reliance on supplier compliance that can disrupt production schedules. Clean-label standards, which exclude traditional stabilizers and preservatives, necessitate reformulations that may affect shelf-life or texture. International expansion involves navigating diverse regulatory frameworks, with some markets restricting the use of dairy-related terms for plant-based products. Additionally, regulatory uncertainty around novel ingredients, such as precision fermentation proteins, causes manufacturers to hesitate in adopting advanced formulation technologies.
*Our forecasts treat driver/restraint impacts as directional, not additive. The impact forecasts reflect baseline growth, mix effects, and variable interactions.
Segment Analysis
By Ingredient Type: Oat Innovation Challenges Coconut Dominance
In 2025, coconut-based formulations accounted for a 37.92% market share, benefiting from their natural fat content that closely replicates dairy mouthfeel. On the other hand, oat-based alternatives are experiencing rapid growth, with a 16.58% CAGR projected through 2031, driven by their enhanced nutritional profiles and scalable production processes. The beta-glucan content in oats provides natural creaminess, reducing the reliance on extensive stabilizers, which lowers ingredient costs and supports clean-label positioning. Almond-based products are impacted by supply chain challenges stemming from California's drought, while soy alternatives face concerns over GMOs in key markets.
Advancements in oat protein isolation have enabled manufacturers to replicate dairy-like textures while maintaining cost competitiveness with traditional coconut-based formulations. The FDA's approval of oat beta-glucan for its cholesterol-lowering properties creates opportunities for health claims that coconut-based products cannot leverage. Additionally, precision fermentation is beginning to complement traditional plant-based ingredients. Companies like Perfect Day are demonstrating the commercial feasibility of lab-produced dairy proteins, which entirely bypass agricultural constraints.


By Flavor Type: Chocolate Innovation Drives Premium Growth
Vanilla flavors commanded 34.25% market share in 2025, benefiting from universal appeal and formulation simplicity across diverse plant-based ingredients. Chocolate variants achieve the fastest growth at 14.73% CAGR, supported by cocoa's natural compatibility with plant-based fats and consumer willingness to pay premiums for indulgent chocolate experiences. Fruit-based flavors capitalize on clean-label trends by incorporating whole fruit pieces and natural flavor systems. Caramel formulations present technical challenges in dairy-free applications, requiring specialized browning techniques that avoid dairy-derived ingredients.
The chocolate segment benefits from premium positioning opportunities, with artisanal brands achieving 40-50% higher per-unit pricing through exotic cocoa sourcing and limited-edition releases. Ben & Jerry's 2024 launch of oat-based chocolate flavors demonstrated mainstream acceptance of plant-based chocolate formulations. Flavor innovation increasingly focuses on functional ingredients, with adaptogenic herbs and superfoods creating differentiation beyond traditional taste profiles. The regulatory landscape supports natural flavor systems over artificial alternatives, aligning with consumer preferences for recognizable ingredients.
By Packaging Type: Portable Formats Capture Premium Pricing
Traditional tub packaging maintained 41.02% market share in 2025, serving household consumption patterns and bulk purchasing preferences. Cones and bars demonstrate the fastest growth at 14.09% CAGR, capitalizing on premium pricing opportunities and impulse purchase behaviors. Pouch packaging appeals to sustainability-conscious consumers while reducing material costs compared to rigid containers. Single-serve formats enable portion control messaging that aligns with health-conscious positioning.
The shift toward portable formats reflects changing consumption occasions, with on-the-go snacking replacing traditional family dessert moments. Manufacturing complexity increases with individual packaging requirements, but premium pricing more than compensates for additional production costs. Sustainability considerations favor packaging innovations that reduce plastic content while maintaining product integrity throughout cold-chain distribution. The convenience store channel expansion drives demand for grab-and-go formats that compete directly with conventional ice cream novelties.
By Distribution Channels: Off-Trade Dominance Accelerates Through Specialization
In 2025, off-trade channels accounted for 64.55% of the market share while also achieving the highest growth rate, with an 17.52% CAGR projected through 2031. This apparent contradiction highlights internal fragmentation within the channel, as specialty retailers and online platforms increasingly capture market share from traditional supermarkets. Supermarkets and hypermarkets ensure mass-market accessibility but face margin challenges due to competition from private labels. Convenience stores cater to impulse purchases, often accommodating premium pricing. Online retail facilitates direct-to-consumer engagement and employs subscription models to enhance customer loyalty.
Conversely, the on-trade segment leverages experiential marketing, with restaurants and cafes serving as venues for product trials before retail adoption. Collaborations with ghost kitchens enable brands to test new flavors in controlled environments while generating revenue through foodservice channels. The integration of retail and foodservice via hybrid models creates innovative distribution opportunities, blurring traditional channel boundaries. Specialty retailers focus on brand education and premium positioning, offering unique value that mass retailers cannot replicate, which justifies their ability to secure higher wholesale margins.
Geography Analysis
In 2025, North America holds a 46.72% market share, highlighting its leadership in the plant-based food sector. This growth is supported by a well-established retail network and consumers' openness to trying dairy alternatives. The U.S. drives this regional expansion, with major retailers like Walmart and Target increasing their dairy-free product offerings to meet rising demand. Canada benefits from government initiatives in plant-based protein development, including Agriculture and Agri-Food Canada's USD 113 million investment in alternative protein research through 2024. In Mexico, where lactose intolerance affects over 80% of the population, there is significant demand for dairy-free alternatives. Regulatory support, such as the FDA's clear labeling guidelines, aids product development and marketing strategies.
Asia Pacific is experiencing rapid growth, with a projected CAGR of 14.62% through 2031, driven by demographic and economic changes that favor plant-based adoption. China's expanding plant-based milk market provides the necessary manufacturing infrastructure and consumer familiarity to support the frozen dessert segment. In Japan, the aging population increasingly seeks functional foods with health benefits, making fortified dairy-free ice cream a popular choice for both indulgence and nutrition. India's vegetarian culture aligns naturally with plant-based products, and rising disposable incomes are driving demand for premium offerings. Australia serves as an innovation hub, with local brands creating tropical flavors that appeal to broader Asia Pacific markets. However, the regulatory environment varies across the region, with some countries supporting plant-based labeling while others impose restrictions on dairy-related terminology.
Europe's established regulatory framework under the EU Novel Food Regulation creates compliance challenges that favor experienced players, leading to market share consolidation. The UK's post-Brexit regulatory independence allows for faster approval of novel ingredients, particularly precision fermentation proteins, which require extensive safety documentation. Germany leads regional consumption due to its strong environmental awareness and willingness to pay premiums for sustainable products. In France, the country's culinary heritage sets high expectations for plant-based manufacturers to replicate dairy-like taste profiles. The Netherlands acts as a distribution hub for Europe, with major food companies establishing plant-based innovation centers to serve the wider market. Sustainability regulations are increasingly shaping product development, with carbon footprint labeling driving the use of lower-impact ingredients.

Competitive Landscape
The dairy-free ice cream market is characterized by fragmented competition, with a concentration score of 3 out of 10. This indicates considerable opportunities for specialized brands targeting niche consumer segments. Established food giants like Unilever and Danone capitalize on their distribution scale and brand strength to dominate the mass market, while niche players such as NadaMoo! and Oatly leverage targeted positioning to command premium pricing. The competitive environment favors companies with either significant scale advantages or highly differentiated product offerings, leaving mid-tier players susceptible to margin pressures.
Technology adoption varies widely; for example, precision fermentation leaders like Perfect Day collaborate with established manufacturers to gain distribution access while maintaining their innovation edge. Patent filings in plant-based formulation technologies have increased, with key players securing intellectual property rights for advanced stabilizer systems and texture enhancement methods. Strategic trends show a growing collaboration between traditional dairy companies and plant-based innovators through partnerships, acquisitions, and joint ventures. Greenyard's acquisition of Crème de la Crème in April 2025 illustrates a consolidation trend, where established players opt to acquire specialized capabilities rather than develop them internally.
The competitive landscape increasingly rewards companies that can effectively navigate complex regulatory frameworks while maintaining cost efficiency, creating barriers to entry that benefit established players. Emerging disruptors are focusing on direct-to-consumer models and subscription services to build customer loyalty without competing for retail shelf space. Additionally, social media marketing and influencer partnerships have become critical for brand building, particularly among younger demographics driving category growth.
Dairy Free Ice Cream Industry Leaders
Danone SA
Oatly Group AB
Oregon Ice Cream Company
Unilever PLC
Van Leeuwen Ice Cream
- *Disclaimer: Major Players sorted in no particular order


Recent Industry Developments
- August 2025: Kinish, a Tokyo-based startup, launched its new rice-based dairy-free ice cream brand called The Rice Creamery. The range features three flavors—Honoka (Original), Master’s Uji Matcha, and Elegant Dutch Chocolate—and is available at retailers in Tokyo and online.
- July 2025: Latvia’s leading dairy and ice cream producer Food Union launched the first-ever 100% vegan ice cream under its iconic Pols brand. The new vegan ice cream was crafted entirely from plant-based ingredients, including premium coconut milk and coconut oil.
- January 2025: Vesta launched India’s first vegan ice cream made entirely from coconut milk. Vesta’s coconut milk ice cream also aligned with regional preferences for natural ingredients and sustainability,
- June 2024: McDonald’s United Kingdom launched a new dairy-free ice cream-style frozen dessert called the Vegan Scoop, available in chocolate and strawberry flavors. The trial was rolled out in 52 selected restaurants across the North West of England,


Global Dairy Free Ice Cream Market Report Scope
Off-Trade are covered as segments by Distribution Channel. Asia-Pacific, Europe, Middle East, North America are covered as segments by Region.| Coconut |
| Almond |
| Soy |
| Oats |
| Others |
| Vanilla |
| Chocolate |
| Fruit Based |
| Caramel |
| Others |
| Tubs |
| Pouches |
| Cones and Bars |
| Others |
| Off Trade | Supermarkets & Hypermarkets |
| Convenience Stores | |
| Specialist Retailers | |
| Online Retail | |
| Other Channels | |
| On-Trade |
| North America | United States |
| Mexico | |
| Canada | |
| Rest of North America | |
| Europe | United Kingdom |
| Germany | |
| France | |
| Spain | |
| Italy | |
| Russia | |
| Netherlands | |
| Rest of Europe | |
| Asia Pacific | China |
| Japan | |
| India | |
| Australia | |
| Rest of Asia Pacific | |
| South America | Brazil |
| Argentina | |
| Rest of South America | |
| Middle East and Africa | Saudi Arabia |
| South Africa | |
| Rest of Middle East and Africa |
| Ingredient Type | Coconut | |
| Almond | ||
| Soy | ||
| Oats | ||
| Others | ||
| Flavor Type | Vanilla | |
| Chocolate | ||
| Fruit Based | ||
| Caramel | ||
| Others | ||
| Packaging Type | Tubs | |
| Pouches | ||
| Cones and Bars | ||
| Others | ||
| Distribution Channels | Off Trade | Supermarkets & Hypermarkets |
| Convenience Stores | ||
| Specialist Retailers | ||
| Online Retail | ||
| Other Channels | ||
| On-Trade | ||
| Geography | North America | United States |
| Mexico | ||
| Canada | ||
| Rest of North America | ||
| Europe | United Kingdom | |
| Germany | ||
| France | ||
| Spain | ||
| Italy | ||
| Russia | ||
| Netherlands | ||
| Rest of Europe | ||
| Asia Pacific | China | |
| Japan | ||
| India | ||
| Australia | ||
| Rest of Asia Pacific | ||
| South America | Brazil | |
| Argentina | ||
| Rest of South America | ||
| Middle East and Africa | Saudi Arabia | |
| South Africa | ||
| Rest of Middle East and Africa | ||


Market Definition
- Dairy Alternatives - Dairy alternatives are foods that are made from plant-based milk/oils instead of their usual animal products, such as cheese, butter, milk, ice cream, yogurt, etc. Plant-based or non-dairy milk alternative is the fast-growing segment in the newer food product development category of functional and specialty beverage across the globe.
- Non-Dairy Butter - Non dairy butter is a vegan butter alternative that is made from a mixture of plant oils. With an increase in alternative diets like vegetarianism, veganism, and gluten intolerance, plant butter is a healthy non-dairy substitute for normal butter.
- Non-Dairy Ice Cream - Plant based ice cream is a growing category. Non-dairy ice cream is a type of dessert made without any animal ingredients. This is typically considered a substitute for regular ice cream for those who cannot or do not eat animal or animal-derived products, including eggs, milk, cream, or honey.
- Plant-Based Milk - Plant based milks are milk substitutes that are made from nuts (e.g., hazelnuts, hemp seeds), seeds (e.g., sesame, walnuts, coconuts, cashews, almonds, rice, oats, etc.) or legumes (e.g., soy). Plant-based milk such as soy milk and almond milk have been popular in East Asia and the Middle East for centuries.
| Keyword | Definition |
|---|---|
| Cultured Butter | Cultured butter is prepared by having the raw butter go through chemical processing and has been added with certain emulsifiers and foreign ingredients. |
| Uncultured Butter | This type of butter is one which has not been processed in any way |
| Natural Cheese | The type of cheese in its most natural form. It is made from natural and simple products and ingredients, including fresh and natural salts, natural colors, enzymes, and high-quality milk. |
| Processed Cheese | Processed cheese undergoes the same processes as natural cheese; however, it requires more steps and many different forms of ingredients. Making processed cheese involves melting natural cheese, emulsifying it, and adding preservatives and other artificial ingredients or colorings. |
| Single Cream | Single cream contains around 18% fat. It’s a single layer of cream that appears over boiled milk. |
| Double Cream | Double cream contains 48% fat, more than double the amount of fat of single cream. It’s heavier and thicker than single cream |
| Whipping Cream | This has a much higher fat percentage than single cream (36%). Used to top cakes, pies, and puddings and as a thickener for sauces, soups, and fillings. |
| Frozen Desserts | Desserts that are meant to be eaten in frozen condition. E.g., sherbets, sorbets, frozen yogurts |
| UHT Milk (Ultra-high temperature milk) | Milk heated at a very high temperature. Ultra-high-temperature processing (UHT) of milk involves heating for 1–8 sec at 135–154°C. which kills the spore-forming pathogenic microorganism, resulting in a product with a shelf-life of several months. |
| Non-dairy butter/Plant-based butter | Butter made from plant-derived oil such as coconut, palm, etc. |
| Non-dairy Yogurt | Yogurt made from typically made from nuts, like almonds, cashews, coconuts, and even other foods like soybeans, plantains, oats, and peas |
| On-trade | It refers to restaurants, QSRs, and bars. |
| Off-trade | It refers to supermarkets, hypermarkets, on-line channels, etc. |
| Neufchatel cheese | One of the oldest kinds of cheese in France. It is a soft, slightly crumbly, mold-ripened, bloomy-rind cheese made in the Neufchâtel-en-Bray region of Normandy. |
| Flexitarian | It refers to a consumer preferring a semi-vegetarian diet, that is centered on plant foods with limited or occasional inclusion of meat. |
| Lactose Intolerance | Lactose intolerance is a reaction in digestive system to lactose, the sugar in milk. It causes uncomfortable symptoms in response to the consumption of dairy products. |
| Cream Cheese | Cream cheese is a soft and creamy fresh cheese with a tangy taste made from milk and cream. |
| Sorbets | Sorbet is a frozen dessert made using ice combined with fruit juice, fruit purée, or other ingredients, such as wine, liqueur, or honey. |
| Sherbet | Sherbet is a sweetened frozen dessert made with fruit and some sort of dairy product such as milk or cream. |
| Shelf stable | Foods that can be safely stored at room temperature, or "on the shelf," for at least one year and do not have to be cooked or refrigerated to eat safely. |
| DSD | Direct Store Delivery is the process in supply chain management wherein the product is delivered from manufacturing plant directly to the retailer. |
| OU Kosher | Orthodox Union Kosher is a kosher certification agency based in New York City. |
| Gelato | Gelato is a frozen creamy dessert made with milk, heavy cream and sugar. |
| Grass-fed Cows | Grass-fed cows are allowed to graze in pastures, where they eat a variety of grasses and clover. |


Research Methodology
Mordor Intelligence follows a four-step methodology in all our reports.
- Step-1: Identify Key Variables: In order to build a robust forecasting methodology, the variables and factors identified in Step 1 are tested against available historical market numbers. Through an iterative process, the variables required for market forecast are set, and the model is built on the basis of these variables.
- Step-2: Build a Market Model: Market-size estimations for the forecast years are in nominal terms. Inflation is not a part of the pricing, and the average selling price (ASP) is kept constant throughout the forecast period for each country.
- Step-3: Validate and Finalize: In this important step, all market numbers, variables, and analyst calls are validated through an extensive network of primary research experts from the market studied. The respondents are selected across levels and functions to generate a holistic picture of the market studied.
- Step-4: Research Outputs: Syndicated Reports, Custom Consulting Assignments, Databases & Subscription Platforms


