United States Dairy Desserts Market Size and Share
Market Overview
| Study Period | 2021 - 2031 |
|---|---|
| Forecast Data Period | 2026 - 2031 |
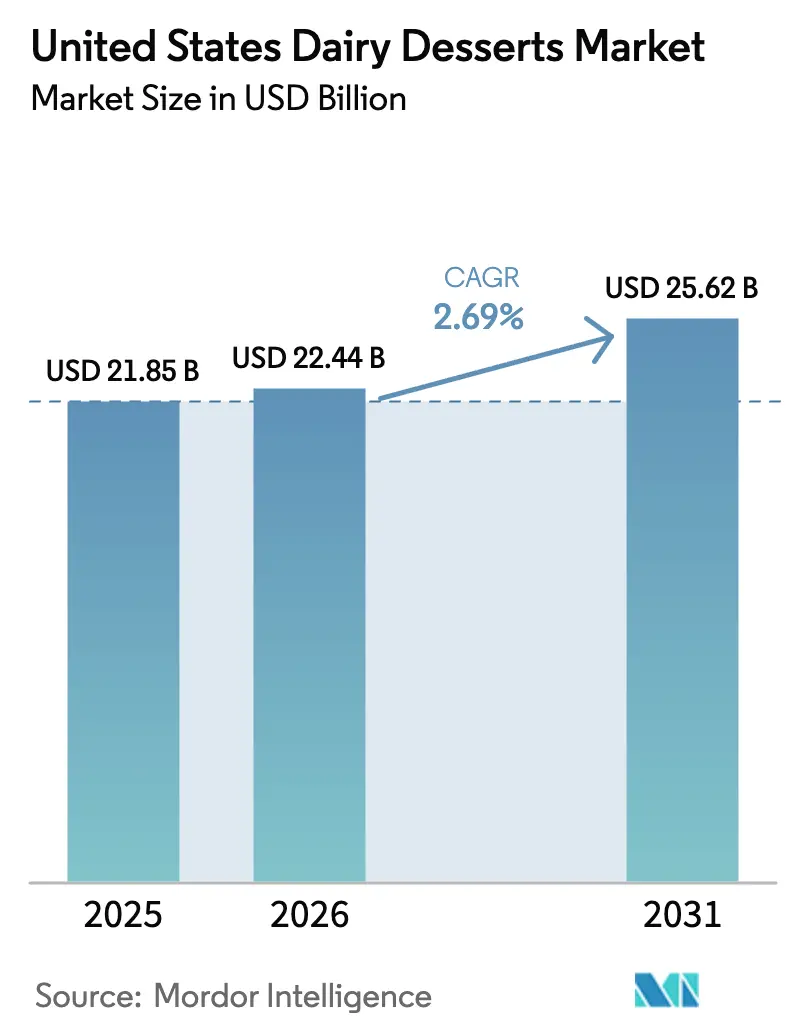
| Base Year Market Size (2025) | USD 21.85 Billion |
| Market Size (2026) | USD 22.44 Billion |
| Market Size (2031) | USD 25.62 Billion |
| Growth Rate (2026 - 2031) | 2.69% CAGR |
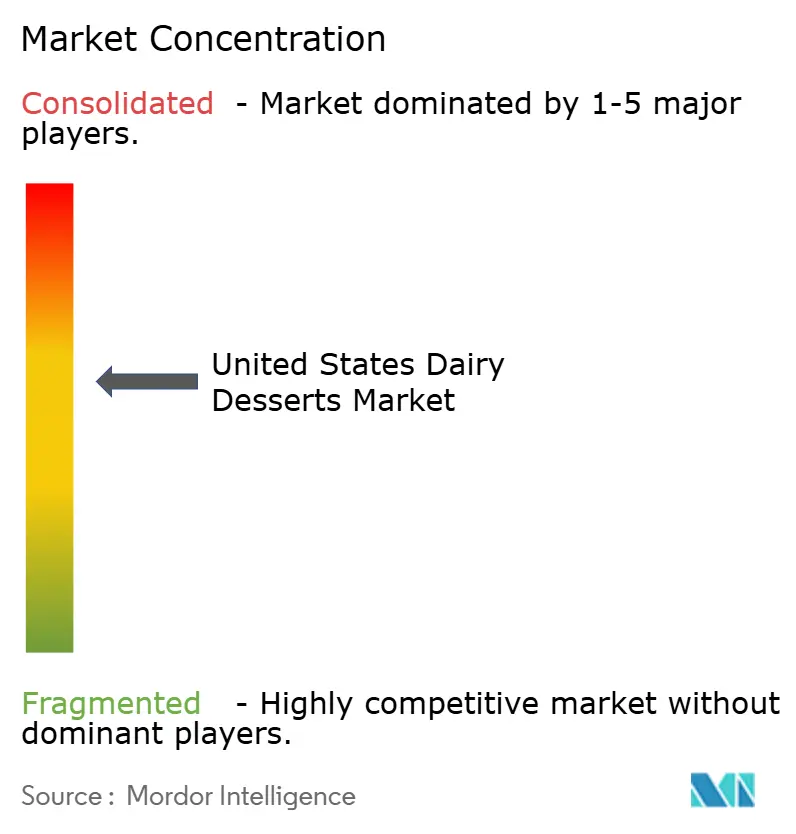
| Market Concentration | Medium |
Major Players *Disclaimer: Major Players sorted in no particular order Image © Mordor Intelligence. Reuse requires attribution under CC BY 4.0. | |
United States Dairy Desserts Market Analysis by Mordor Intelligence
United States dairy desserts market size in 2026 is estimated at USD 22.44 billion, growing from 2025 value of USD 21.85 billion with 2031 projections showing USD 25.62 billion, growing at 2.69% CAGR over 2026-2031. The market is anticipated to grow steadily over the forecast period, although the performance of individual segments reveals significant variations. Frozen desserts are emerging as a standout category, experiencing much faster growth compared to traditional ice cream, driven by evolving consumer preferences and innovation in product offerings. On-trade channels, which were previously impacted, are now showing a robust recovery, reflecting a resurgence in consumer dining-out habits. Additionally, premium flavors such as nut-and-caramel combinations are resonating strongly with consumers, contributing to their increasing popularity. Unilever's strategic introduction of artificial intelligence (AI)-enabled freezers underscores the transformative potential of advanced distribution technologies in enhancing customer engagement, boosting sales, and driving overall market growth. The rising consumer demand for products that cater to specific dietary needs, such as high-protein, lactose-free, and glucagon-like peptide-1 (GLP-1)-friendly options, is helping to counterbalance the stagnation observed in traditional product lines. Moreover, cold-storage grants provided by the United States Department of Agriculture (USDA) are playing a pivotal role in reducing spoilage and ensuring efficient distribution, thereby improving product availability across diverse regions.
Key Report Takeaways
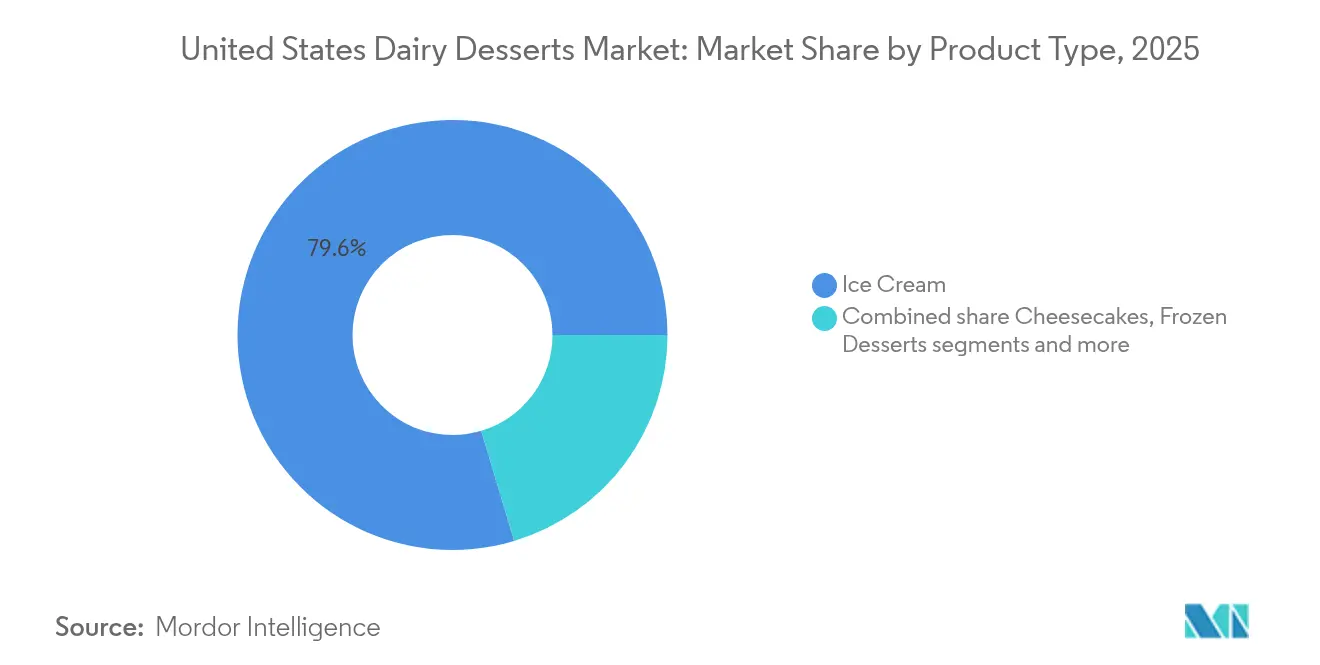
- By product type, ice cream held 79.63% of United States dairy desserts market share in 2025, while frozen desserts are advancing at a 3.83% CAGR through 2031.
- By packaging, cups and tubs commanded 39.72% of the United States dairy desserts market size in 2025 and are projected to grow at 3.82% through 2031.
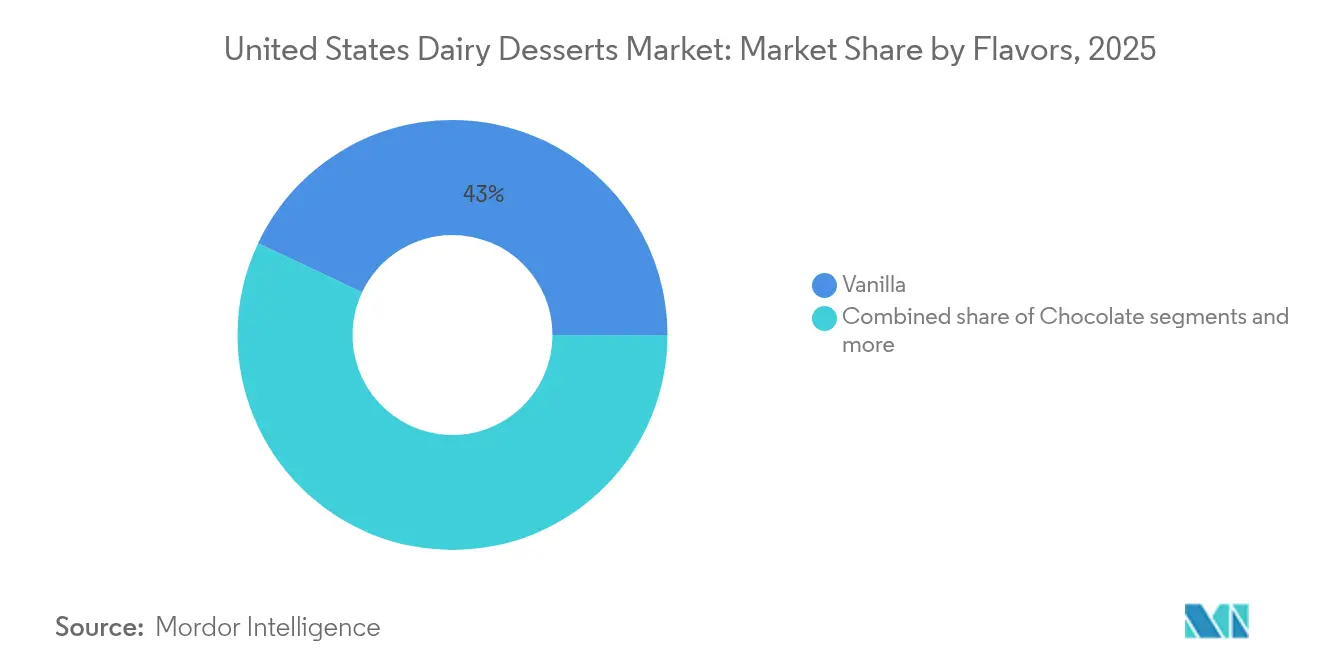
- By flavor, vanilla led with 42.98% revenue share in 2025; nuts and caramel are expected to register the fastest 4.08% CAGR to 2031.
- By distribution channel, off-trade captured 80.92% volume in 2025; on-trade is recovering at a 3.6% CAGR through 2031.
Note: Market size and forecast figures in this report are generated using Mordor Intelligence’s proprietary estimation framework, updated with the latest available data and insights as of 2026.
United States Dairy Desserts Market Trends and Insights
Drivers Impact Analysis*
| Driver | (~)% Impact on CAGR Forecast | Geographic Relevance | Impact Timeline |
|---|---|---|---|
| Growing health-conscious consumer base demanding reduced-fat, no-sugar, and lactose-free dairy desserts | +0.8% | National, with concentration in urban metros and West Coast | Medium term (2-4 years) |
| Increasing demand for premium and innovative dairy dessert products with novel ingredients and flavors | +0.6% | National, strongest in Northeast and Pacific regions | Medium term (2-4 years) |
| Strong cold chain infrastructure ensuring product quality and availability across regions | +0.4% | National, with USDA-funded expansions in Virginia, Iowa, and Midwest | Long term (≥ 4 years) |
| Rising interest in sustainable packaging and environmentally friendly products | +0.3% | National, led by California, Oregon, and Northeast states | Medium term (2-4 years) |
| Expanding distribution networks, including supermarkets, hypermarkets, and online retailers | +0.4% | National, with e-commerce gains in suburban and rural areas | Short term (≤ 2 years) |
| Rising demand for flavored and variety options such as chocolate, strawberry, and cheesecake | +0.3% | National, with regional preferences (nuts/caramel in South, fruit-based in West) | Short term (≤ 2 years) |
| Source: Mordor Intelligence | |||


Growing Health-Conscious Consumer Base Demanding Reduced-Fat, No-Sugar, and Lactose-Free Dairy Desserts
According to the International Food Information Council's 2024 survey, consumers in the United States are increasingly focused on reducing their sugar intake[1]Source: International Food Information Council, “2024 IFIC Food & Health Survey,” ific.org . This shift has created a structural demand for reformulated dairy desserts that offer indulgence while meeting specific nutritional standards. In response to this trend, Two Spoons launched a GLP-1 (glucagon-like peptide-1) friendly ice cream line in 2024. This product features high protein content and reduced sugar levels, specifically targeting the estimated 12 million Americans using GLP-1 medications, who often report a reduced appetite for traditional high-calorie desserts. Similarly, Perfect Day's precision-fermented whey protein, which is bioidentical to dairy but produced without the use of animals, enabled Breyers to introduce lactose-free ice cream variants. These products retain a creamy texture and rich taste, addressing the needs of the 36 percent of U.S. adults who self-report lactose intolerance. Innovations in sweeteners are also advancing rapidly. Ingredients such as allulose and tagatose provide 70 percent of the sweetness of sucrose while having a negligible impact on blood sugar levels. These advancements allow manufacturers to make "no added sugar" claims without compromising critical product attributes like texture or freezing-point depression, which are essential for maintaining scoopability. Furthermore, the United States Food and Drug Administration's (FDA) 2024 qualified health claim linking yogurt consumption to a reduced risk of type 2 diabetes offers regulatory support for yogurt-based frozen desserts and parfaits. This positions these products as functional indulgences that provide health benefits, rather than being viewed solely as discretionary treats.
Increasing Demand for Premium and Innovative Dairy Dessert Products with Novel Ingredients and Flavors
In 2025, Talenti introduced Gelato Layers, a five-layer format featuring options such as Italian Tiramisu with mascarpone gelato, espresso chocolate fudge, and cold brew coffee sorbet. This launch highlighted how multi-texture complexity can justify premium pricing and encourage repeat purchases. In 2024, Häagen-Dazs collaborated with Kung Fu Tea to release boba-inspired flavors, including mango, guava, and dragon fruit, targeting the USD 3 billion United States bubble tea market. This initiative aimed to attract Gen Z consumers, who value visually appealing, Instagram-friendly products and cross-category innovations. Heritage Kulfi expanded the availability of South Asian-inspired flavors, such as cardamom, saffron pistachio, and rose, into mainstream grocery stores. This move catered to the 4.5 million South Asian diaspora and a growing consumer interest in authentic ethnic flavors. Danone North America launched the REMIX collection under its Oikos, Light + Fit, and Too Good & Co. brands. The collection involved screening over 100 ingredients to develop more than 50 flavor options, including nut-forward varieties like Coco Almond Chocolate and Salted Caramel, which combine indulgence with functional benefits, offering up to 15 grams of protein per serving.
Strong Cold Chain Infrastructure Ensuring Product Quality and Availability Across Regions
In 2023, the United States cold storage capacity reached 3.7 billion cubic feet, with 80% allocated to freezer space, according to data from the United States Department of Agriculture (USDA) [2]Source: United States Department of Agriculture, “Capacity of Refrigerated Warehouses,” esmis.nal.usda.gov. This storage capacity serves as the backbone for the distribution of dairy desserts across the nation, as highlighted by the International Dairy Foods Association (IDFA). In 2024, the USDA's Rural and Food Supply Infrastructure grants provided USD 6.3 million to Virginia and USD 5.2 million to Iowa to support expansions in cold storage and flash-freezing facilities. These investments are aimed at strengthening regional logistics for ice cream and frozen desserts. Furthermore, Producers Dairy allocated USD 2 million in 2024 for a refrigeration retrofit to enhance operational efficiency. Straus Family Creamery piloted electric heat pump systems, achieving a 30% reduction in energy consumption. These initiatives underscore the industry's commitment to both increasing cold chain capacity and advancing sustainability efforts.
Rising Interest in Sustainable Packaging and Environmentally Friendly Products
Bubbies successfully reduced plastic usage by 310 tons annually by transitioning to compostable trays for its mochi ice cream line. This strategic move aligns with the preferences of 73% of United States consumers who prioritize recyclable packaging, as highlighted in a 2024 National Restaurant Association survey. So Delicious Dairy Free has committed to achieving 100% recyclable or compostable packaging by 2030, demonstrating its dedication to sustainability. Cabot Creamery Cooperative integrated 30% post-consumer recycled (PCR) content into its dairy dessert cups, significantly reducing the demand for virgin plastic and ensuring compliance with extended producer responsibility (EPR) mandates in states such as California, Maine, and Oregon. Clover Sonoma transitioned 80% of its ice cream portfolio to paperboard cups, eliminating 34,000 pounds of plastic annually. The company also leveraged Forest Stewardship Council (FSC) certification to appeal to environmentally conscious retailers and consumers. Ben & Jerry's emphasized the use of fiber-based packaging and FSC-certified materials to support its sustainability goals. Similarly, Danone North America adopted post-consumer recycled (PCR) content and How2Recycle labels, aiming to improve sorting and recycling rates at the end of the product lifecycle.
Restraints Impact Analysis*
| Restraint | (~)% Impact on CAGR Forecast | Geographic Relevance | Impact Timeline |
|---|---|---|---|
| Health concerns related to high sugar and fat content in traditional dairy desserts | -0.4% | National, with heightened sensitivity in urban and coastal markets | Medium term (2-4 years) |
| Stringent regulations on food safety, labeling, and quality compliance | -0.3% | National, with state-level variations (California, Maine, Oregon) | Long term (≥ 4 years) |
| Potential product spoilage risk during transportation and storage | -0.2% | National, acute in Sun Belt states and rural areas with limited cold chain | Short term (≤ 2 years) |
| Seasonal demand fluctuations causing variable sales volumes | -0.2% | National, most pronounced in northern states with harsh winters | Short term (≤ 2 years) |
| Source: Mordor Intelligence | |||
Health Concerns Related to High Sugar and Fat Content in Traditional Dairy Desserts
Traditional ice cream formats generally contain high levels of sugar and fat per half-cup serving, which conflicts with dietary guidelines recommending limited daily intake of added sugar for both men and women. Halo Top experienced a significant year-over-year sales decline in the 52 weeks ending August 2024, reflecting a shift in consumer preferences away from low-calorie options that compromise on taste. In response to evolving health-conscious trends, Breyers introduced Carb Smart bars, available in strawberry and rocky road flavors, designed to offer reduced carbohydrates and portion control while maintaining indulgence. Furthermore, Smearcase launched Froco, a cottage-cheese-based ice cream that delivers a high protein content per pint, with reduced fat compared to traditional ice cream and added collagen. This product is aimed at a substantial portion of U.S. consumers who prioritize protein in their snack and dessert choices.
Stringent Regulations on Food Safety, Labeling, and Quality Compliance
The United States Food and Drug Administration's (FDA) Food Safety Modernization Act (FSMA) Rule 204 mandates enhanced traceability for soft and fresh cheeses, which are critical ingredients in popular desserts such as cheesecakes and mousses. The compliance deadline, originally scheduled for January 2026, has been proposed for extension to July 2028. This regulation requires businesses to maintain 24-hour electronic recordkeeping, assign traceability lot codes, and capture key data elements at every stage of the supply chain. Additionally, the FDA has proposed front-of-package labeling that categorizes products as high, medium, or low in saturated fat, sodium, and added sugars. This labeling initiative could potentially impact traditional dairy desserts by influencing consumer perceptions. Retailers may respond by de-listing high-sugar stock-keeping units (SKUs) or relegating them to less prominent shelf positions, which could affect sales and visibility. Moreover, compliance with the FDA's qualified health claim for yogurt and its association with type 2 diabetes requires rigorous substantiation through clinical trials or systematic reviews. This process demands a multi-year commitment and significant financial investment, often amounting to millions of dollars. Such requirements create a competitive advantage for established manufacturers like Danone and General Mills, who have the resources to meet these demands. Conversely, smaller and emerging brands may find it challenging to allocate the necessary resources, limiting their ability to innovate and compete effectively in the market.
*Our forecasts treat driver/restraint impacts as directional, not additive. The impact forecasts reflect baseline growth, mix effects, and variable interactions.
Segment Analysis
By Product Type: Frozen Desserts Outpace Ice Cream
Mochi ice cream, Greek yogurt bars, and gelato are transforming the frozen desserts market, which is forecasted to grow at an annual rate of 3.83% through 2031. This growth rate is nearly double the market's baseline growth of 2.69%, indicating a significant shift in consumer preferences. Ice cream, while maintaining a commanding 79.63% market share in 2025, is growing at a slower pace due to market saturation and increasing consumer preference for healthier alternatives. Bubbies and My/Mochi have played a key role in driving the adoption of mochi ice cream by introducing three new flavors each in 2024. Bubbies launched Chocolate Peanut Butter, Churro, and Mint Chocolate Chip flavors, while My/Mochi's new flavors remain undisclosed. These brands focus on portion control, with each piece typically containing 80 to 110 calories, and visually appealing designs that resonate with Generation Z (Gen Z) and Millennial consumers. These younger demographics prioritize snackable and convenient formats over traditional pint-sized offerings, making mochi ice cream a popular choice.Yasso's Greek yogurt bars, which provide 5 to 6 grams of protein per bar, have expanded their distribution network to over 15,000 retail locations by 2024. This positions frozen yogurt as a functional dessert that bridges the gap between indulgence and nutrition, appealing to health-conscious consumers seeking balanced options. Additionally, ice cream sandwiches and novelty bars have experienced growth through strategic licensed partnerships. For instance, Wells Enterprises introduced Nutella and Kinder Bueno lines, while Unilever launched the Breyers Campfire Collection, featuring s'mores bars with a toasted marshmallow core and Hershey's chocolate. These collaborations highlight the effectiveness of cross-category licensing in attracting households by offering familiar and trusted flavors in innovative formats. Such partnerships not only drive consumer interest but also encourage trial purchases, further expanding the reach of frozen dessert products.


By Packaging Type: Cups and Tubs Dominate Through Sustainability and Convenience
Cups and tubs held a 39.72% market share in 2025 and are expected to grow at a rate of 3.82% through 2031. This growth is driven by consumer demand for single-serve portion control, the increasing use of sustainable paperboard, and retailer preferences for stackable, shelf-stable formats that maximize freezer space. Wells Enterprises transitioned over 200 million gallons annually from polystyrene to polypropylene cups, improving recyclability and aligning with extended producer responsibility (EPR) mandates in states such as California, Maine, and Oregon.
Berry Global introduced Twist pints, made from recyclable polypropylene and high-density polyethylene (HDPE), which were launched at Walmart, Kroger, and Publix for Blue Bunny in 2024. This demonstrates that sustainable packaging can achieve nationwide distribution while maintaining cost efficiency and essential barrier properties. Additionally, Huhtamaki's Icon packaging, composed of 95% bio-based materials, entered pilot programs with mid-sized creameries aiming to stand out through environmental credentials and appeal to the 73% of consumers who prioritize recyclable packaging.
By Flavor: Nuts and Caramel Surge as Premiumization Accelerates
Vanilla held a 42.98% market share in 2025, driven by its adaptability as a base for mix-ins and its widespread appeal across different age groups. Its popularity underscores its role as a staple flavor in the market. On the other hand, nuts and caramel flavors are emerging as the fastest-growing segment, with a compound annual growth rate (CAGR) of 4.08% expected through 2031. This growth is supported by the inclusion of ingredients like salted caramel, hazelnut, and pecan, which enhance texture and offer a premium positioning to products.
Examples such as Coolhaus' balsamic fig and mascarpone pint and Talenti's hazelnut chocolate chip demonstrate how sophisticated flavor combinations—often inspired by European patisserie—are moving from niche offerings to mainstream acceptance. This shift is largely driven by Millennial and Generation X consumers who are increasingly seeking retail products that deliver restaurant-quality experiences.
By Distribution Channel: On-Trade Recovery Outpaces Off-Trade Growth
Off-trade channels, including supermarkets, hypermarkets, convenience stores, and online retail platforms, accounted for 80.92% of the total volume in 2025. Prominent retailers such as Walmart, Kroger, Albertsons, and regional chains collectively represented 60% of grocery sales in the United States, underscoring the significant role of off-trade channels in shaping the frozen dessert market. Furthermore, the Census Bureau of the Department of Commerce reported that estimated United States retail e-commerce sales for the second quarter of 2025, adjusted for seasonal variation but not for price changes, increased by 1.4% (±0.9%) compared to the first quarter of 2025 .
On the other hand, on-trade outlets, such as restaurants, quick-service restaurants (QSRs), and foodservice establishments, are steadily recovering, with an annual growth rate of 3.6% projected through 2031. This recovery is being driven by the reintroduction of dessert menus and limited-time offerings as businesses adjust to the post-pandemic environment. The National Restaurant Association reported that total off-premises foodservice sales, including delivery and takeout, were 49% higher than in 2019, with delivery alone increasing by 65%. This indicates a growing opportunity for frozen desserts tailored for delivery, such as individually wrapped bars, cups, and sundae kits, to meet the evolving consumer demand beyond traditional dine-in experiences.
Geography Analysis
The United States dairy desserts market is shaped by regional preferences and infrastructure, influencing growth patterns across the country. The West Coast, including California, Oregon, and Washington, leads in sustainable packaging and premium flavor innovation. Companies such as Clover Sonoma have transitioned to paperboard cups, Straus Family Creamery is piloting electric heat pumps, and Tillamook is making packaging decisions based on life-cycle assessments. These efforts are driven by regulatory requirements, such as California's Senate Bill 54 (SB 54), and increasing consumer demand for environmentally responsible products. Meanwhile, the Northeast, including New York, Pennsylvania, and Massachusetts, is seeing strong recovery in on-trade channels. New York City's high density of restaurants and tourism has resulted in frozen dessert consumption being 15-20% higher per capita than the national average. Brands like Jeni's Splendid Ice Creams and Van Leeuwen Ice Cream are leveraging flagship scoop shops in Manhattan and Brooklyn to attract foot traffic and build brand recognition before expanding into grocery retail channels.
The Midwest, covering states like Illinois, Indiana, Iowa, and Wisconsin, benefits from its proximity to dairy farms and processing facilities. In 2024, three new ice cream production facilities became operational in Illinois, Indiana, and Texas, with additional capacity planned in Idaho and New York for 2025. These developments help reduce transportation costs and minimize temperature fluctuations, which can lead to spoilage during distribution. In the South, which includes Texas, Florida, and Georgia, year-round warm weather drives 40% higher summer demand than the national average. However, heat waves exceeding 100 degrees Fahrenheit increase refrigeration energy costs by 20-30% and elevate spoilage risks during loading and unloading. To address these challenges, distributors are investing in insulated blankets, dry ice, and expedited transit solutions. Additionally, the United States Department of Agriculture (USDA) awarded USD 6.3 million to Virginia and USD 5.2 million to Iowa in 2024 for cold storage and flash-freezing expansions, enhancing regional logistics capacity for ice cream and frozen desserts while reducing spoilage rates in rural areas by an estimated 15-20%.
Rural and suburban markets are also benefiting from the expansion of e-commerce. For example, Dippin' Dots' nationwide direct-to-consumer shipping and Milk Bar's entry into 3,500 grocery stores in 2024 demonstrate how heritage brands can scale distribution without compromising artisanal positioning. Furthermore, innovations such as Robomart's autonomous mobile ice cream stores and Flytrex's drone delivery pilots are testing last-mile solutions. These advancements aim to redefine competitive advantage in dense urban markets, where speed and convenience are critical to purchase decisions.
Competitive Landscape
The United States Dairy Desserts Market shows moderate consolidation, creating opportunities for regional businesses and niche players to expand their presence through unique product positioning, innovative distribution channels, and strategic collaborations. Unilever's decision to separate its ice cream division—generating EUR 7.5 billion (approximately USD 8.2 billion) in revenue—is expected to reshape the competitive landscape. The newly independent entity plans to focus on forming partnerships, expanding geographically, and streamlining its product portfolio without the limitations of operating within a larger conglomerate. Similarly, General Mills' sale of its North American yogurt portfolio, including brands like Yoplait, Go-Gurt, and Oui, to Lactalis and Sodiaal for USD 2.1 billion in September 2024, along with Campbell Soup Company's acquisition of Sovos Brands, which owns Noosa, for USD 2.7 billion in March 2024, reflects a strategic shift toward core dairy dessert offerings. These transactions aim to capitalize on existing distribution networks and manufacturing capabilities to drive operational efficiencies.
Adopting advanced technology is further enhancing the competitive edge of major manufacturers. By 2025, Unilever deployed 350,000 artificial intelligence (AI)-enabled freezers across the United States, achieving a 12 percent increase in sales through inventory optimization using image-capture technology and real-time restocking alerts. Such technological advancements are difficult for smaller brands to replicate without substantial financial investments.
These developments underscore the evolving dynamics of the United States Dairy Desserts Market, where strategic realignments and technological innovations are shaping the competitive environment. While large manufacturers leverage their resources to strengthen their market position, regional and niche players have opportunities to differentiate themselves through innovation and targeted strategies.
United States Dairy Desserts Industry Leaders
Blue Bell Creameries, Inc.
Conagra Brands Inc.
Dairy Farmers of America Inc.
Froneri International Limited
Gifford's Dairy Inc.
- *Disclaimer: Major Players sorted in no particular order

Recent Industry Developments
- January 2025: Unilever unveiled its 2025 United States ice cream lineup across Talenti, Breyers, Popsicle, Good Humor, Magnum, and Klondike, introducing over 20 new products including Talenti Gelato Layers (Chocolate Chip Cookie Batter, Italian Tiramisu, Snickerdoodle Cookie), Breyers Campfire Collection (toasted marshmallow, graham cracker, Hershey's chocolate), and Carb Smart bars (strawberry, rocky road), demonstrating continued assortment diversification and targeting of dietary niches.
- October 2024: Prairie Farms Dairy acquired SmithFoods, an Ohio-based manufacturer of milk, sour cream, cottage cheese, ice cream, and custard mixes, for an undisclosed sum; the acquisition complements Prairie Farms' network of dairy plants, expands its Ohio footprint, and aims to return value to its 600-plus dairy farm families, with seamless integration and no disruption to manufacturing or delivery
- April 2024: Rich Products launched the Specialty Treat Shop Turtle Cheesecake Mousse Parfait, a grab-and-go single-serve dessert combining cheesecake mousse with turtle-style inclusions (chocolate, caramel, nuts), aimed at foodservice retailers and convenience channels to capture impulse purchases and premium indulgence occasions .


United States Dairy Desserts Market Report Scope
Cheesecakes, Frozen Desserts, Ice Cream, Mousses, Others are covered as segments by Product Type. Off-Trade, On-Trade are covered as segments by Distribution Channel.| Cheesecakes |
| Frozen Desserts |
| Ice Cream |
| Mousses |
| Others |
| Cups and Tubs |
| Sticks and Bars |
| Others |
| Vanilla |
| Chocolate |
| Fruit-Based |
| Nuts and Caramel |
| Others |
| Off-Trade | Convenience Stores |
| Online Retail | |
| Specialist Retailers | |
| Supermarkets and Hypermarkets | |
| Others | |
| On-Trade |
| By Product Type | Cheesecakes | |
| Frozen Desserts | ||
| Ice Cream | ||
| Mousses | ||
| Others | ||
| By Packaging Type | Cups and Tubs | |
| Sticks and Bars | ||
| Others | ||
| By Flavor | Vanilla | |
| Chocolate | ||
| Fruit-Based | ||
| Nuts and Caramel | ||
| Others | ||
| By Distribution Channel | Off-Trade | Convenience Stores |
| Online Retail | ||
| Specialist Retailers | ||
| Supermarkets and Hypermarkets | ||
| Others | ||
| On-Trade | ||


Market Definition
- Butter - Butter is a yellow-to-white solid emulsion of fat globules, water, and inorganic salts produced by churning the cream from cows’ milk
- Dairy - Dairy product include milk and any of the foods made from milk, including butter, cheese, ice cream, yogurt, and condensed and dried milk.
- Frozen Desserts - Frozen dairy dessert means and includes products containing milk or cream and other ingredients which are frozen or semi-frozen prior to consumption, such as ice milk or sherbet, including frozen dairy desserts for special dietary purposes, and sorbet
- Sour Milk Drinks - Sour milk is thick, curdled milk, with a sour taste, obtained from the fermentation of milk. Sour milk drinks such as kefir, laban, buttermilk have been considered in the study
| Keyword | Definition |
|---|---|
| Cultured Butter | Cultured butter is prepared by having the raw butter go through chemical processing and has been added with certain emulsifiers and foreign ingredients. |
| Uncultured Butter | This type of butter is one which has not been processed in any way |
| Natural Cheese | The type of cheese in its most natural form. It is made from natural and simple products and ingredients, including fresh and natural salts, natural colors, enzymes, and high-quality milk. |
| Processed Cheese | Processed cheese undergoes the same processes as natural cheese; however, it requires more steps and many different forms of ingredients. Making processed cheese involves melting natural cheese, emulsifying it, and adding preservatives and other artificial ingredients or colorings. |
| Single Cream | Single cream contains around 18% fat. It’s a single layer of cream that appears over boiled milk. |
| Double Cream | Double cream contains 48% fat, more than double the amount of fat of single cream. It’s heavier and thicker than single cream |
| Whipping Cream | This has a much higher fat percentage than single cream (36%). Used to top cakes, pies, and puddings and as a thickener for sauces, soups, and fillings. |
| Frozen Desserts | Desserts that are meant to be eaten in frozen condition. E.g., sherbets, sorbets, frozen yogurts |
| UHT Milk (Ultra-high temperature milk) | Milk heated at a very high temperature. Ultra-high-temperature processing (UHT) of milk involves heating for 1–8 sec at 135–154°C. which kills the spore-forming pathogenic microorganism, resulting in a product with a shelf-life of several months. |
| Non-dairy butter/Plant-based butter | Butter made from plant-derived oil such as coconut, palm, etc. |
| Non-dairy Yogurt | Yogurt made from typically made from nuts, like almonds, cashews, coconuts, and even other foods like soybeans, plantains, oats, and peas |
| On-trade | It refers to restaurants, QSRs, and bars. |
| Off-trade | It refers to supermarkets, hypermarkets, on-line channels, etc. |
| Neufchatel cheese | One of the oldest kinds of cheese in France. It is a soft, slightly crumbly, mold-ripened, bloomy-rind cheese made in the Neufchâtel-en-Bray region of Normandy. |
| Flexitarian | It refers to a consumer preferring a semi-vegetarian diet, that is centered on plant foods with limited or occasional inclusion of meat. |
| Lactose Intolerance | Lactose intolerance is a reaction in digestive system to lactose, the sugar in milk. It causes uncomfortable symptoms in response to the consumption of dairy products. |
| Cream Cheese | Cream cheese is a soft and creamy fresh cheese with a tangy taste made from milk and cream. |
| Sorbets | Sorbet is a frozen dessert made using ice combined with fruit juice, fruit purée, or other ingredients, such as wine, liqueur, or honey. |
| Sherbet | Sherbet is a sweetened frozen dessert made with fruit and some sort of dairy product such as milk or cream. |
| Shelf stable | Foods that can be safely stored at room temperature, or "on the shelf," for at least one year and do not have to be cooked or refrigerated to eat safely. |
| DSD | Direct Store Delivery is the process in supply chain management wherein the product is delivered from manufacturing plant directly to the retailer. |
| OU Kosher | Orthodox Union Kosher is a kosher certification agency based in New York City. |
| Gelato | Gelato is a frozen creamy dessert made with milk, heavy cream and sugar. |
| Grass-fed Cows | Grass-fed cows are allowed to graze in pastures, where they eat a variety of grasses and clover. |


Research Methodology
Mordor Intelligence follows a four-step methodology in all our reports.
- Step-1: Identify Key Variables: In order to build a robust forecasting methodology, the variables and factors identified in Step 1 are tested against available historical market numbers. Through an iterative process, the variables required for market forecast are set, and the model is built on the basis of these variables.
- Step-2: Build a Market Model: Market-size estimations for the forecast years are in nominal terms. Inflation is not a part of the pricing, and the average selling price (ASP) is kept constant throughout the forecast period for each country.
- Step-3: Validate and Finalize: In this important step, all market numbers, variables, and analyst calls are validated through an extensive network of primary research experts from the market studied. The respondents are selected across levels and functions to generate a holistic picture of the market studied.
- Step-4: Research Outputs: Syndicated Reports, Custom Consulting Assignments, Databases & Subscription Platforms


