
Convenience Store Market Size and Share
Market Overview
| Study Period | 2020 - 2031 |
|---|---|
| Market Size (2026) | USD 746.71 Billion |
| Market Size (2031) | USD 1001.62 Billion |
| Growth Rate (2026 - 2031) | 6.05 % |
| Fastest Growing Market | Asia Pacific |
| Largest Market | North America |
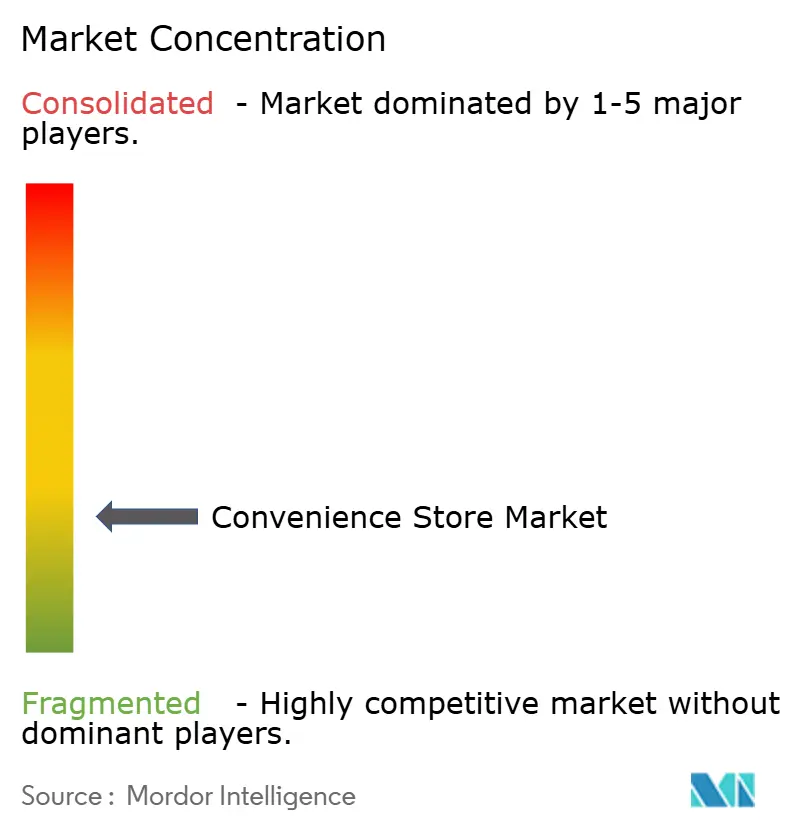
| Market Concentration | Low |
Major Players *Disclaimer: Major Players sorted in no particular order Image © Mordor Intelligence. Reuse requires attribution under CC BY 4.0. | |
Convenience Store Market Analysis by Mordor Intelligence
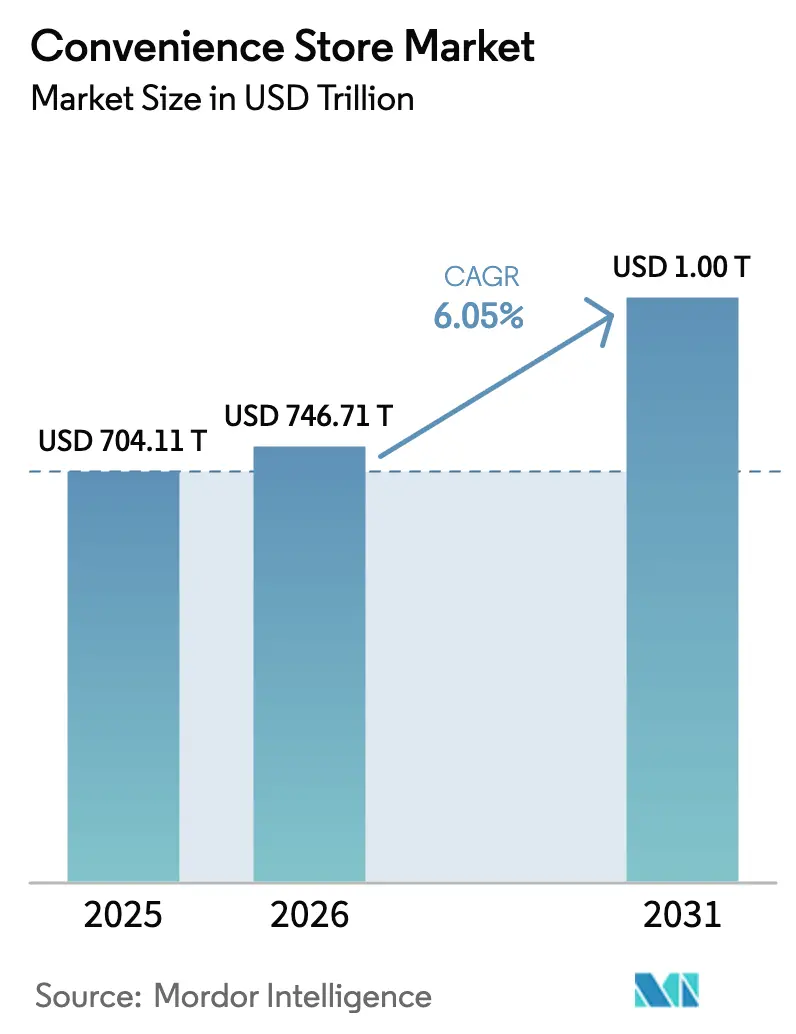
The convenience store market size was valued at USD 704.11 billion in 2025 and estimated to grow from USD 746.71 billion in 2026 to reach USD 1001.62 billion by 2031, at a CAGR of 6.05% during the forecast period (2026-2031). Momentum comes from urban migration, rising demand for instant‐gratification shopping, and the digital integration of ordering, loyalty, and payment tools across formats. Operators are enlarging prepared-food menus, embedding electric-vehicle charging, and applying real-time analytics to shorten replenishment cycles, all of which lift basket value even when fuel volumes soften. Private-equity roll-ups and corporate M&A remain active because the sector delivers predictable cash flows and resilient customer footfall, while regulatory incentives for alternative-energy infrastructure open fresh revenue streams. The competitive intensity within the market remains moderate, as the top chains account for only a limited portion of global revenue. This scenario creates opportunities for mid-tier and regional players to establish a competitive edge by focusing on localization strategies, expanding their product portfolios, and leveraging data-driven promotional activities to attract and retain customers.
Key Report Takeaways
- By product category, staple products led with 56.12% of the convenience store market share in 2025; emergency products are projected to rise at a 9.38% CAGR to 2031.
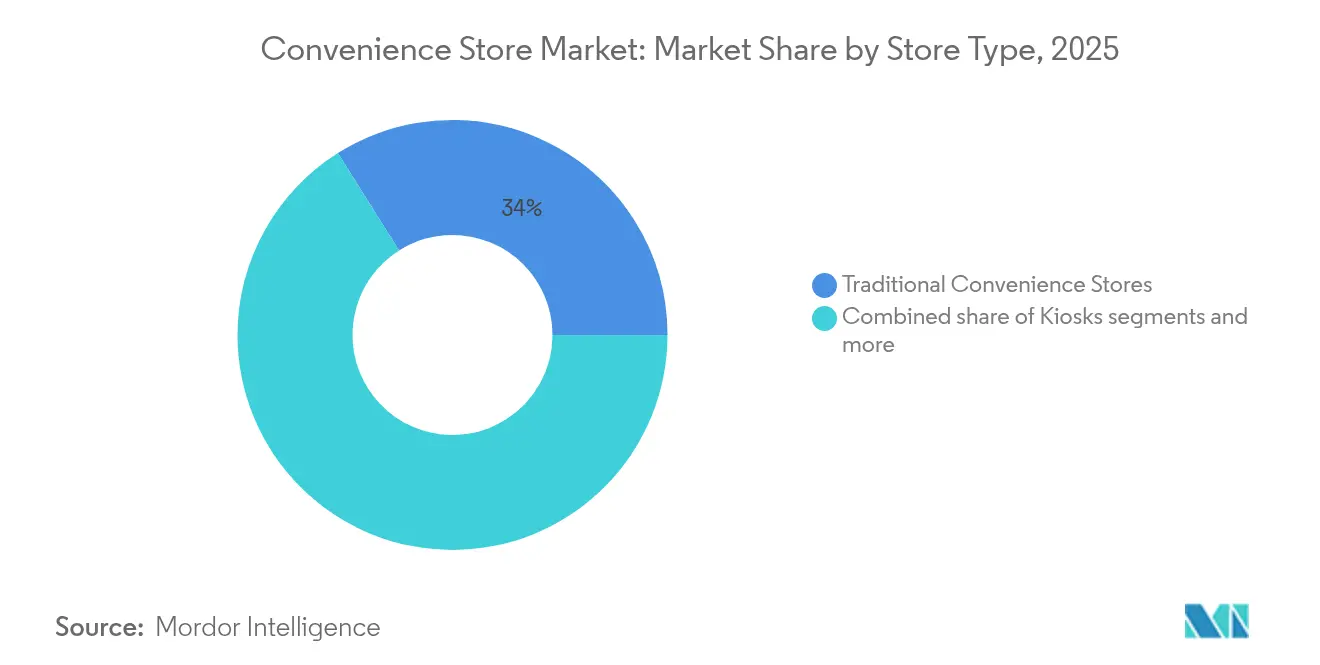
- By store type, traditional convenience stores held 33.95% revenue share of the convenience store market in 2025, while hyper convenience stores are advancing at a 10.35% CAGR through 2031.
- By ownership model, corporate-owned chains accounted for 47.05% of the convenience store market size in 2025; franchise stores are poised to grow at a 9.45% CAGR over the forecast period.
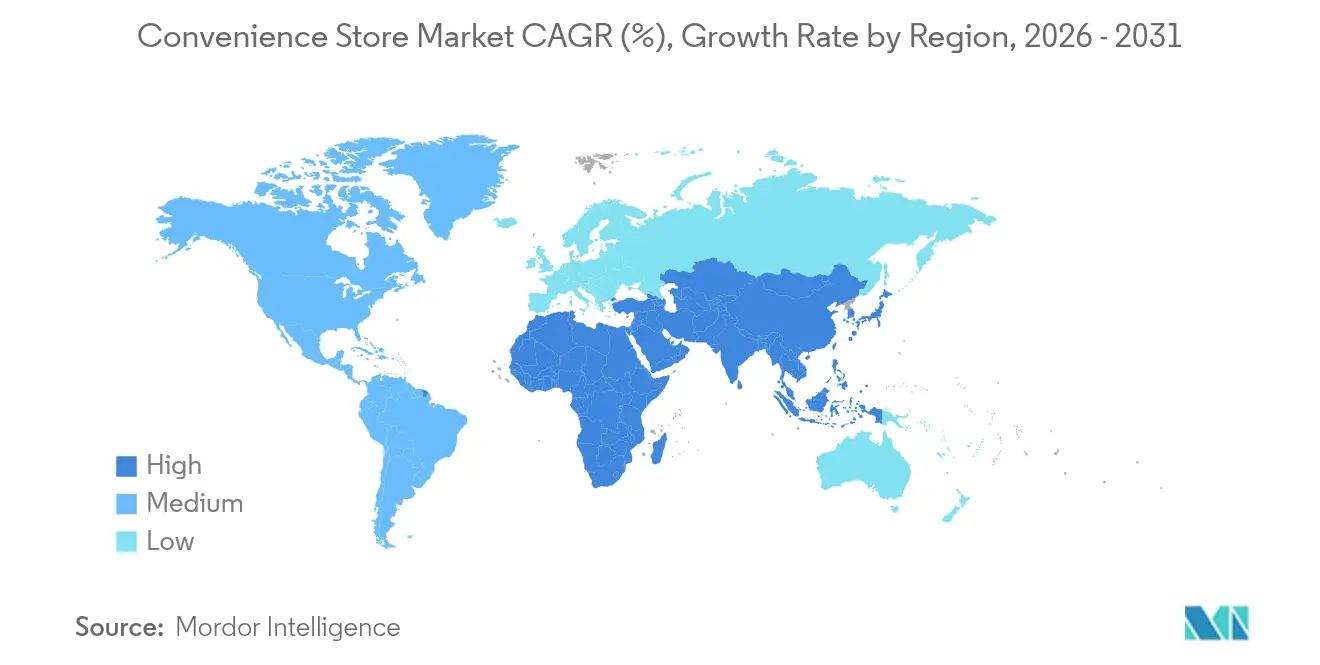
- By geography, North America commanded 38.10% of the 2025 revenue of the convenience store market, whereas Asia-Pacific is expected to post the fastest regional CAGR of 8.22% to 2031.
Note: Market size and forecast figures in this report are generated using Mordor Intelligence’s proprietary estimation framework, updated with the latest available data and insights as of 2026.
Market Trends and Insights
Drivers Impact Analysis of Convenience Store Market*
| Driver | (~) % Impact on CAGR Forecast | Geographic Relevance | Impact Timeline |
|---|---|---|---|
| Urban Micro-Fulfilment Demand Spike | +1.2% | Global, concentrated in dense urban areas | Medium term (2-4 years) |
| Cash-Rich Private-Equity Roll-Ups | +0.8% | North America & Europe primarily | Short term (≤ 2 years) |
| Digital Lottery & Gaming Commissions | +0.6% | North America, expanding to APAC | Medium term (2-4 years) |
| EV-Charger Foot-Traffic Boost | +1.1% | North America & EU leading, APAC following | Long term (≥ 4 years) |
| Subscription-Based Meal-Kits Pick-Up | +0.4% | Urban North America & Europe | Medium term (2-4 years) |
| Real-Time Planogram Analytics | +0.7% | Global, technology-advanced markets first | Short term (≤ 2 years) |
| Source: Mordor Intelligence | |||
Urban Micro-Fulfilment Demand Spike
Dense city cores increasingly rely on convenience stores as last-mile hubs for two-hour and same-day delivery services, allowing operators to serve both walk-in and digital orders from the same shelf location. In 2024, Casey's completed the acquisition of a Star Food Store located in Texas, strategically enhancing its presence in delivery-friendly zones. This acquisition is expected to generate incremental revenue while maintaining minimal growth in fixed costs, reflecting a calculated approach to operational expansion and resource optimization. Wawa’s 70-store Southeast expansion follows a similar logic, ensuring enough nodes to guarantee 15-minute delivery windows. Real-time planogram tools feed demand signals directly to distribution centres, keeping high-velocity SKUs in stock and trimming spoilage. Municipal zoning rules increasingly reserve curb-space permits for companies that maintain brick-and-mortar sites, tilting competitive advantage toward established convenience brands.
Cash-Rich Private-Equity Roll-Ups
First Reserve has explored a USD 1.5 billion sale of Refuel, underscoring how financial sponsors view the category as defensive, cash-generative, and exit-ready[1]Greg Lindenberg, “Casey’s Exceeds $1 Billion in EBITDA for First Time in C-Store Chain’s History,” CSP Daily News, cspdailynews.com . Arko Corp.’s decision to divest its company-operated stores, valued at USD 2 billion, reflects significant opportunities for both strategic acquirers and private equity sponsors. Casey’s recent acquisition of CEFCO sites demonstrates how corporations strategically utilize debt financing to compete with private capital, achieving operational efficiencies in areas such as fuel procurement and prepared-food logistics. These developments collectively drive the professionalization of operations, enhance data standardization, and improve access to capital within the convenience store market, fostering a more competitive and streamlined industry landscape.
Digital Lottery & Gaming Commissions
Online lottery approvals in Massachusetts and self-service terminal rollouts in Canada have added high-margin fee income that requires little additional labour. Digital channels significantly enhance the accessibility and distribution of ticket sales, enabling broader audience engagement. Meanwhile, physical stores serve as strategic touchpoints by facilitating prize-redemption activities, which, in turn, drive incremental revenue through increased ancillary sales. Age-verification modules integrate with existing POS hardware, a barrier for independent bodegas but a straightforward upgrade for chain operators. As U.S. states seek new tax revenue, more jurisdictions are expected to authorize digital lottery, sustaining this driver into the medium term.
EV-Charger Foot-Traffic Boost
Pilot Company, which operates a network of over 130 fast-charging stations, has reported significant growth in both customer traffic and revenue. This expansion highlights the increasing demand for electric vehicle (EV) infrastructure and its positive impact on business performance[2]Consumer Reports Staff, “Where to Charge Your Electric Car,” Consumer Reports, consumerreports.org . A considerable proportion of electric vehicle (EV) drivers make purchases of food or beverages during their charging sessions, which typically last several minutes. This behavior results in higher transaction values compared to visits by gasoline vehicle users. Federal tax incentives currently subsidize up to a significant portion of the installation expenses for direct-current fast chargers, thereby improving the return on investment for businesses adopting this technology. Additionally, early adopters gain a competitive advantage through locational exclusivity, as regulatory frameworks increasingly require the integration of EV infrastructure in new property developments.
Restraints Impact Analysis of Convenience Store Market*
| Restraint | (~) % Impact on CAGR Forecast | Geographic Relevance | Impact Timeline |
|---|---|---|---|
| Rising Urban Lease Renewals | -1.4% | Global urban centres, particularly in North America | Short term (≤ 2 years) |
| Stricter HFSS Product Limits | -0.9% | Europe leading, expanding globally | Medium term (2-4 years) |
| Labour Shortage & Minimum-Wage Escalation | -1.1% | Developed markets globally | Short term (≤ 2 years) |
| Cyber-Security Liability for Self-Checkout | -0.6% | Technology-advanced markets | Medium term (2-4 years) |
| Source: Mordor Intelligence | |||
Rising Urban Lease Renewals
In the fourth quarter of 2024, the average rental rate for shopping centres in the United States reached USD 24.76 per square foot, reflecting the ongoing demand for retail spaces and the resilience of the commercial real estate market CBRE.COM. Cap-rate compression continues to sustain elevated property valuations, which, in turn, drive significant increases in renewal rates. This trend emerges at a time when macroeconomic challenges are exerting pressure on discretionary consumer spending. 7-Eleven shuttered 400 under-performing North American sites in late 2024, chiefly in rent-intensive metros, to recycle capital into high-return formats. Zoning laws often block relocation to cheaper districts without fuel-tank re-permitting, locking operators into escalators that compress margins.
Labour Shortage & Minimum-Wage Escalation
Casey’s trimmed labour hours for seven straight quarters, yet still faced a slight jump in same-store employee expense in fiscal 2024. Overnight shifts remain hardest to staff due to safety concerns and sparse transit options. Murphy USA has reported an increase in operating expenses, primarily driven by higher wages and maintenance costs. This trend is largely attributed to jurisdictions implementing minimum wage hikes at a rate that surpasses productivity improvements, thereby exerting upward pressure on store-level operating expenditures. Self-checkout, AI inventory, and automated fuel dispensers mitigate but do not fully offset the upward pressure, particularly for independents lacking scale to amortize technology.
*Our forecasts treat driver/restraint impacts as directional, not additive. The impact forecasts reflect baseline growth, mix effects, and variable interactions.
Convenience Store Market Segment Analysis
By Product Type:
Emergency Products Drive Premium GrowthStaple products controlled 56.12% of 2025 revenue within the convenience store market share, underscoring consumer dependence on beverages, snacks, and daily necessities. Emergency products, although smaller in absolute terms, are slated to expand at a 9.38% CAGR, capitalizing on weather disruptions and supply shocks that redirect shoppers from supermarkets to nearby stores. The COVID-19 crisis proved the format’s resilience as a quasi-public-service node when larger outlets faced curfews. Prepared foods sharpen differentiation: Casey’s lifted prepared-food and dispensed-beverage revenue 11.4% year-over-year to USD 349 million in Q3 2024, illustrating margin accretion from hot food lines. Impulse products sit between the two, fuelled by strategic end-cap placement and promotional bundling that exploit immediate-consumption psychology.
Shoppers increasingly expect crisis-responsive assortments, portable chargers, bottled water, and OTC medication, driving SKU rationalization around high-turn, high-margin emergency items. Operators rely on real-time demand sensing to pre-stage these goods ahead of hurricanes or heat waves, protecting against stockouts and reinforcing brand trust. As climate volatility intensifies, emergency products could capture a larger slice of the convenience store market, especially in regions prone to extreme weather.




By Store Type:
Hyper Convenience Stores Reshape Format ExpectationsIn 2025, traditional box formats contributed 33.95% to the overall turnover, maintaining their role as a legacy model that integrates fuel pumps with retail sales areas. On the other hand, hyper-convenience stores are transforming the operational and economic dynamics of the market. These stores leverage compact square-foot layouts to incorporate features such as barista bars, fresh kitchens, and expanded grocery aisles, which are driving a strong CAGR of 10.35% through 2031. The scalability of this format is exemplified by QuikTrip's truck-stop hybrids in Ohio and Nevada, which combine Class-8 diesel lanes with additional amenities, including sit-down dining options and shower facilities, catering to a diverse customer base and enhancing overall value propositions.
Limited-selection and mini convenience sites persist where zoning caps square footage or foot-traffic density rewards micro-formats, such as transit hubs. Kiosks remain viable in subway corridors and campus quads by focusing on speed and single-serve SKUs. Expanded convenience stores bridge the gap, enlarging cooler space and adding basic produce to attract fill-in shoppers. Diversified footprints let chains tailor capex to local demographics, sustaining relevance across urban, suburban, and rural grids within the convenience store market.
By Ownership Model:
Franchise Growth Accelerates Market PenetrationCorporate ownership governed 47.05% of the 2025 convenience store market size, reflecting balance-sheet capacity and centralized decision-making advantages. Franchise stores, growing at 9.45% CAGR, offer asset-light expansion for brands while granting entrepreneurs proven playbooks, bulk purchasing, and tech platforms. Casey’s blend of acquisitions and franchising, adding 228 Fikes sites in Q3 2025, highlights a hybrid growth path that lifts systemwide sales without over-leveraging the parent.
Independents still anchor rural communities, often where large chains avoid low-volume routes. Yet they face capital hurdles for EV charging, data security, and wage regulation. Lending programs that preferentially back small businesses sustain the cohort, but consolidation momentum remains, evidenced by Nouria’s 2024 purchase of Enmarket’s 132 stores. Over time, franchise and corporate models are expected to absorb a larger slice of the convenience store market share, tightening procurement efficiencies and technology deployment.
Geography Analysis
North America Convenience Store Market
In 2025, North America contributed 38.10% to the total turnover, primarily driven by well-established fuel integration strategies and a high prevalence of household car ownership. During Q3 2025, U.S.-based chains such as Casey’s reported robust fuel margins while strategically increasing the proportion of inside sales attributed to high-margin prepared food offerings. Concurrently, Canada emerged as a leader in sustainability initiatives, exemplified by 7-Eleven Canada’s 2023 collaboration with a food-waste app, which successfully prevented 130,000 meals from being wasted. This initiative also laid the groundwork for similar implementations in the U.S. market. On the consolidation front, Alimentation Couche-Tard’s USD 47.2 billion acquisition bid for Seven & i is anticipated to necessitate the divestiture of certain stores to comply with regulatory requirements, a move that could significantly alter the competitive dynamics within the region.
APAC and Middle East Convenience Store Market
Asia-Pacific is poised for the highest growth at an 8.22% CAGR, led by compressed living spaces and rising disposable income that favour quick trips. Lawson plans to double overseas units to 14,000, and FamilyMart is reorganizing its China network while entering the U.S., underscoring cross-border ambitions. Japanese pioneers focus on proprietary hot foods and cashier-less tech; South Korea’s GS25 drives loyalty via super-app ecosystems that integrate payments, delivery, and media. The Middle East remains nascent yet promising: Saudi Arabia’s AL Sulaiman Group will ramp Circle K from 40 to 300 sites within five years, targeting hospitals, universities, and offices.
Europe and LATAM Convenience Store Market
Europe presents maturity tempered by regulatory rigor. HFSS product caps push chains to reformulate snack lines and market better-for-you ranges, supplying a template later exported worldwide. Switzerland’s Coop Pronto optimizes small-box assortments and energy-efficient refrigeration to meet both profitability and environmental goals. Latin America, particularly Brazil’s 8,100-store network with 60% franchise penetration, showcases rising middle-class demand and provides strategic adjacency for North American majors expanding southward.

Regulatory Landscape
Convenience stores operate under overlapping retail, food safety, payments, and energy rules that vary by country, which raises compliance costs and strengthens the benefits of scale. In Europe, high-fat-salt-sugar (HFSS) product limits are tightening merchandising options and prompting reformulation and range resets. In the U.S. and across Canadian provinces, controls around age verification and gambling or lottery distribution are being added as digital lottery approvals expand, including online lottery approvals in Massachusetts and self-service terminal rollouts in Canada. Chains with standardized POS and loyalty stacks can implement age-gating and audit trails faster than independents.
Energy-transition policy is also shaping site economics. Governments are using incentives to bring EV charging into retail forecourts, and many operators are pairing charging dwell time with prepared food and beverage offers. At the corporate level, disclosure and governance requirements affect capital allocation and M&A cadence. Seven & i Holdings operates under Japan Financial Services Agency and Tokyo Stock Exchange disclosure frameworks, while Alimentation Couche-Tard filings through Canadian securities authorities (SEDAR+) frame risk statements on tax, accounting, and cross-border regulatory change, which is material for acquisitions and integration across jurisdictions.
Value Chain Analysis
The convenience store value chain starts with procurement from CPG manufacturers and wholesalers, extends through fuel supply (where applicable), distribution centers, and last-mile replenishment to stores, and then into consumer-facing monetization via foodservice, loyalty, and digital delivery aggregators. Scale players increasingly internalize distribution and data flows. Alimentation Couche-Tard has highlighted investments in distribution center expansion and technology to increase supply-chain agility, while major chains use planogram and demand analytics to improve on-shelf availability and reduce shrink and spoilage.
Downstream, chains are widening beyond retail merchandise into services that lift margin per visit. Prepared-food production (in-store kitchens and commissary support), payments, and financial services are becoming more integrated into the store proposition; in Japan, FamilyMart is incorporating Seven Bank ATM infrastructure across its network to embed cash access and transaction services into the format. Across developed markets, labor constraints and cybersecurity liabilities at self-checkout are pushing investment in automation, stronger POS controls, and standardized operating procedures, which favors franchised and corporate chains that can amortize technology and compliance across larger store bases.
Competitive Landscape
Moderate fragmentation defines the convenience store industry, with seven-and-a-half U.S. chains covering just one-quarter of stores, leaving ample room for consolidators. 7-Eleven commands 8.2% of outlets, with Circle K trailing at roughly 5,833 locations. Technology adoption separates leaders from laggards: 7-Eleven’s retail-media network leverages loyalty data to sell targeted promotions, while Casey’s applies AI inventory models that cut stockouts and spoilage. Foodservice pivot remains key; 7-Eleven now books food as its largest U.S. category, overtaking cigarettes amid declining tobacco volumes.
White-space expansion targets rural underserved areas and urban deserts where full-line grocers exited. EV-charging integration also acts as a moat: Pilot’s coast-to-coast fast chargers attract higher-income motorists who convert to premium coffee or prepared-meal purchases. Quick-commerce platforms like DoorDash create symbiosis rather than competition by using convenience stores as dark-store nodes for 15-minute grocery delivery, importing incremental sales with no extra real estate.
Private capital accelerates change. Nouria’s Southeast move and Couche-Tard’s mega-bid spotlight the sector’s appeal amid inflation and volatile fuel demand. Cybersecurity remains an Achilles’ heel; a January 2025 payment-card breach at Gas Express, Circle K’s largest U.S. franchisee, triggered a chain-wide POS hardening initiative. Chains that master both digital resilience and operational efficiency will widen the performance gap as compliance costs rise.
Convenience Store Industry Leaders
7-Eleven (Seven & i Holdings)
Alimentation Couche-Tard (Circle K)
FamilyMart
Lawson
GS25 (GS Retail)
- *Disclaimer: Major Players sorted in no particular order
Convenience Store Market Companies Covered in this Report
- 7-Eleven
- Alimentation Couche-Tard (Circle K)
- FamilyMart
- Lawson
- GS25 (GS Retail)
- Wawa
- Casey’s General Stores
- Speedway
- QuikTrip
- Sheetz
- Cumberland Farms
- Alfamart
- Oxxo (FEMSA)
- Coop (Switzerland)
- Reitangruppen (Narvesen, 7-Eleven Nordics)
- SPAR International
- Reliance Smart Point
- CP All (7-Eleven Thailand)
- Indomaret
- Lulu Express Fresh Market

Market Opportunities and Future Outlook
Digital integration offers a practical route to increase trip frequency and attach higher-margin services. Seven & i has pursued partnership discussions involving SoftBank and PayPay to strengthen payment infrastructure and AI capabilities, reinforcing how loyalty and payments are central to personalization, fraud control, and targeted promotions in convenience retail. FamilyMart has also expanded loyalty interoperability by integrating with the Rakuten points ecosystem, illustrating how point partnerships can broaden reach without adding physical footprint.
Store-format reinvention and new revenue pillars create whitespace in dense urban markets and along mobility corridors. FamilyMart opened its FAMIMA PARK AZABUDAI flagship (under the Next FamilyMart Project) to test experiential retail and IP-based business concepts, showing operators are prototyping higher-basket missions beyond routine top-up shopping. On the mobility side, Couche-Tard has positioned eMobility, car wash, and retail media (Full Circle Media) as targeted growth areas alongside the core store platform, while large charging networks at fuel-and-convenience sites, such as Pilot Company's fast-charging footprint, show how longer dwell time can be converted into food and beverage sales when the offer is upgraded.
Recent Industry Developments in Convenience Store Market
- July 2026: FamilyMart launched the Next FamilyMart Project and opened the FAMIMA PARK AZABUDAI flagship store in Tokyo on July 10, 2026. The experiential format expansion in urban convenience stores strengthens consumer engagement and premium basket opportunities. This marks a notable push in store-level differentiation and flagship experiential assets within a crowded regional market.
- July 2026: FamilyMart - Launched the Next FamilyMart Project and opened the FAMIMA PARK AZABUDAI flagship store in Tokyo on July 10, 2026, as part of a new convenience store experience initiative. The move positions the brand at the intersection of retail innovation and immersive consumer experiences. It broadens the attraction footprint in Tokyo and signals a strategic emphasis on experiential formats.
- July 2026: GS25 (GS Retail) - Reported a 100-fold increase in cumulative K-pop album and merchandise sales compared to 2023 levels, leveraging the Our Neighborhood GS app and store network to target foreign customers and the 10s-20s demographic. The surge in cross-category merchandise drives incremental footfall and strengthens the app driven engagement model. This development highlights the value of combining digital reach with strategic in-store activations.


Convenience Store Market Report Scope and Research Methodology
Market Definition and Coverage
For this study, the market is defined as the total value of sales generated by convenience store retail formats, counted at the store level across regions, and reported in USD after consistent currency handling.
Scope exclusions: Excludes pure-play online grocery and general merchandise retail that is not operated as a convenience store format.
Segments Covered in This Report
- By Product Type
- Staple Products
- Impulse Products
- Emergency Products
- By Store Type
- Kiosks
- Mini Convenience Stores
- Limited Selection Convenience Stores
- Traditional Convenience Stores
- Expanded Convenience Stores
- Hyper Convenience Stores
- By Ownership Model
- Independent Stores
- Franchise Stores
- Corporate-Owned Chains
- By Geography
- North America
- United States
- Canada
- Mexico
- South America
- Brazil
- Argentina
- Chile
- Peru
- Rest of South America
- Europe
- United Kingdom
- Germany
- France
- Spain
- Italy
- BENELUX
- Belgium
- Netherlands
- Luxembourg
- NORDICS
- Denmark
- Finland
- Iceland
- Norway
- Sweden
- Rest of Europe
- Asia-Pacific
- China
- Japan
- India
- South Korea
- Australia
- South-East Asia
- Singapore
- Malaysia
- Thailand
- Indonesia
- Vietnam
- Philippines
- Rest of Asia-Pacific
- Middle East and Africa
- Saudi Arabia
- United Arab Emirates
- South Africa
- Nigeria
- Rest of Middle East and Africa
- North America
Data Sources, Market Sizing, and Validation
Desk Research
We first built the market boundary using widely available retail and macro datasets, and then mapped how convenience formats are counted across countries. Useful public references included sources such as the World Bank, IMF, OECD retail indicators, national statistics offices that publish retail trade indices, and customs and trade portals where packaged food and beverage flows help explain assortment shifts.
After the public baseline was set, the sizing model was supported with retailer annual reports, investor presentations, and earnings call transcripts to understand revenue mix, store expansion plans, and like-for-like sales direction. We also reviewed trade association publications and reputed press for policy changes that affect fuel retailing, tobacco rules, and food-to-go readiness. Where needed, we used paid subscriptions for company financials and news intelligence, plus patent databases to sanity-check the pace of checkout, delivery, and store automation activity. This list is illustrative, and many other sources were also used for data collection, validation, and clarification during the research process.
Primary Interviews and Surveys
To close gaps that desk research cannot answer cleanly, we conducted expert interviews and surveys with store operators, distributors, and category partners, then validated the model at a regional level. Because this is a global market, we covered demand patterns in APAC, EMEA, and the Americas so differences in fuel attachment, tobacco contribution, and food-to-go penetration were reflected in the final assumptions.
Distribution of primary research fieldwork respondents
| Company type | Respondent position | Region |
|---|---|---|
| Top tier: 29% | CXOs: 17% | APAC: 52% |
| Mid tier: 53% | Functional/Unit leaders: 37% | EMEA: 29% |
| Smaller Players: 18% | Managers: 46% | Americas: 19% |
Market-Sizing & Forecasting
The core build uses a top-down approach, where retail trade signals and country-level convenience channel shares are used to reconstruct total value by region, followed by conversion into a single USD series. To keep the result practical, the totals were checked using selective bottom-up approximations, such as rolling up sampled operator revenues, store counts, and an ASP-per-transaction view for in-store baskets where the data was available.
Key inputs included store count expansion and closures, same-store sales trends, fuel versus in-store sales mix (where fuel is attached to the format), the share of foodservice and prepared foods, inflation and wage pressure that shift ticket size, and urbanization and commuting patterns that influence trip frequency. When a country lacked clean channel splits, we applied proxy ratios from similar markets and then re-tested them with interview feedback before locking the assumption.
For the forecast, scenario analysis was used, anchored on consensus expectations for inflation normalization, consumer trade-down behavior, and planned store network additions. Growth was then stress-tested against macro paths and against observed convenience value growth patterns discussed by market participants, which helped us avoid overreacting to one-year price spikes.
Data Validation & Update Cycle
Before sign-off, outputs are triangulated across independent signals, including reported operator performance, retail indices, and region-level direction from primary conversations. Large variances are flagged, the drivers are re-checked (for example, a sudden jump caused by currency moves or an outlier fuel year), and only then does the model move to internal review.
Reports are refreshed annually, and interim adjustments are made when material events occur, such as major tax changes, sharp currency swings, or changes in how convenience formats are classified in key countries. Right before delivery, we perform a final pass so the published numbers reflect the most recent data points and validation feedback.
Mordor Intelligence's Global Convenience Store Market Size Compared Against Other Published Estimates
Published market values for convenience stores can look far apart, even when the titles sound similar, because the underlying counting rules are not the same. The biggest differences usually come from timing of currency conversion, how fuel and tobacco are treated inside store sales, and whether the estimate represents a channel view or a narrower store-format view.
When exchange rates are taken from a single month, or when inflation is applied as a blanket uplift without checking category mix, the final USD total can shift quickly. In our work, the refresh cadence matters because store networks and price points move during the year, and the model stays tied to operator updates and retail index direction through validation checks and consistent currency timing. This is the same 2026 baseline approach used by Mordor Intelligence, which can land away from older, less frequently refreshed snapshots.
Benchmark comparison
| Source | Market Size | Gaps in Research Methodology |
|---|---|---|
| Mordor Intelligence | USD 746.71 B (2026) | |
| Trade Journal A | USD 1000.00 B (2029) | Uses a channel-level convenience retail framing and reports a later-year threshold, which can blend broader formats and relies on a headline projection rather than a country-by-country rebuild. |
| Industry Commentary B | USD 1860.00 B (2024) | Appears to use a very broad definition and a higher total sales pool, with limited clarity on fuel inclusion, currency conversion timing, and how store-format boundaries are applied across countries. |
The spread in the table is mainly explained by scope boundaries and timing choices, followed by how pricing uplift is applied across categories that behave differently. By keeping inputs traceable to store networks, sales mix, and consistent USD conversion steps, we end up with a figure that clients can re-check and update as new country data comes in.


Key Questions Answered in the Report
How large is the convenience store market in 2026?
The convenience store market size stands at USD 746.71 billion in 2026, expanding toward USD 1001.62 billion by 2031 under a 6.05% CAGR.
Which product category grows fastest within convenience stores?
Emergency products show the highest momentum, projected to rise at a 9.38% CAGR through 2031 as shoppers seek crisis-ready items.
Why are hyper convenience stores gaining popularity?
Larger footprints support foodservice, wider grocery assortments, and EV charging, helping hyper formats post a 10.35% CAGR and outpace traditional boxes.
What region offers the strongest growth prospects?
Asia-Pacific leads regional expansion with an expected 8.22% CAGR, thanks to urbanization and rising disposable incomes.
How does EV charging benefit store revenue?
Stores equipped with fast charger’s report about 4% higher foot traffic and 5% higher sales because 89% of EV drivers make in-store purchases while waiting.
What is driving M&A activity in the sector?
Predictable cash flows, fragmented ownership, and synergies in fuel procurement and data analytics attract private-equity and corporate buyers alike.
Page last updated on:


 Your data is secure and never sold or shared.


