Market Overview
| Study Period | 2021 - 2031 |
|---|---|
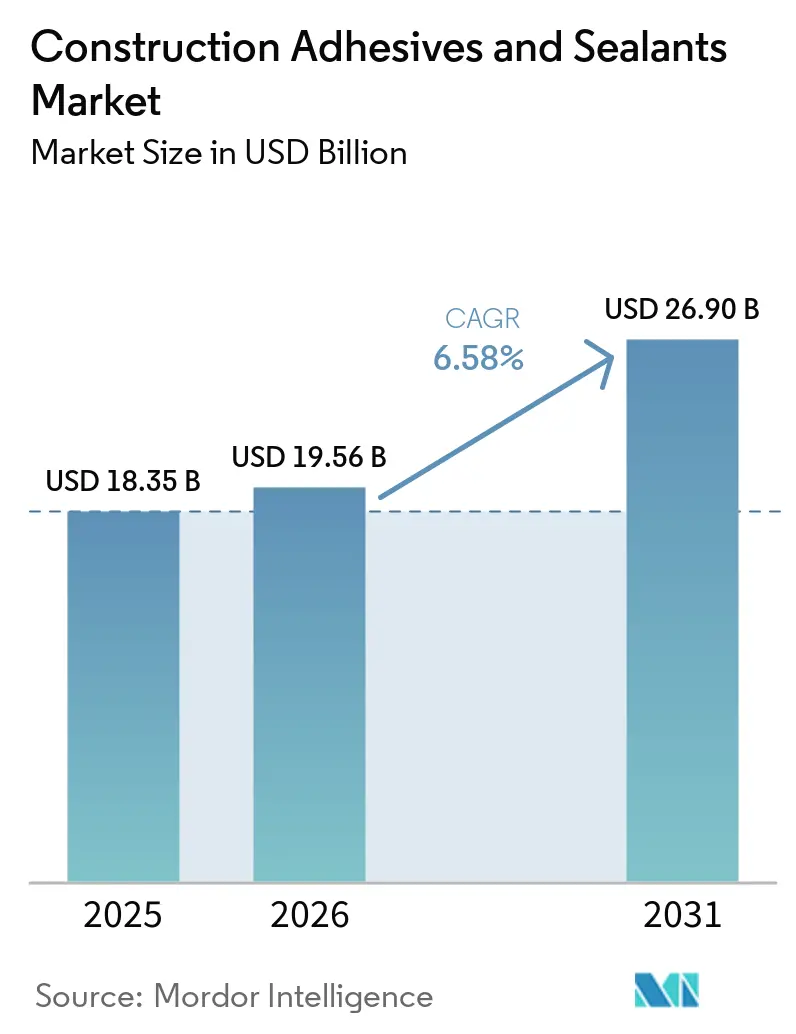
| Market Size (2026) | USD 19.56 Billion |
| Market Size (2031) | USD 26.90 Billion |
| Growth Rate (2026 - 2031) | 6.58% CAGR |
| Fastest Growing Market | Asia Pacific |
| Largest Market | Asia Pacific |
| Market Concentration | Medium |
Major Players *Disclaimer: Major Players sorted in no particular order Image © Mordor Intelligence. Reuse requires attribution under CC BY 4.0. | |
Construction Adhesives And Sealants Market Analysis by Mordor Intelligence
The Construction Adhesives & Sealants Market size is projected to be USD 18.35 billion in 2025, USD 19.56 billion in 2026, and reach USD 26.90 billion by 2031, growing at a CAGR of 6.58% from 2026 to 2031. Public-sector stimulus in the United States, the European Union, and India is channeling record capital into highways, bridges, and mass-transit projects that specify premium bonding and sealing systems, while green-building certifications such as LEED (Leadership in Energy and Environmental Design) and BREEAM (Building Research Establishment Environmental Assessment Method) tighten VOC (Volatile Organic Compound) thresholds and favor water-borne or reactive chemistries. Raw-material volatility linked to crude-oil prices is compressing margins for formulators that lack vertical integration, accelerating the shift toward bio-based polyols and recycled feedstocks. Labor shortages across developed economies are pushing contractors to adopt off-site modular methods that rely on fast-cure adhesives to maintain factory takt times. Against this backdrop, market leaders are pursuing acquisitions that extend low-VOC portfolios and deepen geographic reach, reshaping competitive dynamics in the Construction Adhesives and Sealants market.
Key Report Takeaways
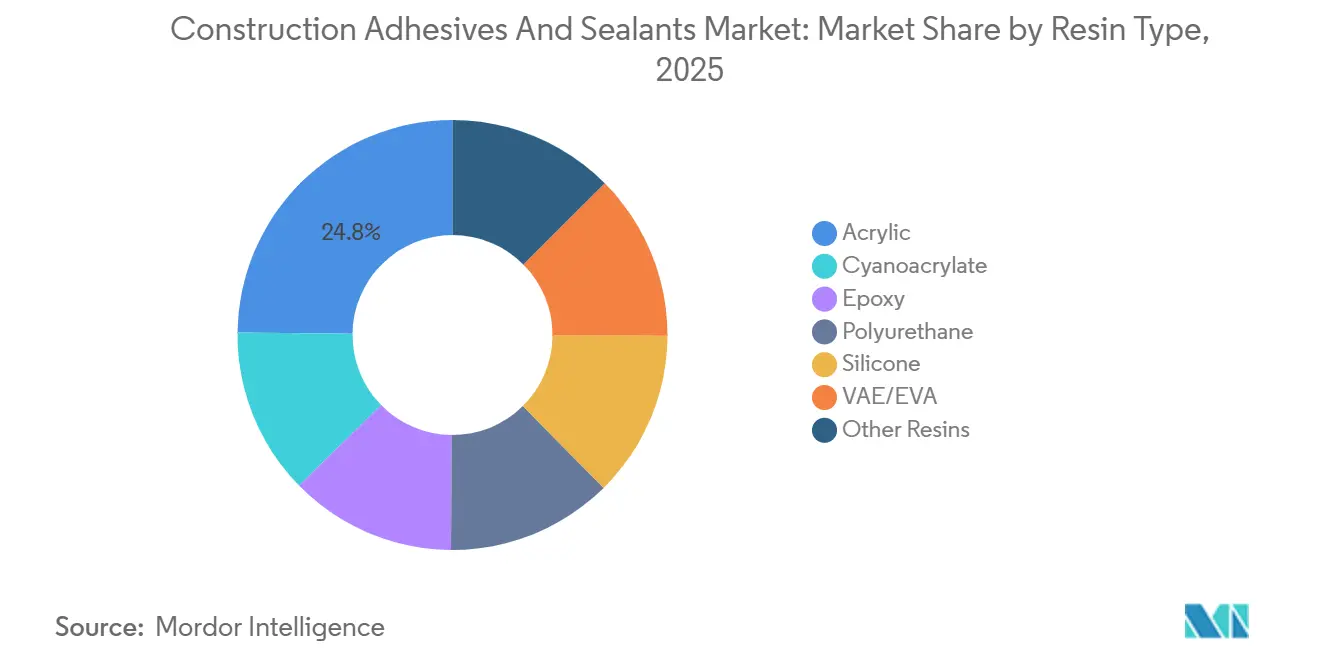
- By resin type, acrylic resins led with 24.82% of the Construction Adhesives and Sealants market share in 2025, while silicone sealants are projected to register the fastest 7.22% CAGR through 2031.
- By technology, water-borne systems accounted for 59.27% of the Construction Adhesives and Sealants market size in 2025 and are forecast to expand at a 6.75% CAGR to 2031.
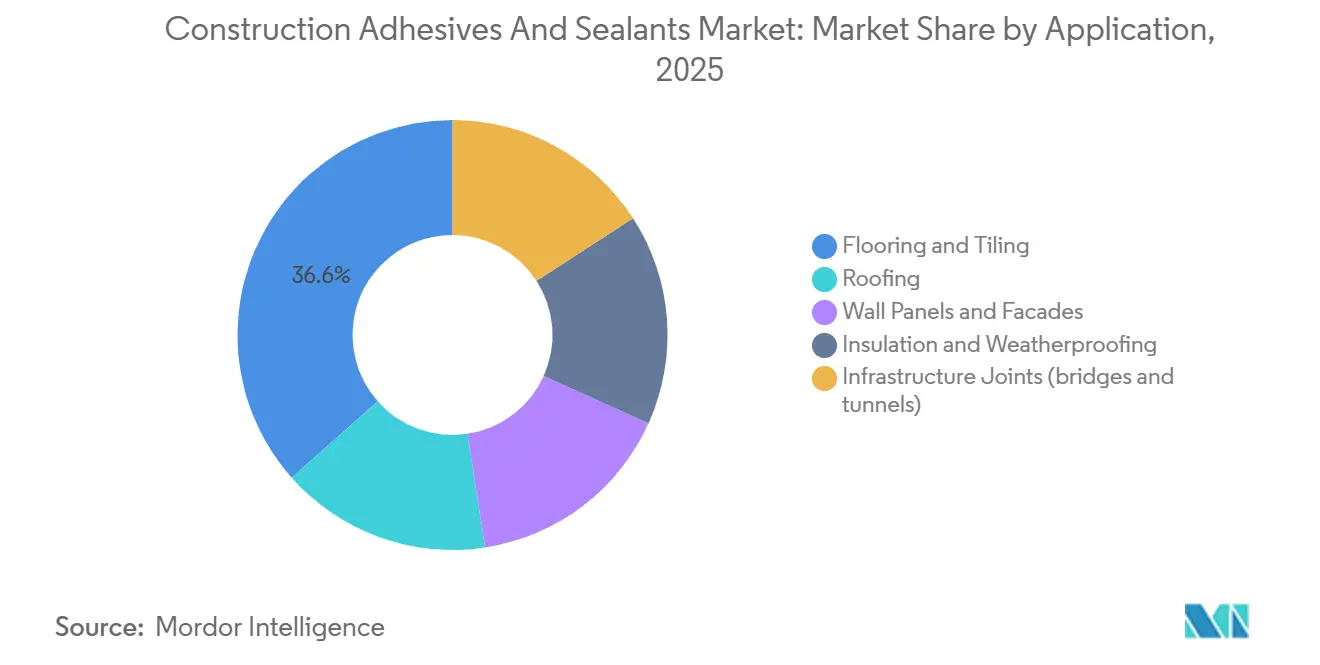
- By application, flooring and tiling captured 36.55% of demand in 2025 and are advancing at a 7.23% CAGR during the forecast period (2026-2031) on the back of the luxury-vinyl-tile boom.
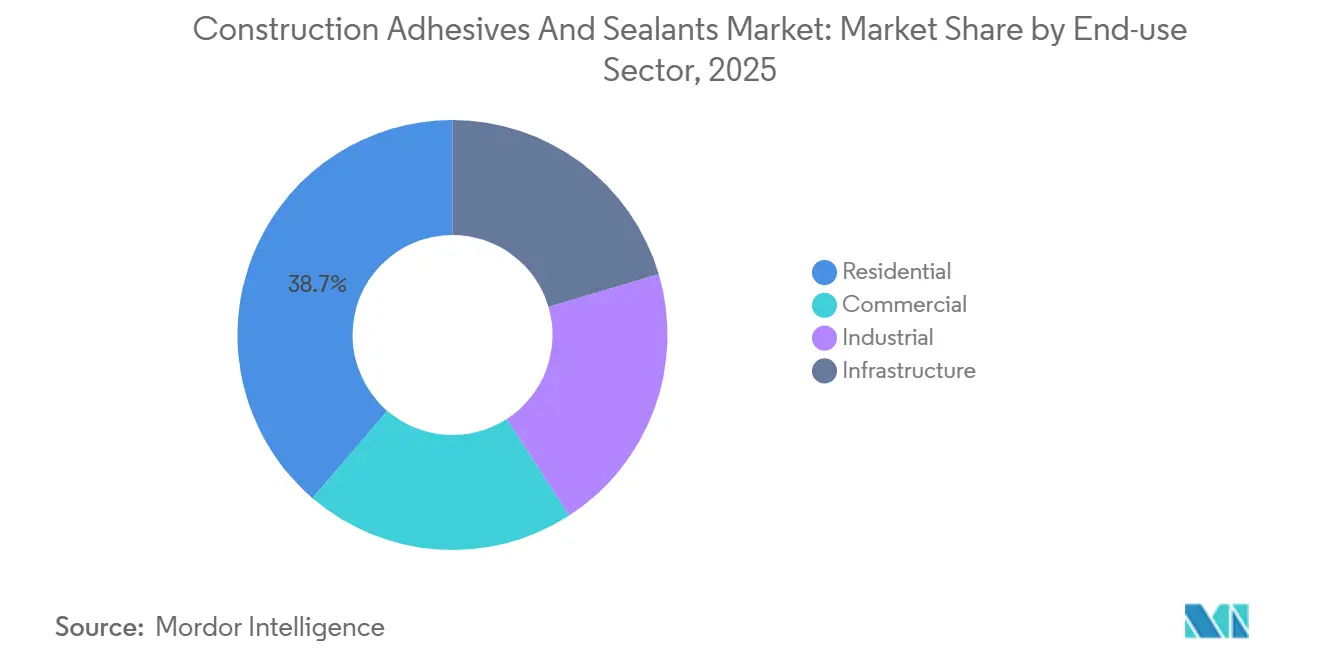
- By end-use sector, residential construction held 38.71% share of the Construction Adhesives and Sealants market size in 2025 and is climbing at a 7.40% CAGR through 2031, buoyed by rising US multifamily starts.
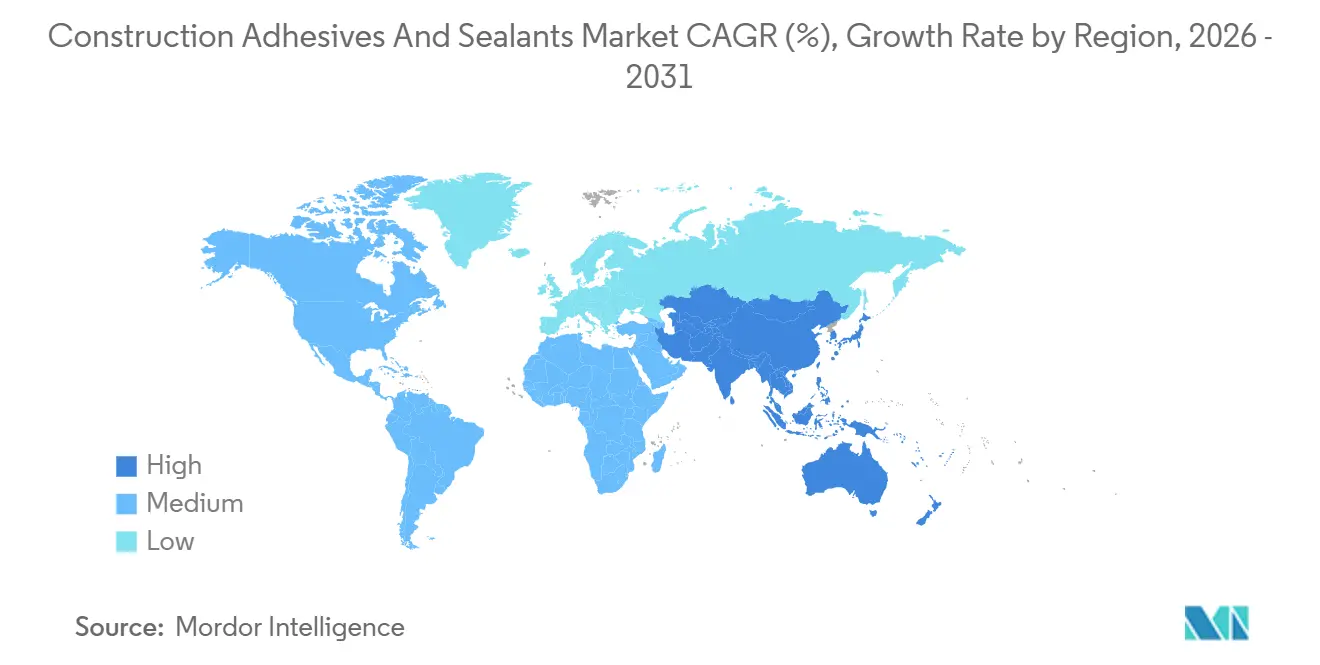
- By geography, the Asia-Pacific held a market share of 46.74% in 2025, and this share is expected to increase at a CAGR of 6.89% during the forecast period (2026-2031).
Note: Market size and forecast figures in this report are generated using Mordor Intelligence’s proprietary estimation framework, updated with the latest available data and insights as of January 2026.
Global Construction Adhesives And Sealants Market Trends and Insights
Drivers Impact Analysis*
| Driver | (~) % Impact on CAGR Forecast | Geographic Relevance | Impact Timeline |
|---|---|---|---|
| Surge in green-building certifications driving low-VOC adhesive demand | +1.2% | Global, concentrated in North America, EU, Asia-Pacific urban centers | Medium term (2-4 years) |
| Infrastructure stimulus packages in the US, EU, and India | +1.5% | North America, EU, India; spillover to Middle East and Southeast Asia | Short term (≤ 2 years) |
| Rapid uptake of off-site modular construction | +0.9% | North America, Northern Europe, Australia; emerging in Asia-Pacific | Medium term (2-4 years) |
| 3D-printed concrete requiring tailormade bonding agents | +0.3% | North America, EU, select Asia-Pacific R&D hubs | Long term (≥ 4 years) |
| Low-monomer PU prepolymers to meet indoor-air labels | +0.7% | EU, North America; expanding to Asia-Pacific | Medium term (2-4 years) |
| Smart-sensor-embedded sealants for structural-health monitoring | +0.2% | North America, EU infrastructure corridors | Long term (≥ 4 years) |
| Source: Mordor Intelligence | |||


Surge in Green-Building Certifications Driving Low-VOC Adhesive Demand
Global LEED certifications topped 110,000 projects in 2025, up 14% year over year, while BREEAM certifications surpassed 620,000 buildings, and WELL certifications tripled from 2023 levels, each mandating adhesive VOC levels well below solvent-borne thresholds[1]U.S. Green Building Council, “LEED Project Directory,” usgbc.org. California’s Rule 1168, effective mid-2025, tightened VOC caps for PVC, CPVC, and ABS cements, pushing formulators toward water-borne and reactive systems. The EU announced parallel VOC limits in Q4 2025 for mid-2026 enforcement, eliminating phthalate plasticizers such as phase-out of phthalate-based plasticizers (pCBtF) and solvents like t-butyl acetate, further shrinking the solvent palette. In response, Henkel and Sika launched joint epoxy hardener systems in March 2025, delivering 90% lower VOC emissions than incumbent products. These developments position low-VOC chemistries as the default for new commercial and institutional projects in the Construction Adhesives and Sealants market.
Infrastructure Stimulus Packages in the US, EU, and India
India’s FY 2026-27 Union Budget earmarked INR 11.21 trillion (USD 133 billion) for infrastructure, up 11.4% year over year. The Brent Spence Bridge Corridor, a USD 3.6 billion overhaul begun in early 2026, will require high-performance joint sealants and structural adhesives that meet ISO 11600 and ASTM C920 movement ratings. Across Europe, energy-efficiency retrofit mandates are driving facade-sealant demand, and Henkel’s February 2026 majority stake in Wetherby Laroc targets this renovation wave. Large public works elevate specification standards, reinforcing premium-priced formulations and lifting overall value growth in the Construction Adhesives and Sealants market.
Rapid Uptake of Off-Site Modular Construction
Factory-built modules trim on-site labor by 30-50% and compress project schedules by 20-40%, intensifying demand for hot-melt and fast-cure reactive polyurethane systems that can be metered by robots on assembly lines. U.S. construction needs an additional 499,000 workers in 2026, with 41% of the current workforce retiring by 2031, propelling contractors toward prefabrication. MAPEI’s Ultrabond ECO MS 4 LVT cures in 25 minutes and supports immediate foot traffic, matching modular takt times. Adhesive suppliers are embedding technical staff inside modular plants to finetune dispense patterns, a service model that deepens customer lock-in and raises switching costs.
3D-Printed Concrete Requiring Tailormade Bonding Agents
Interlayer bond strength in 3D-printed concrete is typically 40-60% weaker than in cast concrete, restricting structural applications. Research at Tongji University boosted bond strength by 267% using cement paste doped with 0.3% polycarboxylate superplasticizer, while strain-hardening composites delivered nearly 80% improvement. Sika and BASF are now developing polyurethane and epoxy primers that synchronize cure with printing speeds of 5-15 cm/s, eyeing a USD 50-100 million niche that could scale rapidly once building codes evolve[2]Sika AG, “New Low-Emission Hardener Technology,” sika.com.
Restraints Impact Analysis*
| Restraint | (~) % Impact on CAGR Forecast | Geographic Relevance | Impact Timeline |
|---|---|---|---|
| Crude-oil-linked raw-material price volatility | -0.8% | Global; acute in EU and Asia-Pacific import-dependent regions | Short term (≤ 2 years) |
| Tightening global VOC emission limits on solvent-borne systems | -0.5% | North America, EU; spreading to Asia-Pacific urban centers | Medium term (2-4 years) |
| Skilled-applicator shortage causing hybrid-sealant failures | -0.4% | North America, Northern Europe, Australia | Short term (≤ 2 years) |
| Bio-adhesive uptake in engineered-wood construction | -0.3% | EU, North America; emerging in Asia-Pacific | Medium term (2-4 years) |
| Source: Mordor Intelligence | |||
Crude-Oil-Linked Raw-Material Price Volatility
MDI (Methylene Diphenyl Diisocyanate) and TDI (Toluene Diisocyanate) prices climbed roughly 40% in the six months to January 2026, while polyols rose 20-30% as Brent crude rallied and European gas settled at 3-4 times baseline, slicing 5-10 percentage points from gross margins of smaller formulators. Integrated producers such as BASF hedge through captive feedstocks, yet even they flag earnings sensitivity to USD 20-30/barrel oil swings. The volatility accelerates reformulation toward soybean-oil and recycled-PET polyols, albeit at 10-15% cost premiums borne by sustainability-minded customers.
Tightening Global VOC Emission Limits on Solvent-Borne Systems
California’s Rule 1168 slashed allowable VOC-grams per liter for plastic-pipe cements, and the EU’s mid-2026 ceiling removes key plasticizers and solvents, forcing 12-18 months of field testing for new water-borne recipes. Regional producers without deep research and development budgets face portfolio rationalization or acquisition; TruArc Partners’ 2025 takeover of Matrix Adhesives and Avery Dennison’s USD 390 million purchase of Meridian’s flooring line illustrate the ongoing roll-up.
*Our forecasts treat driver/restraint impacts as directional, not additive. The impact forecasts reflect baseline growth, mix effects, and variable interactions.
Segment Analysis
By Resin Type: Silicone Sealants Outpace Legacy Chemistries
Acrylics, which held 24.82% share in 2025, remain the cost-effective choice for flooring and interior trim. Polyurethanes still dominate structural joints but face encroachment from hybrid polymers that avoid isocyanate labeling. Epoxies retain a niche in load-bearing repairs, while bio-based lignin and tannin systems occupy a sub-5% but double-digit-growth foothold. Silicone products are projected to grow at 7.22% CAGR during 2026-2031, eclipsing the broader construction adhesives & sealants market. Their ±50% movement capability and extreme-temperature resilience meet the demands of curtain-wall and weatherproofing applications in skyscrapers and stadiums. Dow’s DOWSIL 791, released in 2025, delivers VOC at 45 g/L and uses post-consumer-recycled cartridges that cut embodied carbon by 30%.
Silicone’s premium pricing is offset by 25-year warranties that reduce life-cycle cost. Architects in hot-humid geographies increasingly specify silicone over polyurethane after early failures of solvent-borne systems. Meanwhile, regulatory momentum behind low-monomer content is prompting suppliers to re-engineer polyurethane prepolymers, a step that narrows the benchmark gap with silicone but raises costs. Collectively, these shifts reinforce silicone’s climb within the Construction Adhesives and Sealants market.


By Technology: Water-Borne Systems Capture Regulatory Tailwinds
Water-borne chemistries captured 59.27% share in 2025 and are forecast to compound at 6.75% through 2031, aided by California’s Rule 1168 and the EU’s 2026 VOC ceiling. Henkel’s January 2026 deal for ATP Adhesive Systems, whose portfolio is 90% water-based, illustrates the capital pivot toward this platform. Solvent-borne lines retreat to industrial niches where cure speed overrides emissions compliance. Reactive systems, especially two-component polyurethanes and epoxies, remain essential for heavy-duty structural bonds, while hot-melts gain ground in automated modular factories.
The water-borne shift demands stainless-steel mixing tanks and climate-controlled storage, upgrades that favor large contractors and module fabricators over small firms. In return, contractors gain lower insurance premiums tied to reduced flammability and VOC exposure. These structural advantages underpin the outperformance of water-borne technology within the Construction Adhesives and Sealants market.
By Application: Flooring Adhesives Lead on LVT Boom
Flooring and tiling led demand with 36.55% share in 2025 and are set to grow at 7.23% CAGR during the forecast period (2026-2031) on surging luxury vinyl tile installations. Avery Dennison’s USD 390 million purchase of Meridian’s flooring adhesives business signals consolidation in a segment where installers pay 20-30% premiums for fast-cure, moisture-tolerant products. Bona, Bostik, Performance Accessories, Taylor, and Roberts each launched rapid-return-to-service formulas in early 2026, demonstrating the innovation tempo.
Roofing, facade, and insulation applications lean on silicone and hybrid sealants that withstand UV and thermal cycling. Large civil projects like the Brent Spence Bridge specify ASTM C920-compliant expansion-joint systems with 50-year design life, a high-margin niche shielded from low-cost entrants. Together, these factors keep flooring at the forefront of value creation in the Construction Adhesives and Sealants market.
By End-use Sector: Residential Construction Sustains Momentum
Residential construction represented 38.71% of volume in 2025 and is expanding at 7.40% CAGR for the forecast period (2026-2031) as U.S. housing starts reach 1.487 million units, with multifamily permits surging 29.1%. Adhesive intensity per home has risen to 50-70 kg as builders swap mechanical fasteners for air-sealing bonds that cut labor minutes and energy leakage. Pidilite’s INR 3 billion (USD 33.3 million) Punjab plant opened in January 2026 to serve this swelling demand with water-based tile adhesives aligned to GRIHA (Green Rating for Integrated Habitat Assessment) standards.
Commercial construction remains subdued due to office-vacancy drag, but data-center and healthcare facilities require low-outgassing, fire-rated adhesives priced at 3-5 times commodity levels. Infrastructure spending provides an anchor, with adhesive-intensive bridges, tunnels, and utilities funded by the United States, European Union, and Indian stimulus. These cross-currents keep residential, the engine of growth, inside the Construction Adhesives and Sealants market.
Geography Analysis
Asia-Pacific held only 46.74% of the Construction Adhesives and Sealants market in 2025, yet is forecast to post 6.89% CAGR to 2031. China’s residential downturn, investment down 17.2% year over year in December 2025 and prices off 40% from 2021 peaks, dampens demand. Offsetting this, India’s USD 133 billion infrastructure outlay and Southeast-Asian urbanization spur structural-sealant and waterproofing consumption. Japanese and Korean retrofits to meet energy-efficiency and seismic codes further buoy premium silicone sales, while Pidilite’s new capacity targets domestic housing growth.
North America is expanding at a nominal pace, lifted by housing-start resilience and modular construction. Henkel’s USD 30 million Brandon, Mississippi, upgrade, completed in 2025, and Sika’s USD 90 million Sealy, Texas, expansion announced in January 2026, reinforce regional capacity. The USD 3.6 billion Brent Spence Bridge illustrates how megaprojects amplify sealant requirements, while VOC rules such as Rule 1168 drive reformulations and equipment upgrades.
Europe faces energy-cost pressure yet enjoys steady renovation demand under Fit-for-55 targets. The EU’s mid-2026 VOC ceiling accelerates water-borne migration, and Henkel’s Wetherby Laroc stake positions it for facade upgrades in aging housing stock. Sika’s CHF 220 million (USD 265.54 million) purchase of Turkey-based Akkim builds a cost-efficient hub for Eastern Europe, the Middle East, and Africa. South America and the GCC (Gulf Cooperation Council) add incremental growth via residential expansion and infrastructure corridors exposed to extreme climates that need high-performance sealants.

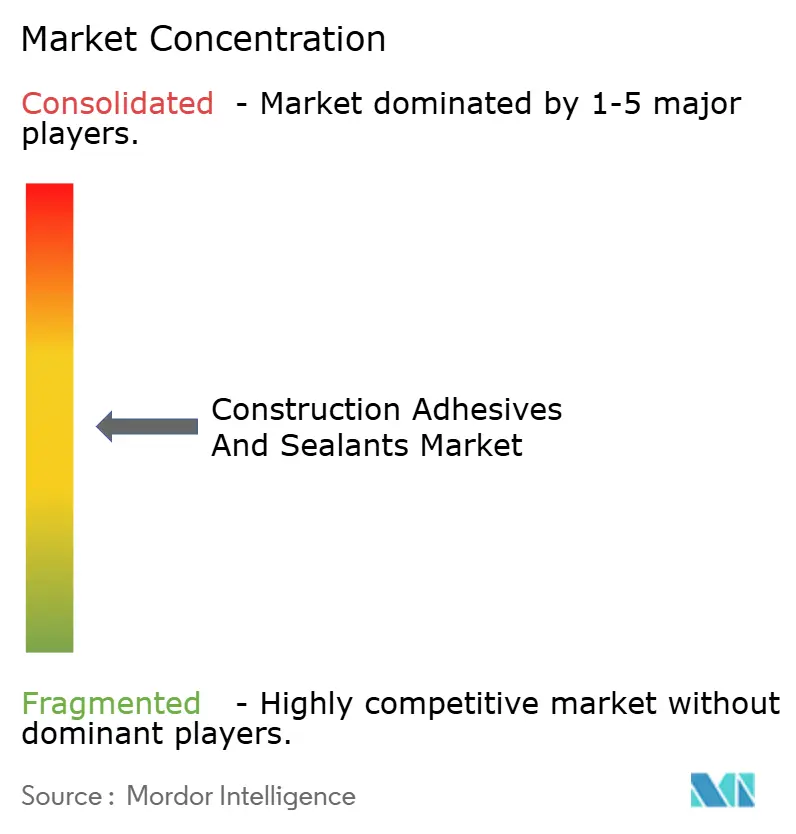
Competitive Landscape
The Construction Adhesives and Sealants market is moderately concentrated. Regional challengers such as Astral Adhesives in India and Soudal in Belgium are capturing share through localized formulations and rapid service, fragmenting lower-price residential channels even as majors consolidate higher-spec segments. Compliance with GEV Emicode, ISO 11600, and regional VOC limits is emerging as a moat that raises the cost of entry and tilts the advantage toward well-capitalized innovators.
Construction Adhesives And Sealants Industry Leaders
Henkel AG & Co. KGaA
Sika AG
Arkema
H.B. Fuller Company
3M
- *Disclaimer: Major Players sorted in no particular order

Recent Industry Developments
- October 2025: Bostik, Inc., a member of the Arkema Group of companies, introduced OB1 Multi-Surface Construction Sealant and Adhesive to the United States market. This product is a universal sealant and adhesive designed to simplify installations by replacing multiple products with one powerful solution.
- July 2025: TEX YEAR INDUSTRIES INC. opened and launched Asia’s first biodegradable hot melt adhesive dedicated production line, along with the newly established Innovation Building, a dedicated research and development and production facility at its Tex Year Taoyuan factory.


Global Construction Adhesives And Sealants Market Report Scope
Adhesives are substances that join or bond two or more surfaces together by sticking to them. They are a type of material that provides cohesion between different substrates, creating a durable and often permanent bond. Adhesives are used in various applications, from everyday household use to industrial and technological processes.
Sealants are materials used to fill, seal, or close gaps and joints to prevent the passage of liquids or gases. They are designed to provide a barrier against moisture, air, dust, and other environmental elements. Sealants are commonly used in construction, automotive, aerospace, and other industries to create airtight and watertight seals and provide insulation and protection.
The Construction Adhesives and Sealants market is segmented by resin type, technology, application, end-use sector, and geography. By resin type, the market is segmented into acrylic, cyanoacrylate, epoxy, polyurethane, silicone, VAE/EVA, and other resins. By technology, the market is segmented into water-borne, solvent-borne, reactive, hot-melt, and sealants (1K and 2K). By application, the market is segmented into flooring and tiling, roofing, wall panels and facades, insulation and weatherproofing, and infrastructure joints (bridges and tunnels). By end-use sector, the market is segmented into residential, commercial, industrial, and infrastructure. The report also covers the market size and forecasts for construction adhesives and sealants in 23 countries across major regions. The market sizes and forecasts are provided in terms of value (USD).
By Resin Type
| Acrylic |
| Cyanoacrylate |
| Epoxy |
| Polyurethane |
| Silicone |
| VAE/EVA |
| Other Resins |
By Technology
| Water-borne |
| Solvent-borne |
| Reactive |
| Hot-melt |
| Sealants (1K and 2K) |
By Application
| Flooring and Tiling |
| Roofing |
| Wall Panels and Facades |
| Insulation and Weatherproofing |
| Infrastructure Joints (bridges and tunnels) |
By End-use Sector
| Residential |
| Commercial |
| Industrial |
| Infrastructure |
By Geography
| Asia-Pacific | China |
| Japan | |
| India | |
| South Korea | |
| Indonesia | |
| Australia | |
| Malaysia | |
| Thailand | |
| Singapore | |
| Rest of Asia-Pacific | |
| North America | United States |
| Canada | |
| Mexico | |
| Europe | Germany |
| France | |
| Italy | |
| Spain | |
| United Kingdom | |
| Russia | |
| Rest of Europe | |
| South America | Brazil |
| Argentina | |
| Rest of South America | |
| Middle East and Africa | Saudi Arabia |
| United Arab Emirates | |
| South Africa | |
| Rest of Middle East and Africa |
| By Resin Type | Acrylic | |
| Cyanoacrylate | ||
| Epoxy | ||
| Polyurethane | ||
| Silicone | ||
| VAE/EVA | ||
| Other Resins | ||
| By Technology | Water-borne | |
| Solvent-borne | ||
| Reactive | ||
| Hot-melt | ||
| Sealants (1K and 2K) | ||
| By Application | Flooring and Tiling | |
| Roofing | ||
| Wall Panels and Facades | ||
| Insulation and Weatherproofing | ||
| Infrastructure Joints (bridges and tunnels) | ||
| By End-use Sector | Residential | |
| Commercial | ||
| Industrial | ||
| Infrastructure | ||
| By Geography | Asia-Pacific | China |
| Japan | ||
| India | ||
| South Korea | ||
| Indonesia | ||
| Australia | ||
| Malaysia | ||
| Thailand | ||
| Singapore | ||
| Rest of Asia-Pacific | ||
| North America | United States | |
| Canada | ||
| Mexico | ||
| Europe | Germany | |
| France | ||
| Italy | ||
| Spain | ||
| United Kingdom | ||
| Russia | ||
| Rest of Europe | ||
| South America | Brazil | |
| Argentina | ||
| Rest of South America | ||
| Middle East and Africa | Saudi Arabia | |
| United Arab Emirates | ||
| South Africa | ||
| Rest of Middle East and Africa | ||


Market Definition
- End-user Industry - Residential construction, commercial construction, public buildings, industrial buildings and infrastructure projects are considered under the construction industry.
- Product - All adhesive and sealant products used in construction industry are considered in the market studied
- Resin - Under the scope of the study, resins like Polyurethane, Epoxy, Acrylic, Cyanoacrylate, VAE/EVA, and Silicone are considered
- Technology - For the purpose of this study, Water-borne, Solvent-borne, Reactive, Hot Melt, and Sealants technologies are taken into consideration.
| Keyword | Definition |
|---|---|
| Hot-melt Adhesive | Hot melt adhesives are generally 100% solid formulations, based on thermoplastic polymers. They are solid at room temperature and are activated upon heating above their softening point, at which stage they are liquid, and hence, can be processed. |
| Reactive Adhesive | A reactive adhesive is made up of monomers that react in the adhesive curing process and do not evaporate from the film during use. Instead, these volatile components become chemically incorporated into the adhesive. |
| Solvent-borne Adhesive | Solvent-borne adhesives are mixtures of solvents and thermoplastic, or slightly cross-linked polymers, such as polychloroprene, polyurethane, acrylic, silicone, and natural and synthetic rubbers (elastomers). |
| Water-borne Adhesive | Water-borne adhesives use water as a carrier or diluting medium to disperse a resin. They are set by allowing the water to evaporate or be absorbed by the substrate. These adhesives are compounded with water as a diluent, rather than a volatile organic solvent. |
| UV Cured Adhesive | UV curing adhesives induce curing and create a permanent bond without heating by using ultraviolet (UV) light or other radiation sources. An aggregation of monomers and oligomers is cured or polymerized by ultraviolet (UV) or visible light in a UV adhesive. Because UV is a radiating energy source, UV adhesives are often referred to as radiation curing or rad-cure adhesives. |
| Heat-resistant Adhesive | Heat-resistant Adhesives refer to those that do not break down under high temperatures. One aspect of a complicated system of circumstances is the adhesive's capacity to withstand disintegration brought on by high temperatures. As the temperature rises, adhesives may liquefy. They can withstand stresses resulting from differing coefficients of expansion and contraction, which might be an additional advantage. |
| Reshoring | Reshoring is the practice of moving commodity production and manufacturing back to the nation where the business was founded. Onshoring, inshoring, and back shoring are further terms used. Offshoring, the practice of producing items abroad to lower labor and manufacturing costs, is the opposite of this. |
| Oleochemicals | Oleochemicals are compounds produced from biological oils or fats. They resemble petrochemicals, which are substances made from petroleum. The oleochemical business is built on the hydrolysis of oils or fats. |
| Nonporous Materials | Nonporous materials are substances that do not permit the passage of liquid or air. Nonporous materials are those that are not porous, such as glass, plastic, metal, and varnished wood. Since no air can get through, less airflow is required to raise these materials, negating the requirement for high airflow. |
| EU-Vietnam Free Trade Agreement | A trade agreement and an investment protection agreement were concluded between the European Union and Vietnam on June 30, 2019. |
| VOC content | Compounds with limited solubility in water and high vapor pressure are known as Volatile Organic Compounds (VOCs). Many VOCs are human-made chemicals that are used and produced in the manufacture of paints, pharmaceuticals, and refrigerants. |
| Emulsion Polymerization | Emulsion polymerization is a method of producing polymers or connected groups of smaller chemical chains known as monomers, in a water solution. The method is often used to make water-based paints, adhesives, and varnishes, in which the water stays with the polymer and is marketed as a liquid product. |
| 2025 National Packaging Targets | In 2018, the Australian Environment Ministry set the following 2025 National Packaging Targets: 100% of the packaging must be reusable, recyclable, or compostable by 2025, 70% of plastic packaging must be recycled or composted by 2025, 50% of average recycled content must be included in packaging by 2025, and problematic and unnecessary single-use plastic packaging must be phased out by 2025. |
| Russian Government’s Import Substitution Policy | The Western sanctions suspended the distribution of several high-tech items to Russia, including those required by the raw material export sectors and the military-industrial complex. In response, the government launched an "import substitution" scheme, appointing a special commission to oversee its implementation in early 2015. |
| Paper Substrate | Paper substrates are paper sheets, reels, or boards with a base weight of up to 400 g/m2 that has not been converted, printed or otherwise altered. |
| Insulation Material | A material that inhibits or blocks heat, sound, or electrical transmission is known as Insulation Material. The variety of insulation materials includes thick fibers like fiberglass, rock and slag wool, cellulose, and natural fibers as well as stiff foam boards and sleek foils. |
| Thermal Shock | A temperature change known as thermal shock generates stress in a material. It commonly results in material breakdown and is especially prevalent in brittle materials like ceramics. When there is a quick temperature change, either from hot to cold or vice versa, this process occurs abruptly. It occurs more frequently in materials with poor heat conductivity and insufficient structural integrity. |


Research Methodology
Mordor Intelligence follows a four-step methodology in all our reports.
- Step-1: Identify Key Variables: The quantifiable key variables (industry and extraneous) pertaining to the specific product segment and country are selected from a group of relevant variables & factors based on desk research & literature review; along with primary expert inputs. These variables are further confirmed through regression modeling (wherever required).
- Step-2: Build a Market Model: In order to build a robust forecasting methodology, the variables and factors identified in Step-1 are tested against available historical market numbers. Through an iterative process, the variables required for market forecast are set and the model is built on the basis of these variables.
- Step-3: Validate and Finalize: In this important step, all market numbers, variables and analyst calls are validated through an extensive network of primary research experts from the market studied. The respondents are selected across levels and functions to generate a holistic picture of the market studied.
- Step-4: Research Outputs: Syndicated Reports, Custom Consulting Assignments, Databases & Subscription Platforms


