Aerospace Adhesives & Sealants Market Size and Share
Market Overview
| Study Period | 2017 - 2028 |
|---|---|
| Forecast Data Period | 2024 - 2028 |
| Historical Data Period | 2017 - 2022 |
| Market Size (2024) | USD 1.18 Billion |
| Market Size (2028) | USD 1.44 Billion |
| Growth Rate (2024 - 2028) | 5.14% CAGR |
| Market Concentration | Medium |
Major Players*Disclaimer: Major Players sorted in no particular order Image © Mordor Intelligence. Reuse requires attribution under CC BY 4.0. | |

Aerospace Adhesives & Sealants Market Analysis by Mordor Intelligence
The Aerospace Adhesives & Sealants Market size is estimated at 1.18 billion USD in 2024, and is expected to reach 1.44 billion USD by 2028, growing at a CAGR of 5.14% during the forecast period (2024-2028).
The aerospace adhesives and sealants industry is experiencing significant transformation driven by technological advancements and sustainability initiatives. The industry's landscape is characterized by a robust presence in Europe, home to over 3,000 companies employing more than 880,000 professionals across the aerospace sector. This extensive industrial base has fostered innovation in adhesive technologies, particularly in developing advanced bonding solutions for both civil and military applications. The sector's evolution is further shaped by stringent environmental regulations and the increasing focus on sustainable manufacturing practices, pushing manufacturers to develop eco-friendly adhesive solutions.
The industry is witnessing a remarkable shift towards lightweight construction and advanced material applications. Epoxy-based aerospace adhesives have emerged as a cornerstone technology, offering exceptional structural properties with tensile strength reaching up to 12,000 psi (82 MPa), making them ideal for critical applications in both interior and exterior aircraft components. These advanced adhesives are revolutionizing aircraft assembly processes, enabling the construction of more efficient and durable structures while maintaining the highest safety standards. The integration of these high-performance adhesives has become crucial in modern aircraft design, particularly in sandwich panels, fuselage construction, and honeycomb structures.
A significant industry trend is the increasing emphasis on fuel efficiency and operational cost reduction through innovative bonding solutions. The adoption of advanced aerospace sealants and adhesives has contributed to a remarkable reduction in airline fuel costs, with expenditures decreasing by approximately 40% over the past decade. This achievement is largely attributed to the replacement of traditional mechanical fasteners with lightweight adhesive solutions, enabling the construction of lighter aircraft while maintaining structural integrity. The industry's focus has shifted towards developing adhesives that not only reduce weight but also enhance the overall performance and longevity of aircraft components.
The market is experiencing a profound transformation in manufacturing processes and application technologies. UV-cured aerospace adhesives and sealants have gained prominence due to their precision application capabilities and rapid curing properties, making them particularly valuable in aerospace manufacturing. The industry is also witnessing increased investment in research and development, focusing on developing adhesives with improved temperature resistance, chemical compatibility, and durability. These advancements are complemented by the growing adoption of automated application systems and quality control measures, ensuring consistent performance and reliability in aerospace applications.
Note: Market size and forecast figures in this report are generated using Mordor Intelligence’s proprietary estimation framework, updated with the latest available data and insights as of January 2026.
Global Aerospace Adhesives & Sealants Market Trends and Insights
Rapid growth of civil and military aviation will boost the aircraft production
- The global aerospace industry is largely dominated by North America, Asia-Pacific, and Europe. The United States is both a global and regional leader in the aerospace industry due to its design, development, and production capabilities of technologically sophisticated aircraft, space systems, and military aircraft. In 2021, a total of around 1,956 units of aircraft, including civil, general, and military, were delivered to the country, compared to 1,807 units in 2020. It is forecast that the country may need 2,269 units of aircraft by 2028.
- In the Asia-Pacific region, China is the largest and fastest-growing market for civil aerospace and aviation services. In 2021, the country experienced a decline in aircraft deliveries, registering around 264 units of total aircraft in civil, general, and military, compared to 367 units delivered in 2020. However, it is forecast to recover and reach 969 units in 2028.
- In Europe, Germany has one of the largest aerospace industries, with the presence of original equipment manufacturers (OEMs), Tier I suppliers, and systems integrators. In 2021, the country saw an increase in aircraft deliveries, amounting to around 138 units of total aircraft in civil, general, and military, compared to 98 units in 2020. The market is projected to reach 262 units in 2028. In 2021, the aerospace industry's revenue stood at EUR 31.4 billion. In 2020 and 2021, civil aviation was the highest revenue-generating sector, amounting to around EUR 22 billion in both years, compared to EUR 32 billion in 2019. However, the market is not expected to recover until 2024-2025.
- All the abovementioned factors are expected to impact the global aerospace industry during the forecast period.


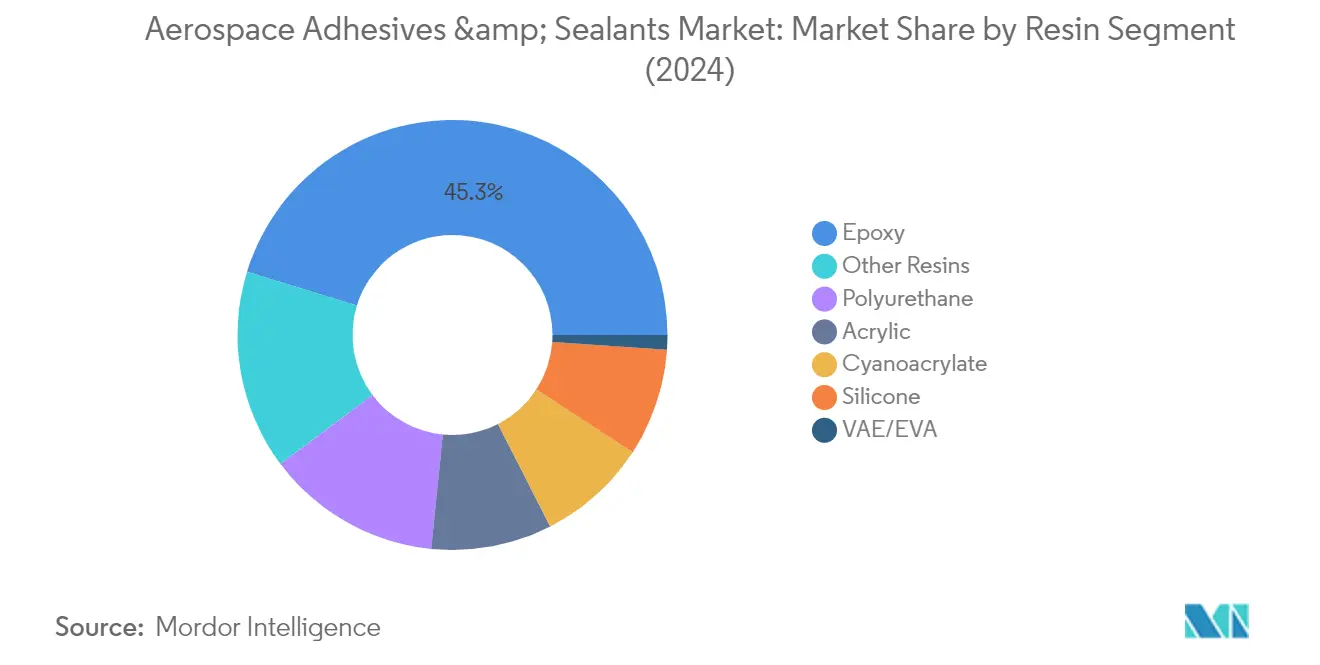
Segment Analysis: Resin
Epoxy Segment in Aerospace Adhesives & Sealants Market
Epoxy resin dominates the aerospace adhesives and aerospace sealants market, commanding approximately 45% market share in 2024. The segment's leadership position is attributed to its superior structural properties and excellent adhesion to various substrates, including metals, composites, and plastics. Aerospace epoxy adhesives demonstrate high strength and low shrinkage during curing, making them ideal for critical aerospace applications. These adhesives offer exceptional resistance to chemicals and environmental damage, while providing superior electrical insulation properties. With tensile strength reaching up to 55 N/mm2 (8000 psi), epoxy adhesives are extensively used in aircraft electronics, optical fiber systems, braking systems, and numerous other structural applications where precision and reliability are paramount.

Cyanoacrylate Segment in Aerospace Adhesives & Sealants Market
The cyanoacrylate segment is experiencing rapid growth in the aerospace adhesives and sealants market, with an expected growth rate of approximately 7% during 2024-2029. This impressive growth is driven by cyanoacrylate's unique properties, particularly its fast curing times and versatility in bonding various substrates. These adhesives require minimal application amounts to form strong bonds between metals, glass, and polymers, with bonds strengthening within 10 minutes of application and achieving full solidification within 24 hours. The segment's growth is further supported by its effectiveness in aircraft wing spar bonding, repairing damaged interior trims, sign bonding, and various small repair applications, making it increasingly popular in both manufacturing and maintenance operations.
Remaining Segments in Aerospace Adhesives & Sealants Market by Resin
The aerospace adhesives and sealants market features several other significant resin segments, each serving specific applications. Polyurethane adhesives are valued for their flexibility and effectiveness in non-structural applications, from interior components to exterior parts. Silicone-based products excel in high-temperature applications and provide excellent flexibility and vibration resistance. Acrylic adhesives offer improved temperature range and solvent resistance compared to conventional options. VAE/EVA adhesives, while having a smaller market share, are preferred for specific interior applications due to their cost-effectiveness and temperature resistance. Other specialty resins, including rubber adhesives and polysulfide sealants, continue to play crucial roles in specialized aerospace applications where specific performance characteristics are required.
Segment Analysis: Technology
UV Cured Adhesives Segment in Aerospace Adhesives & Sealants Market
UV-cured adhesives technology dominates the aerospace adhesives and sealants market, commanding approximately 35% market share in 2024. This segment's leadership position is attributed to its precision and high-strength bonding capabilities that fulfill the exact requirements of aircraft manufacturers. UV-cured adhesives utilize only one component, eliminating pot-life problems and simplifying production schedules. These adhesives are 100% reactive with no volatile losses during curing, making the process non-polluting. The technology's success stems from its unique activation properties, triggered only when exposed to UV light of 250 to 350 nm wavelength. The segment's growth is driven by its superior properties including precision bonding, high viscosity of up to 17 Pa.s, and broad application temperature range.
Remaining Segments in Technology
The aerospace adhesives and sealants market encompasses several other significant technology segments including solvent-borne, reactive, sealants, hot melt, and water-borne adhesives. Solvent-borne adhesives represent the second-largest segment, particularly valued for their structural applications and high shear strength properties. Reactive adhesives are preferred for heavy loads requiring high strength adherence and durability. Sealants play a crucial role in fuel tank sealing and assembly weight reduction. Hot melt adhesives offer advantages in thermal stability and rapid setting capabilities. Water-borne adhesives, while representing a smaller share, are gaining attention for their eco-friendly properties and low VOC emissions, particularly in aircraft assembly and interior applications.
Aerospace Adhesives & Sealants Market Geography Segment Analysis
Aerospace Adhesives & Sealants Market in Asia-Pacific
The Asia-Pacific region represents a dynamic aerospace adhesives and sealants market, characterized by diverse manufacturing capabilities and growing aviation infrastructure. Countries like China, Japan, and South Korea have established themselves as major manufacturing hubs, while emerging economies such as India and Indonesia are rapidly developing their aerospace capabilities. The region benefits from increasing investments in both civil and military aviation sectors, with a significant focus on domestic aircraft production and maintenance, repair, and overhaul (MRO) operations.
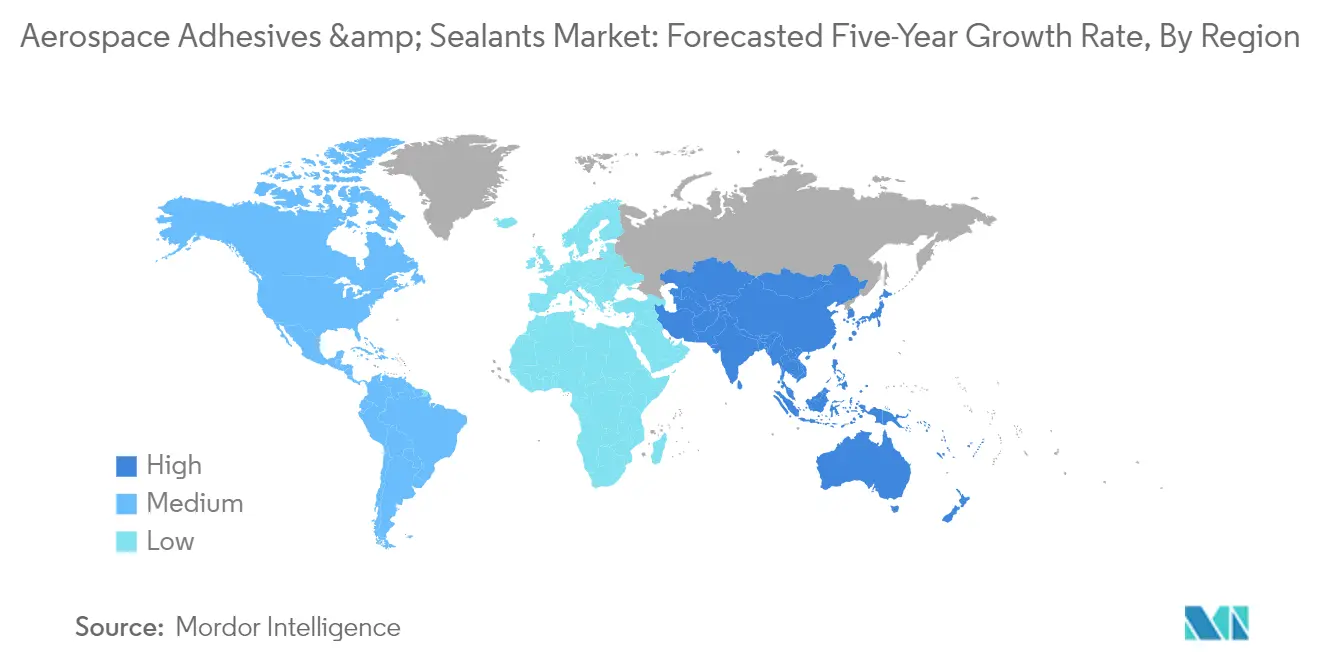
Aerospace Adhesives & Sealants Market in China
China dominates the Asia-Pacific aerospace adhesives and sealants market, holding approximately 40% share of the regional market in 2024. The country's aerospace industry ranks second globally, with extensive local aircraft manufacturing facilities and maintenance capabilities. The Aviation Industry Corporation of China (AVIC), with over 100 subsidiaries and 450,000 employees, leads the domestic manufacturing sector. China's aerospace sector benefits from strong government support through initiatives aimed at developing indigenous aircraft manufacturing capabilities and reducing dependence on imports.
Aerospace Adhesives & Sealants Market in India
India emerges as the fastest-growing market in the Asia-Pacific region, with a projected growth rate of approximately 9% during 2024-2029. The country's aerospace sector is witnessing significant transformation through initiatives like Make in India and policy reforms such as the Defence Procurement Procedure. Private industry participation has increased, with major corporate houses like Tata, Mahindra, L&T, and Godrej entering the aerospace manufacturing sector. The country's growing domestic aviation market and increasing focus on indigenous aircraft production are driving the demand for aerospace adhesives and sealants.
Aerospace Adhesives & Sealants Market in Europe
Europe maintains a strong position in the global aerospace adhesives and sealants market, supported by its well-established aerospace manufacturing ecosystem. The region hosts over 3,000 aerospace companies employing more than 880,000 people, with major concentrations in France, Germany, Italy, Spain, and the United Kingdom. The European aerospace industry excels in both civil and military aircraft production, with significant expertise in helicopter manufacturing and advanced aerospace components.
Aerospace Adhesives & Sealants Market in Germany
Germany leads the European market, commanding approximately 35% of the regional market share in 2024. The country's aerospace industry ranks among the top three in Europe, with significant investment in research and development, spending around EUR 2.5 billion annually. German aerospace manufacturers maintain strong international partnerships, with over 72% of their products being exported, particularly to France and other European nations.
Aerospace Adhesives & Sealants Market in Russia
Russia represents the fastest-growing market in Europe, with an expected growth rate of approximately 6% during 2024-2029. The country's aerospace sector is undergoing significant transformation with new developments in both civil and military aviation. The introduction of new aircraft programs and the modernization of existing fleets are driving the demand for commercial aviation adhesives. The country's focus on developing domestic aircraft manufacturing capabilities and reducing dependence on Western imports is creating new opportunities in the market.
Aerospace Adhesives & Sealants Market in Middle East & Africa
The Middle East & Africa region presents a growing market for aerospace adhesives and sealants, driven by expanding aviation infrastructure and increasing investments in both civil and military aerospace sectors. The region's strategic location as a global aviation hub has led to significant development in maintenance, repair, and overhaul (MRO) facilities, particularly in the Gulf region.
Aerospace Adhesives & Sealants Market in Saudi Arabia
Saudi Arabia leads the Middle East & Africa market, with the largest aerospace industry in the region. The country's aviation sector represents a significant contributor to its GDP, with substantial investments in fleet expansion and maintenance facilities. The government's focus on developing domestic aerospace capabilities and expanding international routes has strengthened the country's position in the regional market.
Aerospace Adhesives & Sealants Market in South Africa
South Africa emerges as the fastest-growing market in the Middle East & Africa region. The country's aerospace industry, ranking among the top 40 globally, benefits from strong government-private partnerships and collaboration with research universities. South Africa's position as a major supplier base for international aerospace manufacturers and its growing maintenance, repair, and overhaul (MRO) capabilities are driving market growth.
Aerospace Adhesives & Sealants Market in North America
North America represents a dominant force in the global aerospace adhesives and sealants market, with advanced manufacturing capabilities and extensive research and development infrastructure. The region's aerospace industry faces increasing pressure for decarbonization, driving innovation in adhesive technologies. The United States leads the regional market and shows the fastest growth, supported by its position as the world's largest aerospace industry. The presence of major manufacturers like Boeing, Lockheed Martin, and Gulfstream Aerospace, combined with extensive MRO operations, maintains the region's market leadership. Canada and Mexico contribute significantly through their integrated supply chains and growing aerospace manufacturing capabilities.
Aerospace Adhesives & Sealants Market in South America
The South American aerospace interior adhesives market is experiencing significant growth, driven by the emergence of low-budget airlines and increasing air travel accessibility for the middle class. Brazil dominates the regional market and shows the fastest growth rate, supported by its position as the fifth-largest aerospace industry globally. The country's strong manufacturing base, led by companies like Embraer, and its growing maintenance, repair, and overhaul (MRO) sector contribute to market expansion. Argentina and other South American countries are also developing their aerospace capabilities, focusing on both civil and military aviation sectors.

Competitive Landscape
Top Companies in Aerospace Adhesives & Sealants Market
The leading companies in the aerospace adhesives & sealants market are focusing on various strategic initiatives to maintain their competitive edge. Product innovation remains a key trend, with manufacturers developing advanced adhesive solutions that offer improved bonding strength, temperature resistance, and lightweight properties for modern aircraft applications. Companies are investing heavily in research and development to create flame-retardant products and environmentally sustainable solutions that comply with stringent aviation standards. Operational agility has become crucial, with manufacturers establishing robust global supply chains and distribution networks to serve major aerospace hubs worldwide. Strategic partnerships with aircraft manufacturers and maintenance, repair, and overhaul (MRO) service providers have become increasingly important for market penetration. Companies are also expanding their manufacturing footprint in emerging aerospace markets, particularly in Asia-Pacific, to capitalize on the growing demand and establish a stronger regional presence.
Consolidated Market Led By Global Players
The aviation adhesives and sealants market exhibits a highly consolidated structure, with the top five companies commanding a significant market share. These market leaders are predominantly global chemical conglomerates with diverse product portfolios and strong technological capabilities. These companies leverage their extensive research facilities, established relationships with aerospace OEMs, and global manufacturing networks to maintain their market positions. The market is characterized by high entry barriers due to stringent quality requirements, extensive certification processes, and the need for long-term relationships with aerospace manufacturers.
The industry has witnessed strategic acquisitions and partnerships aimed at expanding product portfolios and geographical reach. Major players are acquiring specialized adhesive manufacturers to enhance their technological capabilities and gain access to proprietary formulations. Regional players are forming strategic alliances with global companies to strengthen their market presence and access advanced technologies. The market also sees collaboration between adhesive manufacturers and aerospace companies for developing customized solutions for specific applications, creating strong competitive advantages through product differentiation.
Innovation and Sustainability Drive Future Success
For incumbent companies to maintain and expand their market share, focusing on technological innovation and sustainable solutions will be crucial. Developing eco-friendly adhesives with reduced volatile organic compounds while maintaining high performance standards will become increasingly important as environmental regulations become stricter. Companies need to invest in digital technologies for smart manufacturing and quality control to meet the precise requirements of aerospace applications. Building strong technical support teams and offering comprehensive service packages, including product customization and application support, will help maintain customer loyalty and differentiate offerings in the market.
New entrants and smaller players can gain ground by focusing on specialized market segments and developing innovative solutions for specific applications. Establishing strong relationships with regional aerospace manufacturers and MRO service providers can provide a foundation for market expansion. Companies need to consider the high concentration of aerospace manufacturers and the critical nature of adhesive applications in aircraft safety when developing their market strategies. While substitution risk from alternative joining technologies exists, the increasing focus on lightweight materials and fuel efficiency in aircraft design continues to favor adhesive solutions. Success in this market will increasingly depend on the ability to meet evolving regulatory requirements, particularly regarding environmental impact and safety standards. Aerospace adhesive manufacturers and aerospace adhesives suppliers must navigate these challenges to thrive in the competitive landscape.
Aerospace Adhesives & Sealants Industry Leaders
3M
H.B. Fuller Company
Henkel AG & Co. KGaA
Huntsman International LLC
PPG Industries, Inc.
- *Disclaimer: Major Players sorted in no particular order


Recent Industry Developments
- April 2022: Master Bond innovated a one-component silver-filled epoxy that meets NASA's Low Outgassing Requirements, Master Bond EP4S-80. It is used for bonding, sealing, filling, and encapsulating EMI/RFI shielding and static dissipation applications where electrical conductivity is required.
- March 2022: Bostik signed an agreement with DGE for distribution throughout Europe, Middle East & Africa. The agreement includes Born2BondTM engineering adhesives developed for 'by-the-dot' bonding applications in specific industries, such as automotive, electronics, luxury packaging, medical devices, and MRO.
- January 2022: Master Bond introduced Master Bond EP21AC, a two-part epoxy with a non-halogenated filler for arc resistance and flame retardancy required applications in military-aerospace electronic devices.


Global Aerospace Adhesives & Sealants Market Report Scope
Acrylic, Cyanoacrylate, Epoxy, Polyurethane, Silicone, VAE/EVA are covered as segments by Resin. Hot Melt, Reactive, Sealants, Solvent-borne, UV Cured Adhesives, Water-borne are covered as segments by Technology. Asia-Pacific, Europe, Middle East & Africa, North America, South America are covered as segments by Region.| Acrylic |
| Cyanoacrylate |
| Epoxy |
| Polyurethane |
| Silicone |
| VAE/EVA |
| Other Resins |
| Hot Melt |
| Reactive |
| Sealants |
| Solvent-borne |
| UV Cured Adhesives |
| Water-borne |
| Asia-Pacific | Australia |
| China | |
| India | |
| Indonesia | |
| Japan | |
| Malaysia | |
| Singapore | |
| South Korea | |
| Thailand | |
| Rest of Asia-Pacific | |
| Europe | France |
| Germany | |
| Italy | |
| Russia | |
| Spain | |
| United Kingdom | |
| Rest of Europe | |
| Middle East & Africa | Saudi Arabia |
| South Africa | |
| Rest of Middle East & Africa | |
| North America | Canada |
| Mexico | |
| United States | |
| Rest of North America | |
| South America | Argentina |
| Brazil | |
| Rest of South America |
| Resin | Acrylic | |
| Cyanoacrylate | ||
| Epoxy | ||
| Polyurethane | ||
| Silicone | ||
| VAE/EVA | ||
| Other Resins | ||
| Technology | Hot Melt | |
| Reactive | ||
| Sealants | ||
| Solvent-borne | ||
| UV Cured Adhesives | ||
| Water-borne | ||
| Region | Asia-Pacific | Australia |
| China | ||
| India | ||
| Indonesia | ||
| Japan | ||
| Malaysia | ||
| Singapore | ||
| South Korea | ||
| Thailand | ||
| Rest of Asia-Pacific | ||
| Europe | France | |
| Germany | ||
| Italy | ||
| Russia | ||
| Spain | ||
| United Kingdom | ||
| Rest of Europe | ||
| Middle East & Africa | Saudi Arabia | |
| South Africa | ||
| Rest of Middle East & Africa | ||
| North America | Canada | |
| Mexico | ||
| United States | ||
| Rest of North America | ||
| South America | Argentina | |
| Brazil | ||
| Rest of South America | ||


Market Definition
- End-user Industry - In the aerospace industry, both the OEM and after market adhesive and sealants applications are considered under the scope.
- Product - All adhesive and sealant products used in aerospace industry are considered in the market studied
- Resin - Under the scope of the study, resins like Polyurethane, Epoxy, Acrylic, Cyanoacrylate, VAE/EVA, and Silicone are considered
- Technology - For the purpose of this study, Water-borne, Solvent-borne, Reactive, Hot Melt, UV Cured Adhesives, and Sealants technologies are taken into consideration.
| Keyword | Definition |
|---|---|
| Hot-melt Adhesive | Hot melt adhesives are generally 100% solid formulations, based on thermoplastic polymers. They are solid at room temperature and are activated upon heating above their softening point, at which stage they are liquid, and hence, can be processed. |
| Reactive Adhesive | A reactive adhesive is made up of monomers that react in the adhesive curing process and do not evaporate from the film during use. Instead, these volatile components become chemically incorporated into the adhesive. |
| Solvent-borne Adhesive | Solvent-borne adhesives are mixtures of solvents and thermoplastic, or slightly cross-linked polymers, such as polychloroprene, polyurethane, acrylic, silicone, and natural and synthetic rubbers (elastomers). |
| Water-borne Adhesive | Water-borne adhesives use water as a carrier or diluting medium to disperse a resin. They are set by allowing the water to evaporate or be absorbed by the substrate. These adhesives are compounded with water as a diluent, rather than a volatile organic solvent. |
| UV Cured Adhesive | UV curing adhesives induce curing and create a permanent bond without heating by using ultraviolet (UV) light or other radiation sources. An aggregation of monomers and oligomers is cured or polymerized by ultraviolet (UV) or visible light in a UV adhesive. Because UV is a radiating energy source, UV adhesives are often referred to as radiation curing or rad-cure adhesives. |
| Heat-resistant Adhesive | Heat-resistant Adhesives refer to those that do not break down under high temperatures. One aspect of a complicated system of circumstances is the adhesive's capacity to withstand disintegration brought on by high temperatures. As the temperature rises, adhesives may liquefy. They can withstand stresses resulting from differing coefficients of expansion and contraction, which might be an additional advantage. |
| Reshoring | Reshoring is the practice of moving commodity production and manufacturing back to the nation where the business was founded. Onshoring, inshoring, and back shoring are further terms used. Offshoring, the practice of producing items abroad to lower labor and manufacturing costs, is the opposite of this. |
| Oleochemicals | Oleochemicals are compounds produced from biological oils or fats. They resemble petrochemicals, which are substances made from petroleum. The oleochemical business is built on the hydrolysis of oils or fats. |
| Nonporous Materials | Nonporous materials are substances that do not permit the passage of liquid or air. Nonporous materials are those that are not porous, such as glass, plastic, metal, and varnished wood. Since no air can get through, less airflow is required to raise these materials, negating the requirement for high airflow. |
| EU-Vietnam Free Trade Agreement | A trade agreement and an investment protection agreement were concluded between the European Union and Vietnam on June 30, 2019. |
| VOC content | Compounds with limited solubility in water and high vapor pressure are known as Volatile Organic Compounds (VOCs). Many VOCs are human-made chemicals that are used and produced in the manufacture of paints, pharmaceuticals, and refrigerants. |
| Emulsion Polymerization | Emulsion polymerization is a method of producing polymers or connected groups of smaller chemical chains known as monomers, in a water solution. The method is often used to make water-based paints, adhesives, and varnishes, in which the water stays with the polymer and is marketed as a liquid product. |
| 2025 National Packaging Targets | In 2018, the Australian Environment Ministry set the following 2025 National Packaging Targets: 100% of the packaging must be reusable, recyclable, or compostable by 2025, 70% of plastic packaging must be recycled or composted by 2025, 50% of average recycled content must be included in packaging by 2025, and problematic and unnecessary single-use plastic packaging must be phased out by 2025. |
| Russian Government’s Import Substitution Policy | The Western sanctions suspended the distribution of several high-tech items to Russia, including those required by the raw material export sectors and the military-industrial complex. In response, the government launched an "import substitution" scheme, appointing a special commission to oversee its implementation in early 2015. |
| Paper Substrate | Paper substrates are paper sheets, reels, or boards with a base weight of up to 400 g/m2 that has not been converted, printed or otherwise altered. |
| Insulation Material | A material that inhibits or blocks heat, sound, or electrical transmission is known as Insulation Material. The variety of insulation materials includes thick fibers like fiberglass, rock and slag wool, cellulose, and natural fibers as well as stiff foam boards and sleek foils. |
| Thermal Shock | A temperature change known as thermal shock generates stress in a material. It commonly results in material breakdown and is especially prevalent in brittle materials like ceramics. When there is a quick temperature change, either from hot to cold or vice versa, this process occurs abruptly. It occurs more frequently in materials with poor heat conductivity and insufficient structural integrity. |


Research Methodology
Mordor Intelligence follows a four-step methodology in all our reports.
- Step-1: Identify Key Variables: The quantifiable key variables (industry and extraneous) pertaining to the specific product segment and country are selected from a group of relevant variables & factors based on desk research & literature review; along with primary expert inputs. These variables are further confirmed through regression modeling (wherever required).
- Step-2: Build a Market Model: In order to build a robust forecasting methodology, the variables and factors identified in Step-1 are tested against available historical market numbers. Through an iterative process, the variables required for market forecast are set and the model is built on the basis of these variables.
- Step-3: Validate and Finalize: In this important step, all market numbers, variables and analyst calls are validated through an extensive network of primary research experts from the market studied. The respondents are selected across levels and functions to generate a holistic picture of the market studied.
- Step-4: Research Outputs: Syndicated Reports, Custom Consulting Assignments, Databases & Subscription Platforms


