Market Overview
| Study Period | 2020 - 2031 |
|---|---|
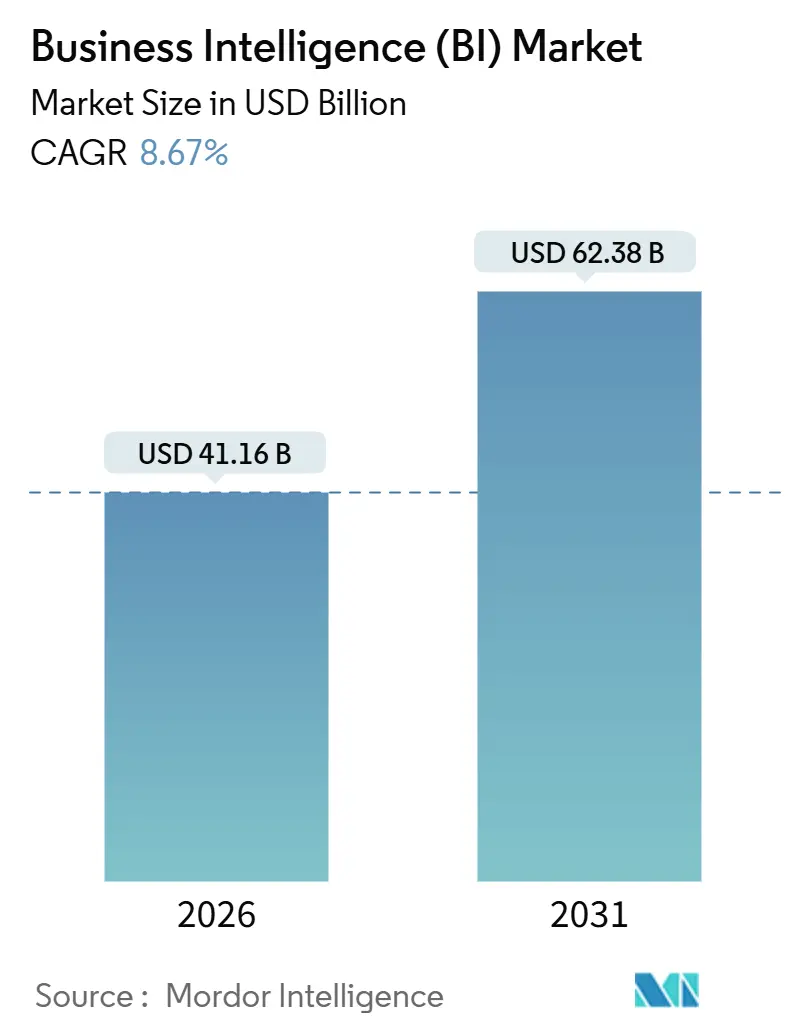
| Market Size (2026) | USD 41.16 Billion |
| Market Size (2031) | USD 62.38 Billion |
| Growth Rate (2026 - 2031) | 8.67% CAGR |
| Fastest Growing Market | Asia Pacific |
| Largest Market | North America |
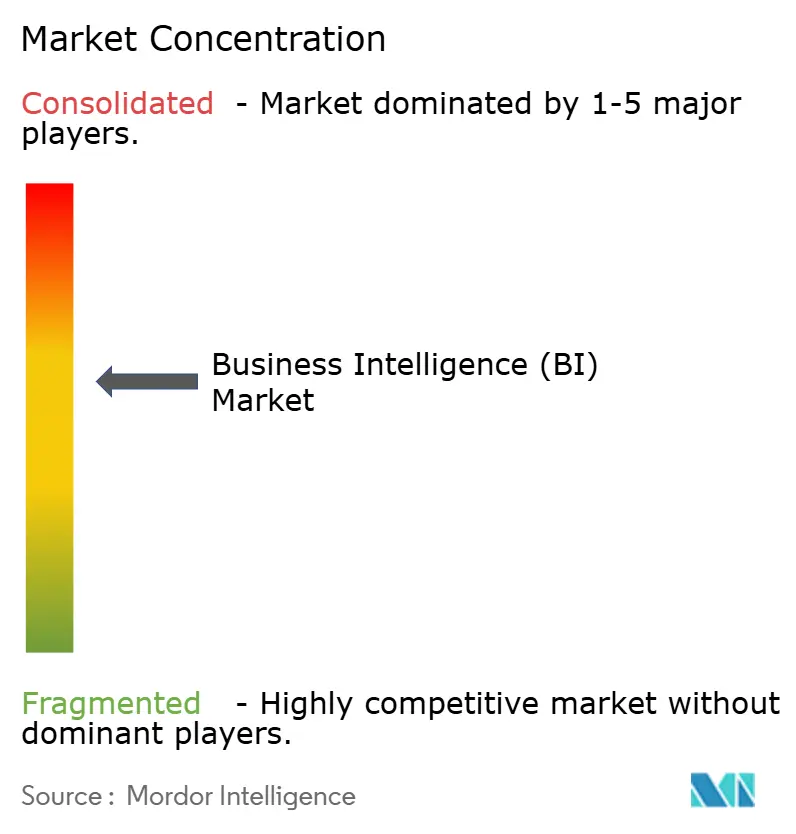
| Market Concentration | Medium |
Major Players *Disclaimer: Major Players sorted in no particular order Image © Mordor Intelligence. Reuse requires attribution under CC BY 4.0. | |
Business Intelligence (BI) Market Analysis by Mordor Intelligence
The Business Intelligence (BI) market size reached USD 41.16 billion in 2026 and is projected to climb to USD 62.38 billion by 2031, registering an 8.67% CAGR. Organizations are replacing periodic reporting with continuous intelligence pipelines that stream semi-structured IoT telemetry, clickstream logs, and sensor data into cloud lakehouses, accelerating insight cycles from days to seconds. Cloud deployment claimed 65.87% revenue in 2025, a position strengthened by hyperscaler GPU-accelerated query engines that compress latency without large capital outlays. Usage-based licensing, composable analytics stacks, and privacy-preserving data clean rooms widen market access for mid-market buyers and digital-native brands. Although talent shortages, multi-cloud egress fees, and country-specific data-sovereignty mandates curb adoption velocity, the Business Intelligence (BI) market continues to broaden across industries and regions as analytics becomes a core element of digital-transformation agendas.
Key Report Takeaways
- By deployment, cloud accounted for 65.87% of Business Intelligence (BI) market share in 2025, and is advancing at a 9.54% CAGR through 2031.
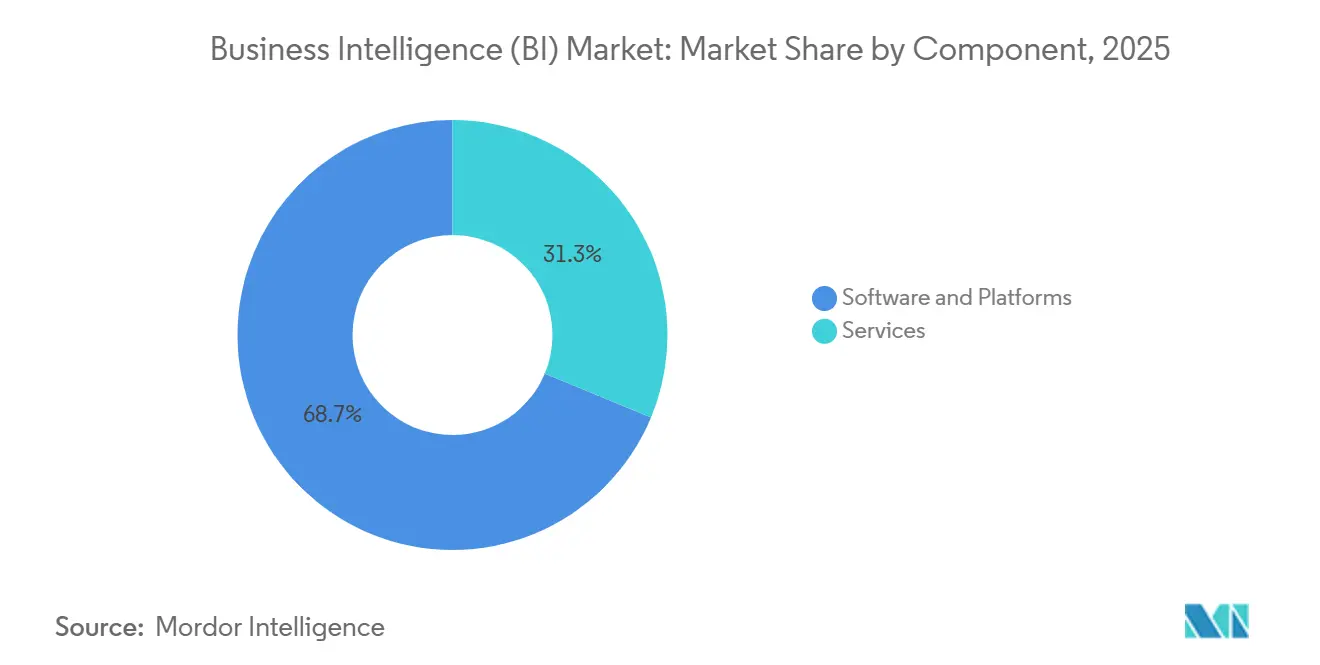
- By component, software and platforms captured 68.73% of Business Intelligence (BI) market size in 2025, whereas services are expanding at a 9.23% CAGR to 2031.
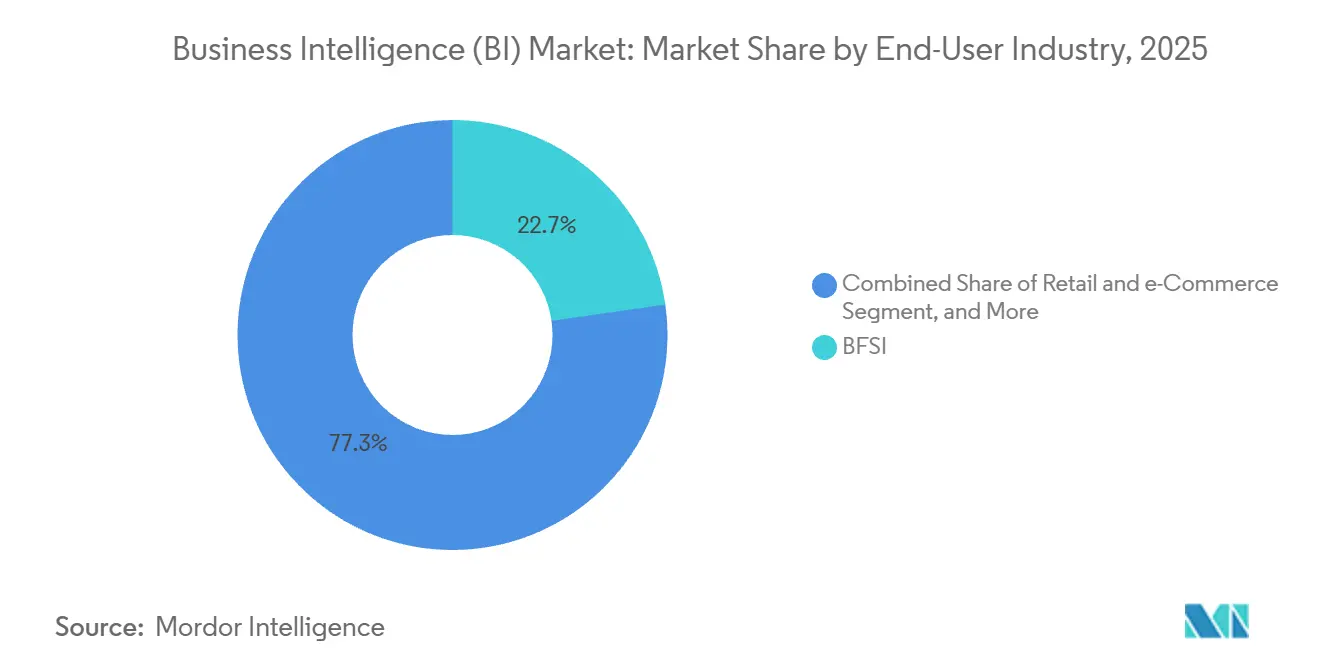
- By end-user industry, banking, financial services, and insurance held 22.74% revenue in 2025; retail and e-commerce are set to post a 10.21% CAGR through 2031.
- By business model, subscription and software-as-a-service generated 60.13% of 2025 revenue, while freemium and usage-based pricing are growing at a 9.67% CAGR through 2031.
- By geography, North America commanded 39.85% of 2025 revenue, yet Asia-Pacific is forecast to register a 10.12% CAGR through 2031.
Note: Market size and forecast figures in this report are generated using Mordor Intelligence’s proprietary estimation framework, updated with the latest available data and insights as of January 2026.
Global Business Intelligence (BI) Market Trends and Insights
Drivers Impact Analysis*
| Driver | (~) % Impact on CAGR Forecast | Geographic Relevance | Impact Timeline |
|---|---|---|---|
| Cloud-First Analytics Adoption | +2.1% | Global, strongest in North America and Europe | Medium term (2-4 years) |
| Explosion of Semi-Structured IoT Data | +1.8% | APAC manufacturing hubs and North America smart cities | Long term (≥ 4 years) |
| Mainstream Embedded BI in SaaS Apps | +1.5% | Global, led by North America and Europe SaaS vendors | Medium term (2-4 years) |
| Data Clean-Room Partnerships | +0.9% | North America and Europe, spreading to APAC | Short term (≤ 2 years) |
| GPU-Accelerated Query Engines | +1.3% | Early uptake in North America and Europe | Medium term (2-4 years) |
| Rise of Analytics-as-Code and GitOps | +0.7% | North America and Europe engineering-centric firms | Short term (≤ 2 years) |
| Source: Mordor Intelligence | |||
Cloud-first analytics adoption
Enterprises continue to migrate analytic workloads into managed cloud ecosystems because pay-per-second pricing matches spending to actual consumption.[1]Amazon Web Services, “Redshift Serverless Documentation,” aws.amazon.com Serverless warehouses such as Amazon Redshift Serverless auto-scale to meet thousands of concurrent queries, letting teams finish pilot dashboards in weeks rather than the multi-year timelines once associated with on-premise builds. Google BigQuery’s streaming inserts and Gemini AI integration allow business users to issue natural-language questions that the platform translates into SQL, widening participation beyond specialized analysts. Microsoft Power BI paired with Fabric can refresh visuals whenever new data lands, eliminating nightly batch windows.[2]Microsoft Corporation, “Power BI Fabric Overview,” microsoft.com Financial-services firms maintain hybrid patterns, keeping regulated records on-premise while exploratory models move to the cloud, a deployment style referenced in U.S. supervisory guidance.
Explosion of Semi-Structured IoT Data
Industrial sensors, vehicle telematics, and smart-city networks push daily payloads of JSON, Avro, and Parquet files that traditional relational databases cannot absorb efficiently.[3]International Telecommunication Union, “IoT Statistics,” itu.int Columnar lakehouse engines use schema-on-read to query raw device messages alongside transactional data, enabling predictive maintenance that cuts unplanned downtime by 20-30% in manufacturing trials. Peer-reviewed benchmarks show GPU-accelerated SQL engines delivering 8-60× speed-ups versus CPU systems on TPC-H workloads, reducing end-user wait times to sub-second levels. Snowflake’s VARIANT data type and Databricks Delta Lake illustrate unified storage that hosts structured orders and raw telemetry in a single environment. As 5G coverage expands, edge gateways forward aggregated sensor snapshots to cloud object stores, keeping bandwidth costs manageable while still enabling near-real-time analytics.
Mainstream Embedded BI in SaaS Apps
Software vendors increasingly embed dashboards directly into customer-relationship, finance, and supply-chain applications, eliminating the need to export data into stand-alone tools. Salesforce Tableau Pulse surfaces anomalies inside CRM workflows so sales managers view risk alerts without breaking context. Qlik’s acquisition of Talend created an integration-plus-analytics bundle that white-labels easily for independent software vendors seeking fast time-to-value. Embedded models shorten buying cycles because analytics becomes a premium tier within an existing contract rather than a discrete procurement. The shift also transforms revenue recognition, tying vendor growth to application usage trends instead of seat counts.
Data Clean-Room Partnerships
Third-party cookie deprecation and rising privacy fines spur advertisers to analyze audiences inside cryptographic clean rooms that mask personal identifiers. Google Ads Data Hub, Amazon Marketing Cloud, and Snowflake Clean Rooms let brands overlap first-party customer lists with publisher segments while keeping raw rows hidden. Differential-privacy thresholds protect anonymity, yet high aggregation sometimes obscures niche audience insights, forcing marketers to invest in multiple parallel clean-room integrations. Early adopters report that campaign measurement accuracy recovers to near cookie-era baselines while legal exposure drops materially, encouraging expanded use cases in connected-TV and retail media.
Restraints Impact Analysis*
| Restraint | (~) % Impact on CAGR Forecast | Geographic Relevance | Impact Timeline |
|---|---|---|---|
| Shortage of Data-Literate Workforce | -1.4% | Global, most acute in emerging APAC and African markets | Long term (≥ 4 years) |
| Up-Front Integration Cost for Legacy Systems | -1.1% | North America and Europe enterprises with decades-old ERP stacks | Medium term (2-4 years) |
| Escalating Egress Fees in Multi-Cloud | -0.8% | Enterprises distributing workloads across AWS, Azure, and GCP | Short term (≤ 2 years) |
| Data-Sovereignty Clampdowns | -0.9% | China, India, European Union, Middle East and Africa | Long term (≥ 4 years) |
| Source: Mordor Intelligence | |||
Shortage of Data-Literate Workforce
Accenture’s 2025 survey shows only 21% of employees possess functional data skills, leaving 87% of enterprises struggling to fill analyst roles. The World Economic Forum ranks data analysis among the top five future skills through 2030, yet academic programs are not producing graduates fast enough to meet demand. Rising salaries divert budgets away from platform investments into compensation, sometimes delaying new deployments. Low-code tools help but cannot replace human judgment when reconciling conflicting sources or addressing sampling bias. Companies respond with internal academies and certification stipends, yet ramp-up timelines remain lengthy, extending the adoption curve in the Business Intelligence (BI) market.
Up-Front Integration Cost for Legacy Systems
Deloitte’s 2024 technical-debt study found 60% of IT budgets maintain legacy systems rather than fund new analytics. Extracting data from mainframe-based banking cores or COBOL-era ERP packages demands custom middleware that can consume 40-60% of Business Intelligence project budgets. Integration delays reduce executive confidence, heightening the risk that business units adopt shadow BI tools without governance controls. Financial institutions note that modernization requires parallel compliance sign-offs, further inflating cost and time. Vendors now bundle pre-built connectors and migration accelerators, but custom field mapping and data-quality remediation still require specialized consultants, especially for cross-system joins like customer master data reconciliation
*Our forecasts treat driver/restraint impacts as directional, not additive. The impact forecasts reflect baseline growth, mix effects, and variable interactions.
Segment Analysis
By Component: Services Sustain Momentum While Platforms Consolidate
Services revenue expanded at a 9.23% CAGR, outpacing the Business Intelligence (BI) market because companies enlist domain experts to design semantic models, optimize query logic, and train citizen analysts. Software and platforms retained 68.73% 2025 revenue as license subscriptions remain foundational, particularly for organizations standardizing on a single visualization layer. Systems integrators differentiate by guaranteeing service-level objectives such as sub-second dashboard latency or 99.9% refresh reliability, monetizing outcome-based contracts rather than billable hours. Managed-service bundles that wrap licenses, cloud infrastructure, and ongoing optimization into usage-based payments reduce capital strain for mid-market buyers, aligning with broader IT shifts toward operating-expense models.
Platform vendors counter competitive pressure by embedding AI copilots that auto-generate visuals and DAX formulas, lowering external consulting needs. Hyperscaler convergence accelerates, as Oracle Autonomous Database and SAP Analytics Cloud combine storage, transformation, and presentation layers to lock in enterprise data estates. Services providers respond by specializing in cross-platform governance, helping multinational clients reconcile multiple BI stacks acquired through mergers. As the Business Intelligence (BI) market size rises, specialist boutiques emerge around vertical use cases such as pharmacovigilance signal detection and retail demand sensing, sustaining a vibrant advisor ecosystem despite platform simplification trends.


By Deployment: Cloud Dominance Reconfigures Cost Structures
The cloud segment accounted for 65.87% of 2025 revenue and is advancing at a 9.54% CAGR through 2031. The cloud implementations segment dominates the market because variable compute and serverless warehousing eliminate idle capacity costs while auto-scaling meets unpredictable analytical surges. Continuous ingestion pipelines feed near-real-time dashboards for e-commerce flash-sale monitoring, a capability historically out of reach for on-premise appliances. Nations such as India and Indonesia require local data processing, prompting hyperscalers to launch in-country regions that meet sovereignty mandates and support further growth of the Business Intelligence (BI) market.
On-premises clusters persist in hospitals and banks that cannot move patient records or credit data off-site due to regulatory constraints, resulting in hybrid architectures where sensitive workloads remain on-premises while customer experience experimentation occurs in the cloud. Multi-cloud strategies spread risk across Amazon Web Services, Microsoft Azure, and Google Cloud Platform but incur egress charges that sometimes eclipse compute costs, prompting interest in zero-egress object stores such as Cloudflare R2. Vendors now integrate cost-optimizer dashboards that model query-level spend, helping finance teams predict invoices and avoid sticker shock.
By End-User Industry: Retail Overtakes Mature Financial Services
Banking, financial services, and insurance represented 22.74% of 2025 revenue, leveraging longstanding risk analytics and regulatory reporting that mandate granular dashboards. Basel III and upcoming Basel IV requirements force institutions to unify exposure data across trading, lending, and derivatives portfolios, sustaining demand for high-lineage Business Intelligence industry solutions. Retail and e-commerce, however, is set to grow fastest at 10.21% CAGR as omnichannel competition drives sub-100-millisecond personalization across petabyte customer logs.
Retailers merge online clickstream events with store point-of-sale feeds to adjust pricing and inventory dynamically, turning analytics from an after-the-fact report into a live merchandising engine. Manufacturers ingest industrial IoT sensor data to fine-tune maintenance schedules, saving millions in unplanned downtime according to field studies published by Siemens. Healthcare organizations integrate electronic health records and claims to highlight care gaps, informed by the U.S. Food and Drug Administration’s 2024 guidance on real-world evidence. Government agencies adopt dashboards to optimize citizen services, though procurement cycles remain longer due to transparency rules.

By Business Model: Usage-Based Pricing Shifts Revenue Recognition
Subscription and SaaS licensing generated 60.13% of 2025 revenue as vendors shifted from perpetual seats to annual recurring agreements, aligning incentives with customer success. Freemium and usage-based tiers expand at 9.67% CAGR because they let small teams start at zero cost then upgrade when value is proven, an approach illustrated by ThoughtSpot’s Developer Edition. Vendors monetize advanced scheduling, governance, and machine-learning features inside premium plans, improving dollar retention as deployments mature.
Usage billing correlates spend with query volume, giving finance leaders comfort that costs track benefit, but it also introduces revenue volatility for suppliers, prompting them to build predictive-billing analytics. Seat-based models decline as shadow users exploit dashboard links without paid credentials, eroding realized revenue. Analytics-as-Code workflows connect BI consumption to Git commit counts, spawning developer-oriented pricing that bills per transformation run rather than user logins, a model championed by dbt Cloud.
Geography Analysis
North America captured 39.85% of 2025 revenue thanks to concentrated hyperscaler data centers that keep dashboard round-trip latency below 10 milliseconds. Mature venture-capital ecosystems fund start-ups offering specialized AI copilots that broaden Business Intelligence (BI) market adoption beyond trained analysts. Only 21% of workers hold analytical competency, limiting platform utilization despite abundant technology. Multi-cloud egress charges occasionally surpass compute spend for data-intensive workloads, forcing architectural redesign to co-locate processing and storage.
Asia-Pacific is forecast to log a 10.12% CAGR to 2031 as China targets a 60% digital-economy contribution to GDP by 2025, spurring domestic BI platform investment. India’s Digital India program expands broadband and subsidizes cloud adoption, creating greenfield demand for localized analytics solutions. The Association of Southeast Asian Nations projects its digital economy will reach USD 1 trillion by 2030, with e-commerce and fintech sectors spearheading analytics spend. However, divergent privacy frameworks across China, India, and Southeast Asia require region-specific data residencies, inflating vendor compliance costs.
Europe grows steadily as enterprises embed privacy-by-design analytics to satisfy the General Data Protection Regulation, which levied EUR 1.6 billion in fines during 2023. South America witnesses upticks in Brazil and Argentina as firms digitize operations, but currency volatility slows mega-projects. The Middle East and Africa plant early seeds via smart-city programs in the United Arab Emirates and Saudi Arabia, yet infrastructure gaps and skills shortages constrain near-term scale, making partnerships with regional integrators essential.


Competitive Landscape
The market is moderately concentrated, yet still allows vertical and regional specialists to thrive. Hyperscalers bundle data storage, compute, and native BI in a single console, raising switching costs while simplifying governance; Amazon QuickSight, Microsoft Power BI, and Google Looker Studio exemplify this convergence. Integrated stacks also leverage shared billing and security frameworks, appealing to CIOs consolidating vendor footprints.
Incumbent enterprise software suppliers such as SAP, Oracle, and IBM defend transactional workloads by embedding analytics tightly into their databases, capitalizing on existing administrative familiarity to deter migration. SAP Analytics Cloud employs in-memory calculation engines that read directly from S/4HANA tables, eliminating extract-transform-load steps and reinforcing customer lock-in. IBM’s watsonx.Data integrates with Cognos Analytics, offering a unified metadata layer that streamlines governance for highly regulated industries such as healthcare and banking.
In the long tail, composable Analytics-as-Code vendors attract engineering-led organizations that favor Git-based version control over drag-and-drop interfaces; dbt Labs raised funding to expand its cloud service that manages SQL transformations as code. AI-powered natural-language interfaces democratize analytics, with ThoughtSpot Spotter AI and Alteryx AiDIN able to generate visual answers to spoken questions, though accuracy still requires analyst validation for mission-critical scenarios. Data-clean-room specialists partner with publishers and advertisers, carving space alongside mainstream BI by focusing on privacy-first insight sharing.
Business Intelligence (BI) Industry Leaders
SAP SE
Oracle Corporation
Microsoft Corporation
International Business Machines Corporation
Salesforce Inc.
- *Disclaimer: Major Players sorted in no particular order

Recent Industry Developments
- January 2026: Amazon Web Services released QuickSight real-time anomaly detection for streaming data.
- November 2025: Google Cloud added vector search to Looker Studio, enabling semantic exploration of unstructured documents.
- September 2025: Microsoft introduced Auto Semantic Model suggestions in Power BI to automate relationship mapping.
- January 2025: IBM embedded generative AI query rewriting into Cognos Analytics for automatic SQL tuning.


Research Methodology Framework and Report Scope
Market Definitions and Key Coverage
Our study defines the global business-intelligence vendors market as all packaged software platforms and associated professional or managed services that ingest enterprise data, apply query, reporting, visualization, and augmented analytics functions, and deliver decision support through web, desktop, and mobile interfaces.
Scope exclusion: solutions that are sold purely as generic data warehouses, ETL tools, or horizontal data-integration middleware without native BI front-ends are not included.
Segmentation Overview
- By Component
- Software and Platform
- Services
- By Deployment
- On-Premise
- Cloud
- By End-User Industry
- BFSI
- IT and Telecommunication
- Retail and e-Commerce
- Healthcare
- Manufacturing
- Government and Public Sector
- By Business Model
- Subscription / SaaS License
- Perpetual License
- Freemium / Usage-Based
- Managed Service / BI-as-a-Service
- By Geography
- North America
- United States
- Canada
- Mexico
- South America
- Brazil
- Argentina
- Rest of South America
- Europe
- United Kingdom
- Germany
- France
- Italy
- Spain
- Russia
- Rest of Europe
- Asia-Pacific
- China
- Japan
- India
- South Korea
- Australia and New Zealand
- Southeast Asia
- Rest of Asia-Pacific
- Middle East and Africa
- Middle East
- Saudi Arabia
- United Arab Emirates
- Turkey
- Rest of Middle East
- Africa
- South Africa
- Nigeria
- Kenya
- Rest of Africa
- Middle East
- North America
Detailed Research Methodology and Data Validation
Primary Research
Interviews and structured surveys with BI product managers, regional system integrators, and large-enterprise analytics architects across North America, Europe, and Asia-Pacific helped us validate growth levers, fine-tune average seat counts, and stress-test cloud price-erosion assumptions before finalizing the model.
Desk Research
We began by mapping revenue pools using openly available indicators such as the US Bureau of Economic Analysis investment in application software, Eurostat ICT adoption ratios, ITU broadband-penetration data, and CompTIA industry shipment trackers. Company 10-K filings and investor decks provided license mix, average selling price trends, and regional sales splits. Subscription splits and product attach rates were sanity-checked in paid repositories like D&B Hoovers and Dow Jones Factiva. The sources listed are illustrative; many additional public datasets and filings were reviewed to complete our desk work.
Our team also parsed procurement portals, patent abstracts, and trademark filings (Questel) to gauge new module launches, and then aligned these signals with survey data on cloud-BI take-up published by leading trade associations to anchor technology-mix assumptions.
Market-Sizing & Forecasting
A top-down build, starting with enterprise software spending, adjusted for BI's share and then split by deployment and service layers, forms the backbone. Supplier roll-ups, channel checks, and sampled ASP-by-seat calculations provide a selective bottom-up cross-check. Key variables include: - cloud BI subscription share of total deployments, - average seats per 1,000 employees, - median annual subscription ASP, - share of self-service dashboards in active usage, - regional GDP per employee as a proxy for data-driven maturity. A multivariate regression model links these drivers to historical revenue; forecasts to 2030 are generated through scenario analysis that flexes cloud penetration and seat density. Gaps in granular vendor data are bridged by applying weighted regional benchmarks drawn from primary calls.
Data Validation & Update Cycle
Outputs pass a three-layer review: automated variance checks, peer analyst challenge sessions, and a senior sign-off. Reports refresh yearly; interim updates are triggered when material events, such as major pricing shifts and landmark acquisitions, move the market outlook.
Why Mordor's Business Intelligence Baseline Deserves Trust
Published estimates often diverge because firms frame BI scope differently, convert currencies on varied dates, and refresh at uneven cadences.
Key gap drivers include exclusion of service revenues by some publishers, reliance on older 2020 baselines, and conservative cloud-migration paths that depress average seat pricing, whereas Mordor Intelligence reports full-stack revenues, applies rolling currency averages, and incorporates live cloud-seat metrics sourced each quarter.
Benchmark comparison
| Market Size | Anonymized source | Primary gap driver |
|---|---|---|
| USD 38.15 B | Mordor Intelligence | - |
| USD 33.30 B | Global Consultancy A | Omits managed-service revenue and relies on 2020 static baseline |
| USD 34.82 B | Industry Publisher B | Uses partial vendor sample and single-country pricing to globalize totals |
In sum, Mordor's disciplined variable selection, dual-pass validation, and timely refresh schedule furnish decision-makers with a balanced, transparent starting point they can trace back to clear inputs and reproducible steps.


Key Questions Answered in the Report
How large will the Business Intelligence market be by 2031?
Forecasts show the Business Intelligence market reaching USD 62.38 billion by 2031.
Which deployment model is growing fastest within Business Intelligence solutions?
Cloud deployment is expanding at a 9.54% CAGR, outpacing hybrid and on-premise alternatives.
Which sector is projected to adopt Business Intelligence platforms most rapidly?
Retail and e-commerce leads with a 10.21% CAGR as firms seek real-time personalization and inventory optimization.
Why are companies shifting toward usage-based pricing for analytics platforms?
Usage-based plans align costs with actual query volume, lowering entry barriers and eliminating waste from inactive licenses.
What region will drive the bulk of new Business Intelligence spending through 2031?
Asia-Pacific is expected to post the fastest growth, supported by digital-economy mandates in China and India.
How concentrated is the competition among Business Intelligence vendors?
The field is moderately concentrated, with the five largest firms controlling about 45-50% of global revenue.
Page last updated on:


