
Market Overview
| Study Period | 2020 - 2031 |
|---|---|
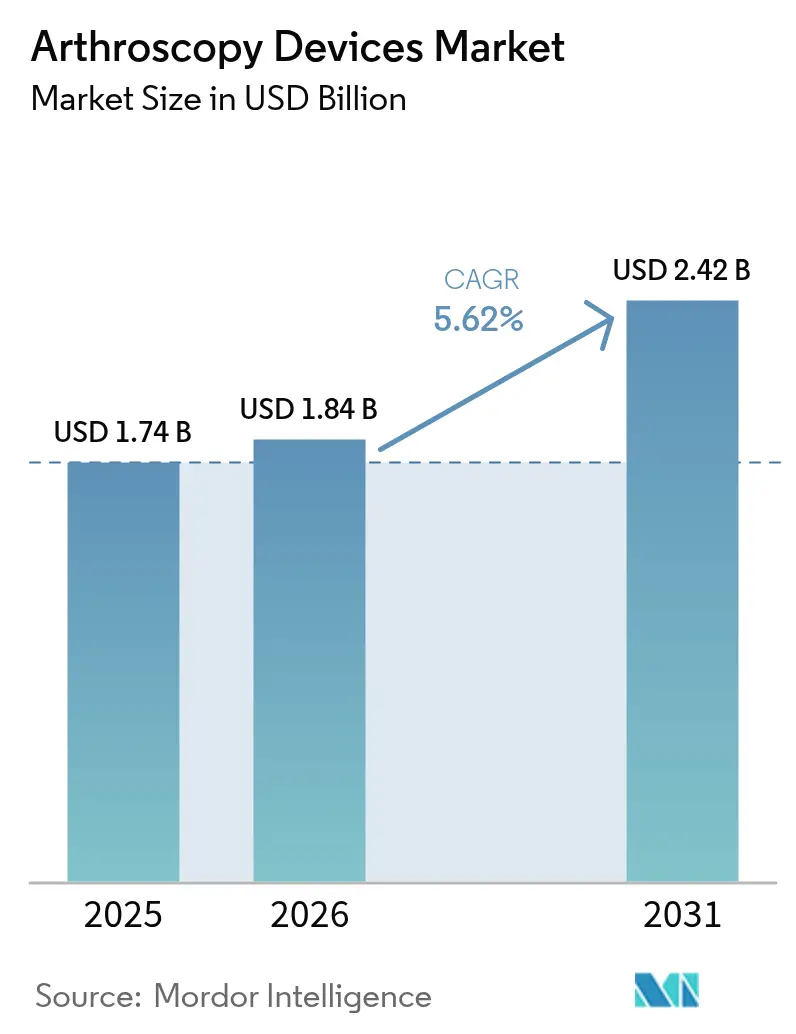
| Market Size (2026) | USD 1.84 Billion |
| Market Size (2031) | USD 2.42 Billion |
| Growth Rate (2026 - 2031) | 5.62 % |
| Fastest Growing Market | Asia Pacific |
| Largest Market | North America |
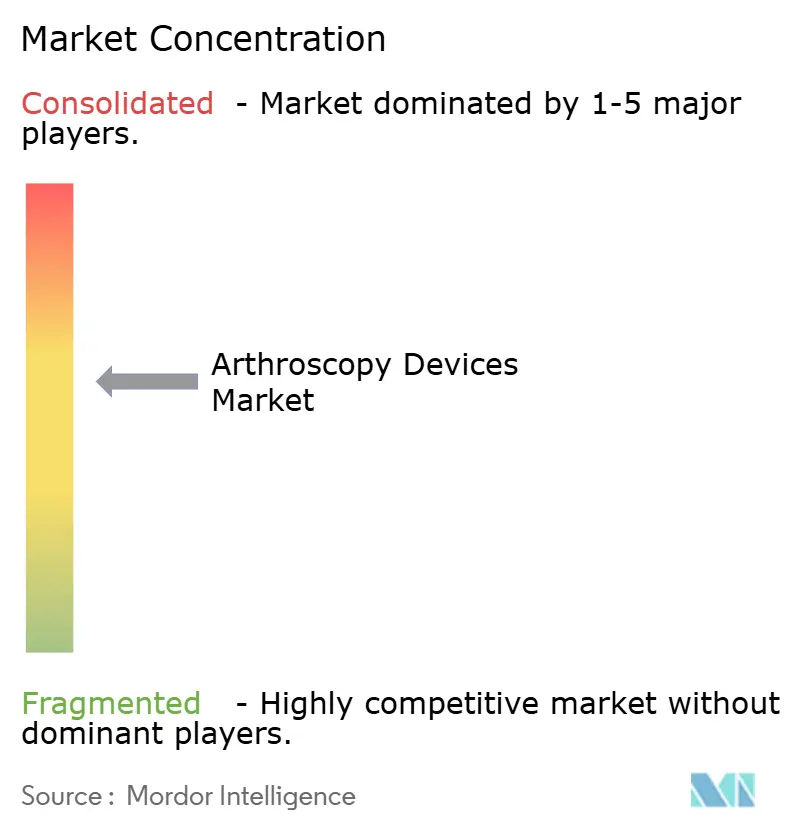
| Market Concentration | Medium |
Major Players *Disclaimer: Major Players sorted in no particular order Image © Mordor Intelligence. Reuse requires attribution under CC BY 4.0. | |
Arthroscopy Devices Market Analysis by Mordor Intelligence
The arthroscopy devices market size is expected to grow from USD 1.74 billion in 2025 to USD 1.84 billion in 2026 and is forecast to reach USD 2.42 billion by 2031 at 5.62% CAGR over 2026-2031. Demand acceleration reflects the continued shift toward minimally invasive joint repair, the steady rise in musculoskeletal disease prevalence, and widening adoption of outpatient surgical pathways. Device makers now bundle visualization, resection, and implant systems to capture more value per procedure, while payors reward settings that deliver equal outcomes at lower cost. Artificial-intelligence guidance, wireless imaging, and bio-integrative implants raise both clinical efficacy and pricing power. At the same time, sustainability regulations and single-use scrutiny stimulate research into recyclable or hybrid portfolios. Competitive strategies concentrate on acquisitions that secure breakthrough technologies or fill geographic gaps, keeping sector consolidation in a moderate zone.
Key Report Takeaways
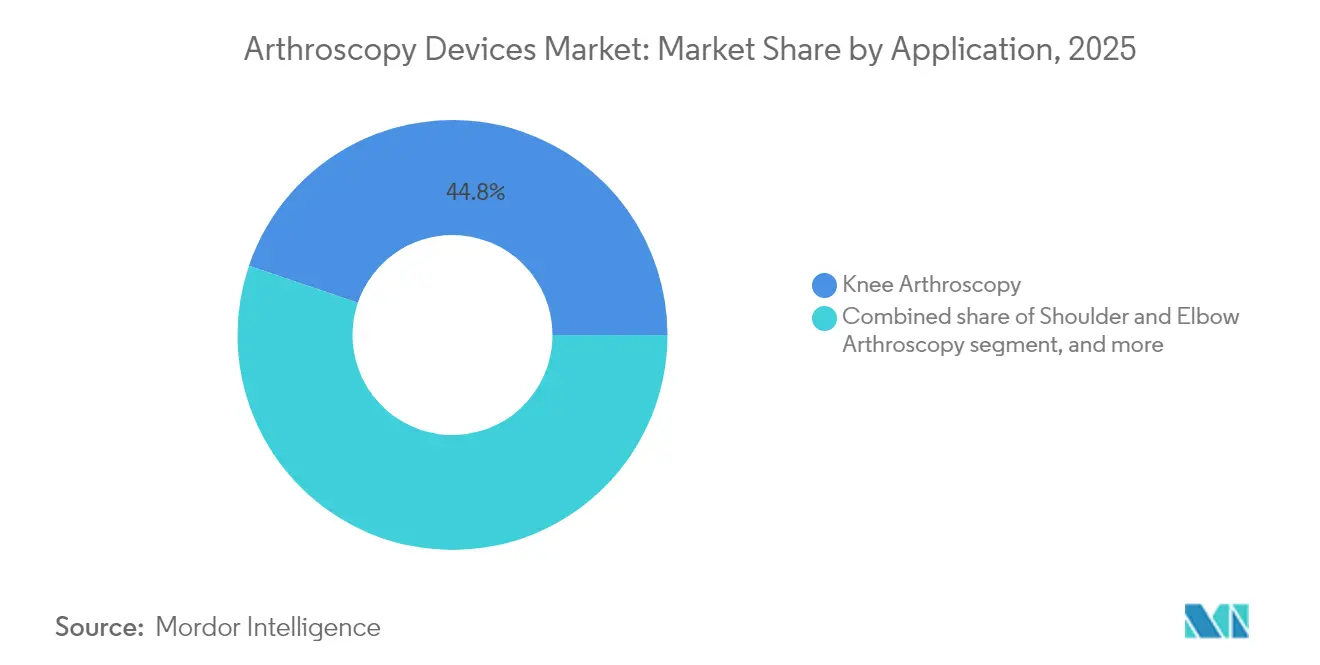
- By application, knee arthroscopy led with a 44.78% revenue share of the arthroscopy devices market in 2025 while hip procedures are projected to expand at a 7.45% CAGR through 2031.
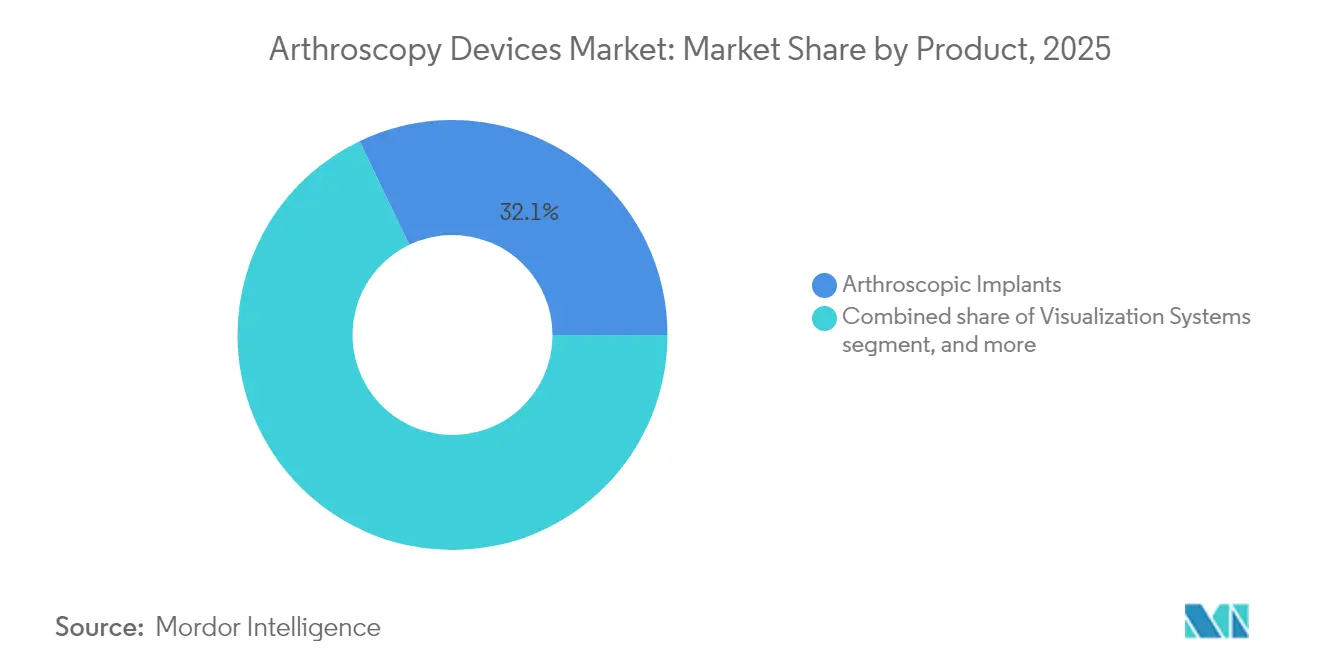
- By product, arthroscopic implants captured 32.12% of the arthroscopy devices market size in 2025; motorized shavers and resection systems are forecast to grow at an 7.86% CAGR between 2026-2031.
- By end user, hospitals accounted for 68.02% of the arthroscopy devices market share in 2025, whereas ambulatory surgical centers are advancing at an 8.12% CAGR to 2031.
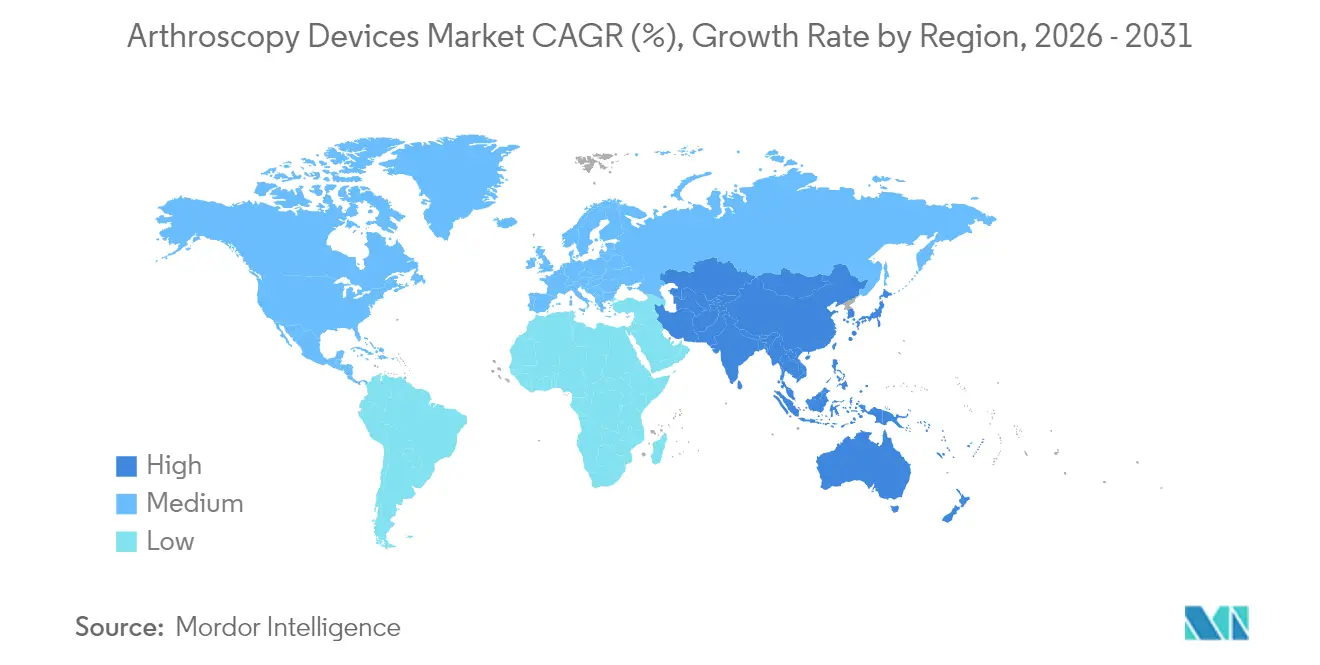
- By geography, North America held 42.05% of 2025 revenues; Asia-Pacific is expected to record a 6.39% CAGR over the same period.
Note: Market size and forecast figures in this report are generated using Mordor Intelligence’s proprietary estimation framework, updated with the latest available data and insights as of 2026.
Market Trends and Insights
Drivers Impact Analysis of Arthroscopy Devices Market*
| Driver | % Impact on CAGR Forecast | Geographic Relevance | Impact Timeline |
|---|---|---|---|
| Rising burden of musculoskeletal disorders | +1.8% | Global; strongest in aging North America & Europe | Long term (≥ 4 years) |
| Shift toward minimally invasive orthopedic procedures | +1.2% | Global; led by developed‐market surgical hubs | Medium term (2-4 years) |
| Continuous technological innovation in arthroscopic equipment | +0.9% | North America & Europe first, APAC catching up | Medium term (2-4 years) |
| Growing participation in sports and physical fitness activities | +0.7% | Global youth cohorts | Long term (≥ 4 years) |
| Expansion of ambulatory surgical centers and outpatient settings | +0.6% | North America lead; Europe & APAC scaling | Short term (≤ 2 years) |
| Increasing healthcare expenditure in emerging economies | +0.4% | Asia-Pacific core; MEA & Latin America spillover | Long term (≥ 4 years) |
| Source: Mordor Intelligence | |||
Rising Burden of Musculoskeletal Disorders
Global osteoarthritis cases reached 606.5 million in 2021, with prevalence accelerating among women and the elderly. Musculoskeletal disease now ranks as the second-largest cause of years lived with disability, pushing payors toward cost-effective arthroscopic solutions. Projections suggest that nearly 50% of post-menopausal women could have osteoarthritis by 2045. Demand growth therefore aligns directly with demographic aging and rising life expectancy in both developed and emerging regions.
Shift Toward Minimally Invasive Orthopedic Procedures
Average hospital stay falls by 2-3 days when arthroscopy replaces open surgery, translating to measurable payor savings and improved patient satisfaction[1]UC Davis Health Press Office, “Arthroscopy Shortens Hospital Stay,” health.ucdavis.edu. Uptake is further propelled by 4K visualization, wireless cameras, and robotic assistance that expand indications once considered too complex for a portal approach. Younger patients favor the faster rehabilitation and smaller scars relative to open repair.
Continuous Technological Innovation in Arthroscopic Equipment
Augmented-reality guidance platforms such as the TESSA Spatial Surgery System deliver real-time alignment cues for ligament reconstruction, reducing technical error risk. Wireless camera suites eliminate cables and shorten setup time while preserving HD image quality. Nano-arthroscopy scopes as small as 2 mm enable office-based diagnostic procedures that lower facility costs and broaden access. AI-driven planning tools refine tunnel placement and predict graft tension, enhancing outcomes.
Growing Participation in Sports and Physical Fitness Activities
Between 2014-2023, soccer generated 843,063 lower-extremity injuries in the United States alone, with ankle trauma comprising 36.39% of cases and 63.24% occurring in the 10-19 age cohort[2]Paolo Maduri, “Lower-Extremity Soccer Injuries 2014-2023,” Orthopedic Reviews, pagepressjournals.org. Basketball and field sports show similarly high joint-injury incidence, especially ACL tears among female athletes that often require reconstruction. Year-round specialization elevates overuse lesions, ensuring a steady procedure pipeline for shoulder, knee, and ankle scopes.
Restraints Impact Analysis of Arthroscopy Devices Market*
| Restraints Impact Analysis | (~) % Impact on CAGR Forecast | Geographic Relevance | Impact Timeline |
|---|---|---|---|
| High capital and procedural costs | -0.8% | Global; greatest drag in cost-sensitive markets | Medium term (2-4 years) |
| Stringent regulatory and reimbursement hurdles | -0.6% | North America & Europe | Long term (≥ 4 years) |
| Limited availability of skilled arthroscopic surgeons | -0.5% | Emerging markets; rural areas worldwide | Long term (≥ 4 years) |
| Sustainability concerns regarding single-use devices | -0.3% | Europe spearheading; ripple to North America & APAC | Medium term (2-4 years) |
| Source: Mordor Intelligence | |||
High Capital and Procedural Costs
A fully equipped arthroscopy suite requires upfront investment above USD 500,000, while consumables add USD 2,000-5,000 per case, pressuring facilities with modest volumes[3]Elise Bland, “Cost Analysis of Arthroscopic Operating Suites,” BMC Health Services Research, bmc.org. Inventory demands escalate when covering multiple joints, and reimbursement often fails to offset the premium of single-use disposables.
Stringent Regulatory and Reimbursement Hurdles
The 2022 Medical Device User Fee Amendments introduced higher review fees and more extensive post-market obligations, stretching time to market and development budgets. Prior-authorization rules for certain pain-management codes illustrate the administrative complexity that can dampen procedure numbers. Europe’s MDR likewise tightens clinical evidence requirements, forcing smaller innovators to seek partnerships with established firms.
*Our forecasts treat driver/restraint impacts as directional, not additive. The impact forecasts reflect baseline growth, mix effects, and variable interactions.
Arthroscopy Devices Market Segment Analysis
By Application:
Knee Procedures Drive Volume While Hip Arthroscopy AcceleratesKnee procedures accounted for 44.78% of 2025 revenues, underscoring the joint’s high injury incidence and the maturity of arthroscopic ACL and meniscus repair protocols. Stable reimbursement and extensive surgeon familiarity cement volume leadership. Hip arthroscopy, although smaller today, is growing at a 7.45% CAGR on wider recognition of femoroacetabular impingement and labral tears in younger athletes. Access-refining cannulas and flexible burrs mitigate the steep learning curve, opening the segment to more community hospitals. Shoulder and elbow scopes benefit from bio-inductive patch implants that cut re-tear rates, while endoscopic spine portals inch into mainstream as companies extend platforms to disc decompression. Collectively, procedure mix is tilting from diagnostic lavage to reconstructive repair, a shift that lifts average selling price across the arthroscopy devices market.
The arthroscopy devices market size for knee interventions is projected to advance steadily through 2031, supported by sports-related ligament repair and degenerative meniscus management. In contrast, hip procedures hold only a mid-teens share today but are forecast to command a materially larger slice of the arthroscopy devices market share as implants, pumps, and visualization systems adapt to deep-joint ergonomics. Varied joint adoption rates keep manufacturers investing in joint-specific shaver burrs, suture passers, and fixation anchors, reinforcing segmentation in their catalogs and service models.



By Product:
Implants Lead Value While Motorized Systems Drive InnovationImplants generated 32.12% of 2025 sales, reflecting premium pricing for bioabsorbable screws, knotless anchors, and collagen scaffolds that convert simple debridement cases into tissue-preserving reconstructions. Material science breakthroughs such as magnesium-alloy screws and PLLA-TCP composites improve integration and fade radiographically over time, appealing to younger demographics. Motorized shavers and resection systems, posting an 7.86% CAGR, capture surgeon demand for precision cutting and efficient cartilage contouring. Variable-speed consoles, smart-blade recognition, and integrated suction elevate OR throughput and safety.
Visualization towers remain the centerpiece of capital deals. Wireless camera heads reduce clutter, while 4K and impending 8K sensors sharpen anatomic detail, especially during micro-work inside the hip. Fluid-management pumps now feature closed-loop pressure control that prevents extravasation. RF ablation probes and plasma wands carve a niche in soft-tissue sculpting, whereas handheld instruments sustain a baseline of demand for basic grasping and probing tasks. End-to-end portfolio bundling allows leading firms to lock in long-term service contracts and upsell consumable packs, reinforcing their hold on the arthroscopy devices market.
By End User:
Hospitals Dominate While ASCs Accelerate AdoptionHospital operating rooms represented 68.02% of global revenue in 2025 owing to their capacity to manage multi-joint, multi-ligament cases and provide intensive perioperative care. Large IDNs negotiate bulk contracts that bundle implants, towers, and training, driving scale for top suppliers. The ambulatory segment, however, is growing faster at an 8.12% CAGR as payors push routine knee and shoulder scopes to lower-cost venues. CMS rate parity between ASCs and hospital outpatient departments heightens this shift, and equipment makers now release compact towers tailored to the space constraints of ASCs.
Orthopedic and sports-medicine clinics increasingly incorporate diagnostic nano-arthroscopy to deliver same-day answers and triage patients for surgery, adding a valuable referral stream. Digital monitoring platforms let these clinics track post-operative progress remotely, improving outcomes and patient loyalty. Segment dynamics reveal that procedure acuity rather than sheer volume determines facility choice, with high-complexity hip reconstructions still gravitating to tertiary hospitals, while single-ligament knee repairs migrate to outpatient settings.
Geography Analysis
North America Arthroscopy Devices Market
North America generated 42.05% of 2025 sales, underpinned by high training capacity, strong insurer coverage, and a population that remains physically active into older age. The United States drives most demand; Medicare’s 3.8% outpatient rate update sustains hospital margins while validating ASC migration. Canada’s single-payer model steadies annual procedure counts, and Mexico’s growing medical tourism market draws patients seeking lower-priced arthroscopic repair.
Europe Arthroscopy Devices Market
Europe ranks second in revenue, balancing strict regulation with a large base of skilled surgeons. The EU’s push for greener devices encourages early adoption of reusable shaver handpieces and recyclable tubing. Aging demographics feed hip and shoulder volumes, and national sports programs keep knee scopes common among younger cohorts. Clinical-outcome evidence requirements foster tight links between suppliers and academic centers that run prospective registries, strengthening the data core of the arthroscopy devices market.
APAC Arthroscopy Devices Market
Asia-Pacific is the fastest-growing region at a 6.39% CAGR. China’s centralized procurement lowers implant pricing, allowing wider hospital penetration. Domestic OEMs emerge, but international brands retain a technology edge in 4K visualization and navigation. Japan’s robotics leadership supports the rollout of AI-guided portals, and its super-aging society guarantees steady case growth. India’s public-private partnerships fund new arthroscopy labs, and government Make-in-India policies spur local assembly to lower import duties. Southeast Asian countries expand private insurance coverage, unlocking elective knee arthroscopy demand among a burgeoning middle class. Collectively, rising disposable income and improved hospital capacity translate into sustained volume gains across the arthroscopy devices market.

Regulatory Landscape
In the United States, key arthroscopy device categories such as arthroscopes are regulated by the FDA under 21 CFR Part 888 as Class II devices (commonly via the 510(k) premarket notification pathway), while some arthroscopic accessories are regulated as Class I devices with broader exemption from 510(k) requirements, depending on design and intended use. This structure keeps market entry feasible for incremental innovations (for example, specialized arthroscopes and component instruments) while still requiring manufacturers to demonstrate substantial equivalence and maintain post-market controls where applicable.
A major near-term compliance anchor is the FDA Quality Management System Regulation (QMSR), which takes effect on February 2, 2026 and incorporates ISO 13485:2016 into the US quality framework. In Europe, devices are governed by the EU Medical Device Regulation (EU) 2017/745 (MDR), where Annex VIII risk classification and Notified Body involvement (beyond Class I) drive higher documentation and clinical-evidence expectations. As a result, firms have placed more emphasis on established regulatory infrastructure and consistent QMS adoption across multinational arthroscopy portfolios.
Competitive Landscape
The sector shows moderate consolidation: the five largest vendors control roughly 55-60% of global turnover, leaving room for regional challengers and niche innovators. Strategic acquisitions target complementary assets—Karl Storz moved to absorb Asensus Surgical for its single-port robotics, while Stryker bought Artelon to strengthen soft-tissue augmentation. Portfolio integration remains the dominant playbook; firms now sell towers embedded with proprietary shavers, RF probes, and anchors that interlock both physically and digitally, reinforcing customer lock-in.
Innovation races center on wireless visualization, mixed-reality navigation, and recyclable instruments. Smith + Nephew leverages TESSA AR guidance to differentiate in ligament reconstruction, whereas Arthrex pushes nano-scopes into office settings. Johnson & Johnson MedTech combines its VELYS robotics with suture anchor lines to offer a cradle-to-graft ecosystem. Sustainability themes spur R&D into metal-polymer hybrid cannulas with up to 60% recycled content, appealing to European tenders.
Emerging entrants attack price-sensitive tiers, especially in Latin America and parts of Asia, with modular towers that accept generic shaver blades. Cloud-based analytics platforms surface intra-operative metrics that feed surgeon performance dashboards, creating data moats. To defend share, incumbents bundle training, outcomes tracking, and inventory management in service contracts. Overall, value hinges less on single-device superiority and more on ecosystem breadth, digital integration, and evidence-backed cost savings.
Arthroscopy Devices Industry Leaders
Arthrex Inc.
Conmed Corporation
Johnson & Johnson (DePuy Synthes)
Karl Storz GmbH & Co. KG
Richard Wolf GmbH
- *Disclaimer: Major Players sorted in no particular order
Arthroscopy Devices Market Companies Covered in this Report
- Arthrex
- Smiths Group
- Stryker
- Johnson & Johnson
- Conmed
- Zimmer Biomet
- Medtronic
- Karl Storz
- Olympus
- Richard Wolf
- Cannuflow Inc.
- Ceterix Orthopaedics
- Wright Medical Group
- Bioventus Inc.
- Parcus Medical
- JRF Ortho
- Fujifilm Holdings Corp.
- Aesculap (B. Braun)
- G2 Orthopedics

Market Opportunities and Future Outlook
Platform-led opportunities are expanding as major orthopedics players operationalize AI-assisted navigation and tracking technologies that connect implants, visualization, and enabling tech into a single workflow. In June 2026, DePuy Synthes announced US commercial availability of VELYS Hip Navigation with AI Assistance, highlighting momentum for intraoperative automation that can be bundled with procedure-specific implants and service contracts. The same direction shows up in enabling technologies: in May 2026, DePuy Synthes also announced an agreement to acquire Gemtrack miniature radiofrequency tracking technology (MinMaxMedical), supporting navigation approaches that reduce line-of-sight constraints and broaden use across varying OR setups.
There is also visible whitespace in procedure settings and product form factors where compact, workflow-efficient systems and newer fixation constructs can fit outpatient care pathways. Smith+Nephew reported first clinical cases with its next-generation CORI XT handheld robotics platform (June 2026), backing demand for smaller-footprint, procedure-enabling equipment that aligns with ASCs and high-throughput hospital units. On the implant side, Arthrex released the TightRope SB all-suture implant for ACL fixation (February 2026), reflecting continued conversion from metal and rigid fixation toward soft-tissue friendly constructs that can be packaged with arthroscopic instrumentation, shavers, and visualization systems for joint-specific procedural kits.
Recent Industry Developments in Arthroscopy Devices Market
- May 2026: DePuy Synthes announced a definitive agreement to acquire Gemtrack miniature radiofrequency tracking technology from MinMaxMedical for integration into the VELYS Enabling Tech Portfolio. The deal adds RF tracking capability that can complement existing navigation and workflow tools in orthopedics. It supports broader platform bundling across joint procedures where tracking robustness and OR flexibility influence adoption.
- March 2026: Conmed signed a definitive agreement to sell global distribution rights for its Duraclip, Precisor, and Optibite product lines to Micro-Tech Endoscopy. The transaction represents a portfolio realignment that narrows Conmed focus and reshapes competitive intensity in adjacent endoscopy categories. For arthroscopy suppliers and hospital buyers, it indicates continued prioritization of core franchises and potential shifts in commercial resources across surgical specialties.
- August 2024: Karl Storz completed the acquisition of Asensus Surgical, following stockholder approval. The deal strengthens Karl Storz in digital surgical solutions and complements its visualization heritage that also underpins arthroscopy equipment ecosystems. Expanded digital and connected-surgery capabilities can influence how visualization, instrumentation, and data workflows are packaged and sold to surgical accounts.


Arthroscopy Devices Market Report Scope and Research Methodology
Market Definition and Coverage
This market covers revenue generated from devices used to perform arthroscopy procedures, including scopes, visualization, fluid management, RF systems, and arthroscopic implants that support minimally invasive joint diagnosis and treatment.
Scope exclusions: open orthopedic surgical instruments, general endoscopy systems not used for arthroscopy, rehabilitation services, and pharmaceuticals are excluded from this sizing.
Segments Covered in This Report
- By Application
- Knee Arthroscopy
- Shoulder & Elbow Arthroscopy
- Hip Arthroscopy
- Spine Arthroscopy
- Foot & Ankle Arthroscopy
- Hand & Wrist Arthroscopy
- Other Applications
- By Product
- Arthroscopes (Reusable & Single-Use)
- Arthroscopic Implants
- Visualization Systems
- Fluid Management Systems
- RF Ablation Systems
- Motorized Shavers & Resection Systems
- Hand Instruments
- Other Products
- By End User
- Hospitals
- Ambulatory Surgical Centers (ASCs)
- Orthopedic & Sports Medicine Clinics
- Geography
- North America
- United States
- Canada
- Mexico
- Europe
- Germany
- United Kingdom
- France
- Italy
- Spain
- Rest of Europe
- Asia-Pacific
- China
- Japan
- India
- Australia
- South Korea
- Rest of Asia-Pacific
- Middle East & Africa
- GCC
- South Africa
- Rest of Middle East & Africa
- South America
- Brazil
- Argentina
- Rest of South America
- North America
Data Sources, Market Sizing, and Validation
Desk Research
Desk research was used to build a reliable fact base on procedure volumes, care settings, and adoption patterns across major regions before assumptions were set in the model. We referenced public health statistics and surveillance sources, including OECD health data, the World Health Organization, and national health agencies, to capture orthopedic and surgical utilization signals.
To ground the device and technology context, we also used sources such as the US FDA databases for device classifications and safety notices, the US International Trade Commission data for trade codes that can indicate cross-border device movement, and peer-reviewed orthopedic journals for procedure mix and clinical practice changes. Company annual reports, investor presentations, and reputable medical press were used to understand product positioning and pricing direction, and selected paid subscriptions were used for company financials, patent activity, and shipment-level trade checks where needed. The examples listed here are illustrative only, and many other sources were also reviewed to collect data, validate inputs, and clarify open questions.
Primary Interviews and Surveys
Primary work focused on speaking with a mix of device manufacturers, distributors, hospital procurement teams, ambulatory surgery centers, and orthopedic surgeons to confirm what is purchased per procedure and how pricing changes over time. Because this is a global market, interviews were spread across APAC, EMEA, and the Americas so reimbursement patterns, site-of-care shifts, and product preferences by region could be reflected in the final assumptions.
Distribution of primary research fieldwork respondents
| Company type | Respondent position | Region |
|---|---|---|
| Top tier: 39% | CXOs: 12% | APAC: 41% |
| Mid tier: 43% | Functional/Unit leaders: 37% | EMEA: 32% |
| Smaller Players: 18% | Managers: 51% | Americas: 27% |
Market-Sizing & Forecasting
Sizing started with a top-down build where arthroscopy demand is reconstructed from procedure volumes by joint, the share performed in hospitals versus ambulatory centers, and the typical device usage per case, and then converted into value using region-specific pricing assumptions. To keep totals realistic, we corroborated these results with selective bottom-up approximations using sampled supplier revenue ranges, distributor channel checks, and simple ASP times volume sanity tests for major product groups.
Key model inputs included orthopedic and sports injury incidence signals, arthroscopy procedure growth by age mix, adoption of single-use scopes and advanced visualization, average replacement cycles for capital equipment, and the share of cases using implants or RF systems. Where direct data was thin for smaller countries, gaps were handled through proxy procedure rates from similar health systems, followed by adjustments that were then rechecked in expert calls.
Forecasts were built using scenario analysis supported by trend lines for procedure growth and pricing, then stress-tested against expected reimbursement pressure, site-of-care migration, and technology upgrade cycles so the final growth path stayed practical and explainable.
Data Validation & Update Cycle
Outputs were checked against independent signals such as procedure trends, import patterns for relevant device categories, and reported revenue direction from major public companies before sign-off. If a large variance was seen in any region or product group, assumptions were revisited, and targeted follow-ups were triggered to recheck utilization, pricing, or mix.
Each report goes through multi-step analyst reviews where calculations, unit conversions, and currency handling are re-verified. Any unusual jumps were investigated until a clear reason was documented. Reports refresh annually, with interim updates for material events, followed by a final pre-delivery pass so clients receive the latest view.
Mordor Intelligence's Global Arthroscopy Devices Market Market Estimate Compared With Other Published Estimates
Published market sizes for arthroscopy devices often vary because the counted product basket is not always the same, and because procedure-linked demand is modeled with different utilization and pricing assumptions. Differences also show up when one publisher uses a different base year, currency conversion timing, or a faster update cycle during periods of product launches and care-setting shifts.
Some estimates roll a wider orthopedics toolkit into the number, and they may also treat adjacent endoscopy equipment as part of the same pool. Mordor Intelligence counts only arthroscopy-specific scopes, visualization, fluid management, RF systems, and arthroscopic implants that are tied back to procedure volumes and region-level price-mix checks.
Benchmark comparison
| Source | Market Size | Gaps in Research Methodology |
|---|---|---|
| Mordor Intelligence | USD 1.74 B (2025) | |
| Specialist Analytics Firm A | USD 8.82 B (2024) | Appears to use a broader scope that bundles arthroscopy devices with additional orthopedic tool categories, which increases the counted revenue pool. The base year is also different, and this shifts the stated market size even before forecasting assumptions are applied. |
| Healthcare Publisher B | USD 1.67 B (2024) | Uses a different base year and may apply more conservative assumptions for procedure growth, site-of-care mix, or pricing progression across regions. Limited clarity on how capital equipment versus disposables and implants versus instruments are treated can also change the final total. |
Across the three figures, the spread is mainly explained by scope differences and by how tightly the totals are anchored to procedure volumes and realistic pricing mixes that can be rechecked year to year. We keep the steps repeatable so clients can understand what is counted and why the number moves over time.


Key Questions Answered in the Report
What is the projected arthroscopy devices market size in 2031?
The arthroscopy devices market size is forecast to reach USD 2.42 billion by 2031, reflecting a 5.62% CAGR from 2026.
Which joint application currently dominates procedure volume?
Knee arthroscopy leads with 44.78% of 2025 revenues, owing to high meniscus and ligament injury prevalence.
Why are ambulatory surgical centers gaining share?
ASCs deliver arthroscopic procedures at 40-60% lower cost than hospital outpatient departments and benefit from expanding CMS reimbursement coverage.
Which product category grows fastest through 2031?
Motorized shavers and resection systems are projected to rise at an 7.86% CAGR on the back of precision cutting innovations.
What regional market records the highest growth rate?
Asia-Pacific posts the fastest expansion with a 6.39% CAGR, supported by healthcare investment, rising incomes, and broader access to minimally invasive surgery.
How are sustainability concerns shaping device design?
European regulations favor recyclable or hybrid instruments, prompting suppliers to develop reusable shaver handpieces and lower-impact packaging solutions.
Page last updated on:


 Your data is secure and never sold or shared.


