AI Video Analytics Market Size and Share
Market Overview
| Study Period | 2020 - 2031 |
|---|---|
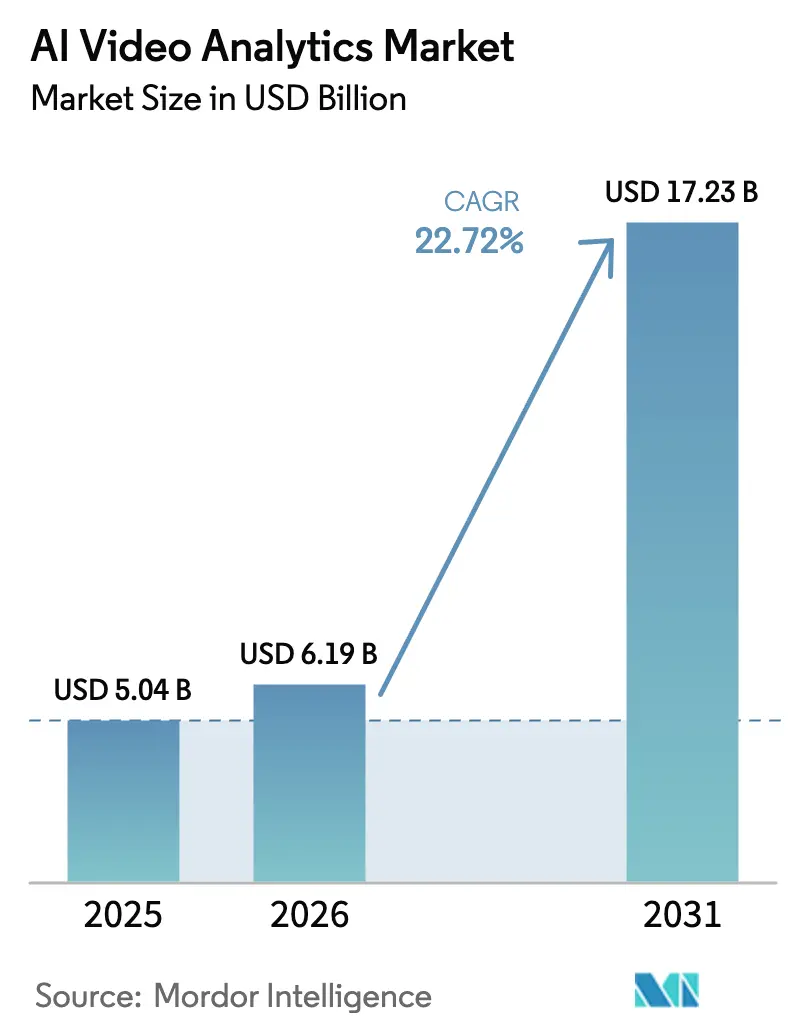
| Market Size (2026) | USD 6.19 Billion |
| Market Size (2031) | USD 17.23 Billion |
| Growth Rate (2026 - 2031) | 22.72% CAGR |
| Fastest Growing Market | Asia-Pacific |
| Largest Market | North America |
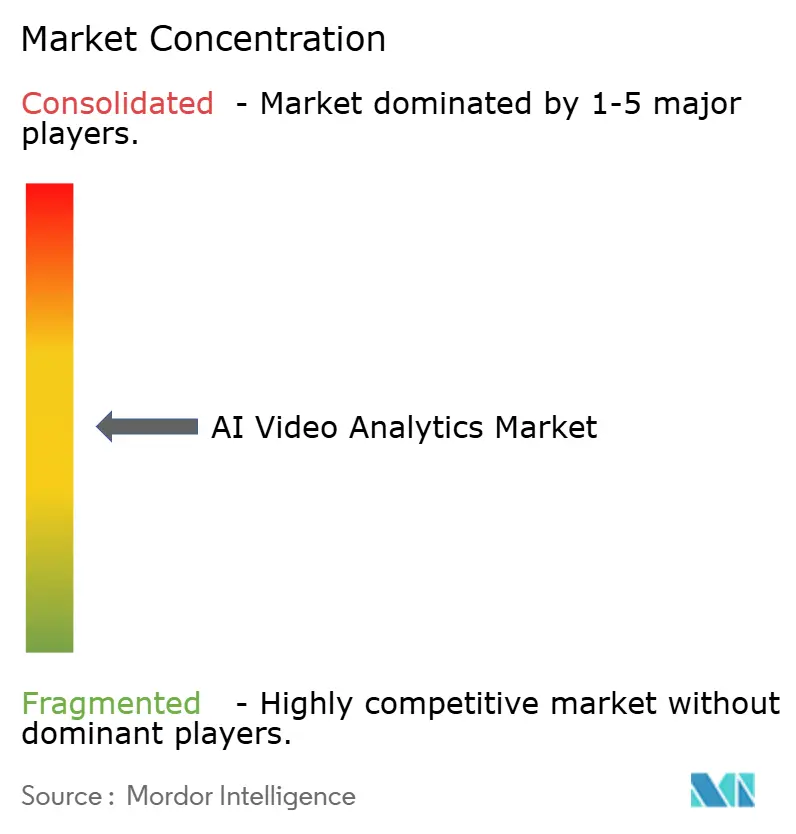
| Market Concentration | Medium |
Major Players *Disclaimer: Major Players sorted in no particular order Image © Mordor Intelligence. Reuse requires attribution under CC BY 4.0. | |
AI Video Analytics Market Analysis by Mordor Intelligence
The AI video analytics market size is projected to expand from USD 5.04 billion in 2025 and USD 6.19 billion in 2026 to USD 17.23 billion by 2031, registering a 22.72% CAGR between 2026 and 2031. Heightened smart-city spending, falling edge-AI chipset prices, and tighter privacy rules that move inference away from public clouds are reshaping procurement criteria. Software remains the revenue anchor, yet services are rising fastest as integration complexity and compliance audits strain in-house IT teams. Hybrid and edge architectures are closing the gap on cloud because traffic management, industrial inspection, and healthcare monitoring demand sub-100-millisecond response times. Vendors are responding with federated-learning modules and ISO/IEC 42001-aligned workflows to balance accuracy with privacy mandates.
Key Report Takeaways
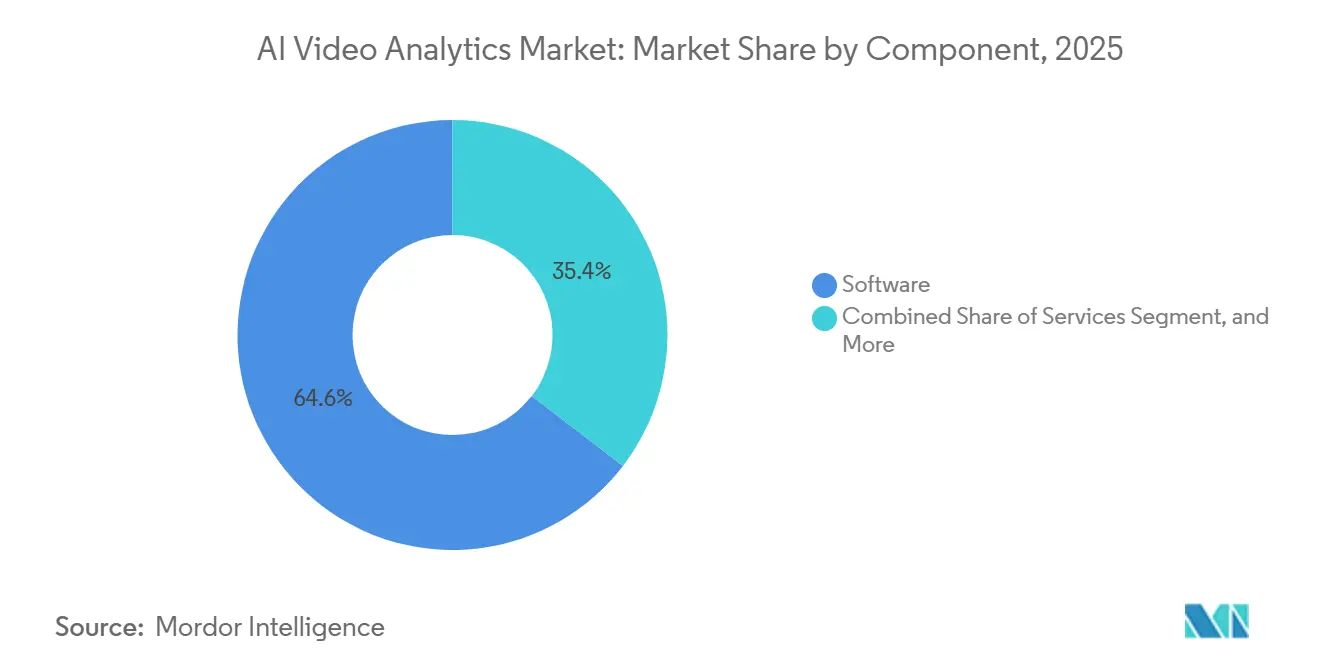
- By component, software led with 64.57% revenue share in 2025, whereas services are projected to grow at a 23.39% CAGR through 2031.
- By deployment mode, cloud accounted for 57.89% of the AI video analytics market share in 2025, while hybrid and edge architectures are forecast to expand at a 23.34% CAGR between 2026 and 2031.
- By analytics type, video content analytics accounted for 42.34% of 2025 sales, yet facial recognition is set to grow at a 23.72% CAGR through 2031.
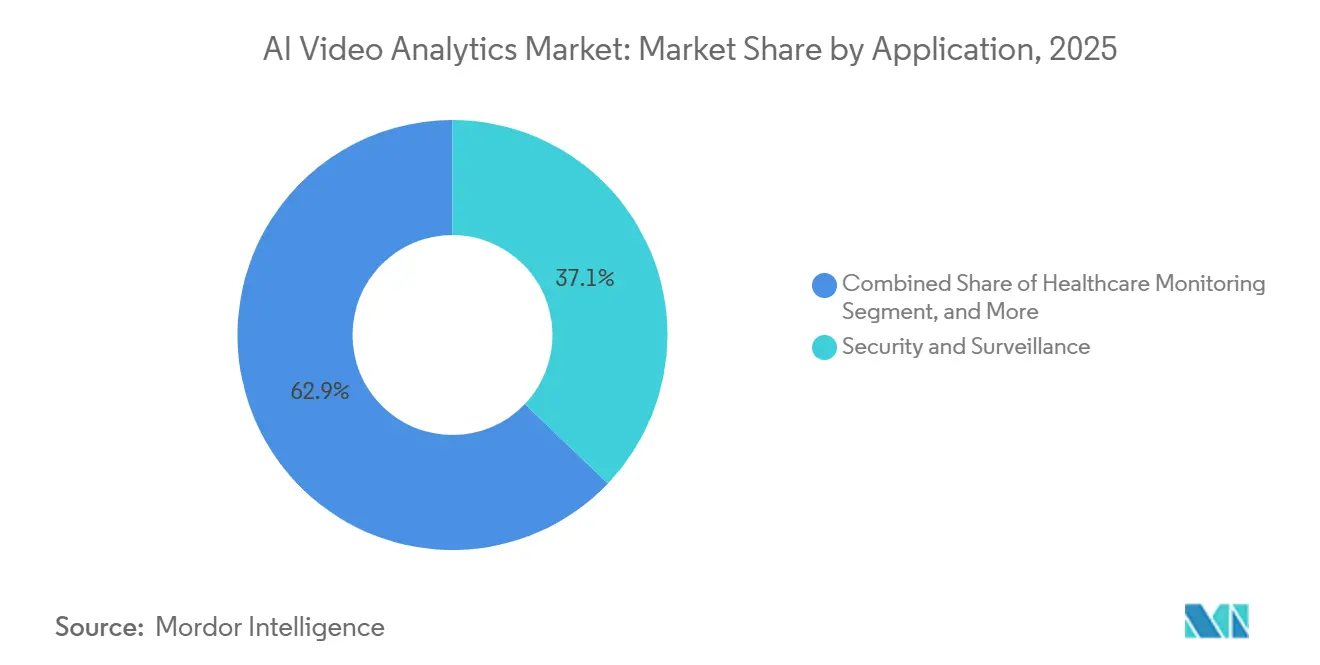
- By application, security and surveillance commanded 37.13% of the AI video analytics market share in 2025, although healthcare monitoring is expected to register a 23.91% CAGR over the forecast period.
- By end user, government and public safety accounted for 28.73% of the AI video analytics market share in 2025, while healthcare organizations are anticipated to post a 24.12% CAGR through 2031.
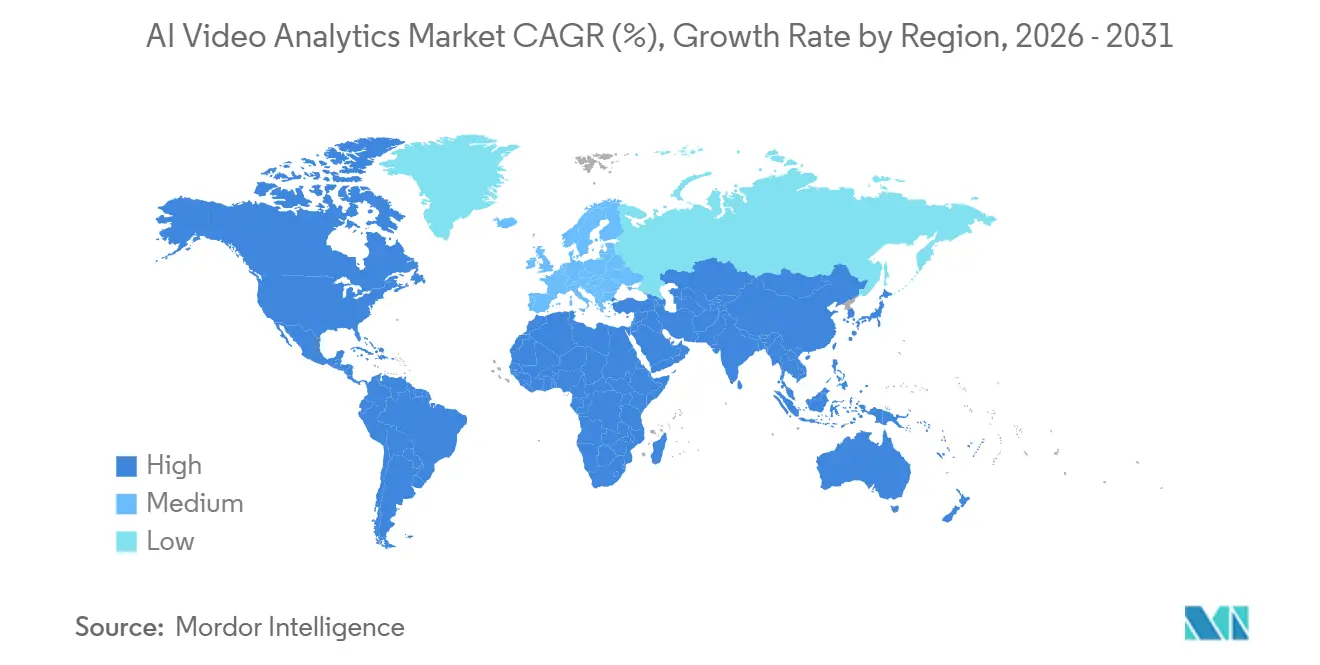
- By geography, North America captured 32.44% of 2025 revenue, whereas the Asia Pacific is projected to grow at a 23.77% CAGR during 2026-2031.
Note: Market size and forecast figures in this report are generated using Mordor Intelligence’s proprietary estimation framework, updated with the latest available data and insights as of 2026.
Global AI Video Analytics Market Trends and Insights
Drivers Impact Analysis*
| Driver | (~) % Impact on CAGR Forecast | Geographic Relevance | Impact Timeline |
|---|---|---|---|
| Integration of AI-equipped CCTV in Smart-City Projects | +4.2% | Asia Pacific core, spill-over to Middle East and South America | Medium term (2-4 years) |
| Rising Retail and E-commerce Demand for In-Store Behavior Analytics | +3.8% | North America and Europe, early adoption in urban Asia Pacific | Short term (≤ 2 years) |
| Proactive Threat Detection Amid Escalating Security Risks | +3.5% | Global, concentration in North America, Europe and Middle East | Short term (≤ 2 years) |
| Declining Cost of Edge-AI Chipsets | +4.1% | Global, accelerated uptake in Asia Pacific and South America | Medium term (2-4 years) |
| Legislation on Visual Process-Transparency in Industry | +2.3% | Europe and North America manufacturing hubs | Long term (≥ 4 years) |
| Privacy-Preserving Federated Learning Models | +2.9% | Europe and North America, gradual adoption in Asia Pacific | Medium term (2-4 years) |
| Source: Mordor Intelligence | |||
Integration of AI-Equipped CCTV in Smart-City Projects
Municipal programs are moving video analytics from basic surveillance to integrated city-operating platforms. Hangzhou’s City Brain handled more than 1 million video streams in real time by late 2025, optimizing traffic-light cycles and flagging illegal parking. India earmarked USD 1.2 billion in 2025 for AI-enabled surveillance across 100 cities, with edge inference mandated under the Digital Personal Data Protection Act.[1]Ministry of Housing and Urban Affairs India, “Smart Cities Mission Progress Report 2025,” smartcities.gov.in The United Arab Emirates awarded a USD 340 million contract to modernize camera networks in Dubai and Abu Dhabi, aiming to cut emergency-response times by 30% by 2027. Procurement is shifting toward multi-year platform deals that bundle hardware, software, and managed services, favoring vendors with strong systems integration practices.
Rising Retail and E-commerce Demand for In-Store Behavior Analytics
Brick-and-mortar chains use AI vision to track dwell time, heat maps, and shelf engagement, mirroring data granularity long enjoyed by e-commerce. Walmart reported a 15% drop in inventory loss after rolling out camera-based shrinkage analytics in 3,500 U.S. stores.[2]Walmart Inc., “Annual Report 2025,” sec.gov Carrefour’s 2025 deployment across 200 European hypermarkets aims to cut out-of-stock incidents by 20%. Tokyo pilots at 7-Eleven sites lifted same-store sales 7% by aligning stock with real-time demographic insights. Privacy objections under Europe’s GDPR are pushing retailers toward anonymous heat-mapping or consent-based biometric modules.
Proactive Threat Detection Amid Escalating Security Risks
Airports and transit hubs are replacing motion-detection cameras with AI systems that spot suspicious behavior and unattended objects. The U.S. Transportation Security Administration recorded a 40% fall in false alarms at 45 Category X airports after adopting AI analytics.[3]U.S. Transportation Security Administration, “AI-Powered Threat Detection Program Update,” tsa.gov London’s Underground network uses crowd-density models to prevent platform congestion, while Saudi authorities rely on AI cameras during Hajj to reduce medical incidents by 25%. Although predictive capabilities improve safety, demographic bias in facial algorithms, highlighted by NIST tests, remains under scrutiny.
Declining Cost of Edge-AI Chipsets
Price declines in inference accelerators are making on-device analytics viable for smaller organizations. NVIDIA shipped more than 2 million Jetson Orin modules in fiscal 2025 with average selling prices down 18% year-on-year. Intel cut cost-per-inference on its Movidius VPUs by 35% in 2025, widening use cases for sub-USD 200 smart cameras. Ambarella’s CV5 processors drove 60% growth in shipments of traffic and industrial cameras. Cheaper silicon democratizes adoption but forces vendors to compress neural networks, sometimes at the expense of accuracy.
Restraints Impact Analysis*
| Restraint | (~) % Impact on CAGR Forecast | Geographic Relevance | Impact Timeline |
|---|---|---|---|
| Data-Privacy Regulation Barriers to Facial Recognition | -2.8% | Europe and North America, emerging in Asia Pacific | Short term (≤ 2 years) |
| High Integration Cost With Legacy CCTV | -2.1% | Global, acute in Europe and North America | Medium term (2-4 years) |
| Model Bias and False-Positive Risk | -1.6% | Global, heightened scrutiny in North America and Europe | Medium term (2-4 years) |
| GPU Supply-Chain Volatility | -1.9% | Global, most severe in Asia Pacific and South America | Short term (≤ 2 years) |
| Source: Mordor Intelligence | |||
Data-Privacy Regulation Barriers to Facial Recognition
New laws are fragmenting biometric deployments. The European Union AI Act requires conformity assessments and human oversight for real-time public-space facial recognition, sharply limiting commercial rollouts. California’s 2025 biometric rules force opt-in consent, prompting some U.S. retailers to turn off facial modules. India’s 2025 data law adds privacy-impact assessments to all biometric processing. China amended its privacy law in 2024 to restrict facial analytics in residential complexes unless residents provide written consent. Resulting compliance costs slow adoption outside law-enforcement scenarios.
High Integration Cost With Legacy CCTV
Analog and first-generation IP cameras lack the horsepower, bandwidth, and cybersecurity safeguards required for AI inference. A 2025 International Association of Chiefs of Police survey found that 62% of U.S. agencies still use hardware that requires USD 800-1,200 in retrofits per camera. Upgrading the United Kingdom’s 5 million public-sector cameras would cost GBP 2.1 billion (USD 2.7 billion). Germany’s Federal Office for Information Security warns that layering AI onto outdated video-management systems creates vulnerabilities under the EU’s NIS2 Directive. Consequently, mature markets facing high retrofit bills adopt AI more slowly than greenfield builds in the Asia Pacific and the Middle East.
*Our forecasts treat driver/restraint impacts as directional, not additive. The impact forecasts reflect baseline growth, mix effects, and variable interactions.
Segment Analysis
By Component: Services Gain as Integration Complexity Rises
Software accounted for 64.57% of 2025 revenue, as platform licenses, analytics engines, and model libraries formed the core of most deployments. Services are expected to post a 23.39% CAGR to 2031, the highest across components, because enterprises rely on third-party integrators for model tuning, CCTV bridgework, and continuous compliance checks. Accenture found that 73% of organizations hired external experts for AI video rollouts lasting 9-14 months. The AI video analytics market size for services could therefore rival software by the end of the forecast period, shifting margin pools away from hardware. Hardware remains essential, especially where specialty thermal or multispectral cameras fetch premium pricing, but commoditization moderates growth.
Recognizing a skill shortage, enterprises are pivoting to services: A Deloitte report reveals that 68% of enterprises lack in-house AI vision capabilities. In response, vendors are increasingly bundling managed services with their hardware offerings. Meanwhile, ISO/IEC 42001 is gaining traction as a foundational certification for liability protection. With customers increasingly favoring outcome-based contracts, recurring revenue models are gaining momentum, further solidifying the dominance of services in the AI video analytics market.


By Deployment Mode: Hybrid and Edge Close the Gap on Cloud
Cloud deployment accounted for 57.89% of 2025 revenue, owing to elastic scaling and alignment with existing SaaS estates. Yet hybrid and edge solutions are forecast to grow at a 23.34% CAGR, narrowing the gap as smart-city traffic lights, factory inspection lines, and hospital wards require millisecond responses. The AI video analytics market share of hybrid architectures will expand further, as data-sovereignty rules discourage bulk video uploads. Microsoft reported Azure hybrid AI sales doubling in fiscal 2025, while AWS launched Panorama Appliance 2.0 for local processing.
Edge devices handle inference, pushing anonymized metadata to cloud dashboards that supervise model retraining and firmware updates, thereby satisfying GDPR minimization norms. On-premises stacks linger in defense and classified environments but grow slowly because sovereign clouds now meet many security stipulations. This two-tier design becomes the default blueprint for large-scale deployments in the AI video analytics market.
By Analytics Type: Facial Recognition Surges Despite Privacy Friction
Video content analytics object detection, motion, and scene analysis captured 42.34% of 2025 revenue and remains foundational. Facial recognition, however, is on track for a 23.72% CAGR owing to airport screening, bank fraud prevention, and automated access control. The AI video analytics market for facial recognition will continue to expand as regulatory clearance aligns with security funding, such as in U.S. ports, where 180 million travelers were processed in 2025. Crowd analytics are growing in retail and event safety, while gesture recognition is gaining healthcare traction in fall detection, steering around biometric constraints.
U.S. Homeland Security boasts matching accuracy rates exceeding 98.5%, leading to swift federal adoption. In contrast, the EU AI Act restricts facial recognition use strictly to law enforcement. In response, vendors are pivoting, offering solutions like post-event forensic modes and on-device encryption to localize personal data. This tug-of-war not only drives continuous innovation but also splinters product roadmaps across different jurisdictions.
By Application: Healthcare Monitoring Accelerates Amid Staffing Shortages
Security and surveillance still delivered 37.13% of 2025 sales, reflecting entrenched demand from public safety and retail loss prevention. Healthcare monitoring is projected to grow at a 23.91% CAGR as hospitals adopt video-based fall detection and vital-sign estimation to offset nursing shortfalls. The American Hospital Association noted 78% of U.S. hospitals faced critical nurse shortages in 2025. Germany’s approval of reimbursement for video fall-detection widens European uptake. As a result, the AI video analytics market size for healthcare could outpace security budgets in select OECD nations.
Traffic management, retail insights, and industrial inspections are experiencing significant growth, driven by advancements in technology and evolving market demands. Retail experiments are increasingly mirroring e-commerce analytics, leveraging data-driven strategies to enhance customer experiences and optimize operations. In the automotive sector, production lines are integrating AI vision systems to meet stringent zero-defect standards, ensuring higher quality and efficiency. Each sector places a strong emphasis on latency-free edge inference, which not only supports real-time decision-making but also strengthens hybrid system designs. This approach enables vendors to diversify their end-market exposure, positioning them to cater to a broader range of industries and applications.
By End-User: Healthcare Segment Leads Growth as Use Cases Diversify
Government and public safety users accounted for 28.73% of 2025 spending, driven by border control and citywide surveillance. Healthcare providers, however, are forecast to log a 24.12% CAGR, outpacing all others as reimbursement policies shift. The U.S. FDA cleared multiple AI video medical devices in 2025, and the WHO warns of a looming 10 million healthcare worker gap by 2030. These pressures prompt hospitals, nursing homes, and home health agencies to embed AI for patient safety and remote care.
Retailers, logistics firms, and manufacturers are increasingly adopting AI video analytics. In 2024, the National Retail Federation reported organized retail crime losses hitting USD 112 billion, spurring a heightened demand for offender detection. Manufacturers are using vision systems to promptly identify anomalies in welding or painting, helping them dodge expensive recalls. This broad-based demand shields the AI video analytics market from the budgetary fluctuations of any one sector.
Geography Analysis
North America generated 32.44% of 2025 revenue, supported by USD 1.2 billion in federal smart-city grants and retailer pilots that marry computer vision with point-of-sale data. Canada backed municipal deployments with CAD 85 million (USD 63 million) in grants. Mexico’s expanded C5 centers processed more than 50,000 concurrent feeds by late 2025. Widespread edge adoption positions the region for steady, though not fastest, growth.
Asia Pacific is expected to post the strongest CAGR of 23.77%. China had over 600 million AI-ready cameras by end-2025, integrated with national ID databases for real-time alerts. India’s Smart Cities Mission deployed AI video analytics in 82 cities, emphasizing edge inference for localization compliance. Japan is committed to AI-based crowd monitoring at major rail hubs to prevent falls. The region’s greenfield projects and large urban populations underpin the sustained expansion of the AI video analytics market.
Europe maintains sizable spending, but stricter privacy curbs slow facial recognition rollouts. Twelve German states paused pilots in 2025, awaiting AI Act guidance. The United Kingdom nonetheless awarded GBP 120 million for AI analytics in transport and critical infrastructure, with algorithmic transparency requirements. Middle Eastern initiatives under Vision 2030 continue despite GPU shortages that briefly stalled tenders. South America and Africa stay smaller as budget and skills gaps temper deployment speed, though cities like São Paulo and Lagos pilot traffic and safety systems.

Competitive Landscape
The top five vendors accounted for roughly 40-45% of 2025 revenue, indicating moderate concentration. Hikvision, Dahua, and Axis leverage camera footprints to bundle analytics but face margin compression as chip commoditization eases entry barriers. Pure-play software firms such as AxxonSoft and Vintra differentiate through retail, healthcare, and industrial models, often partnering with integrators to expand reach. Hyperscale clouds package pre-trained models for one-click adoption but lack the depth of customization for complex, regulated scenarios.
Strategic actions cluster around compliance, verticalization, and M&A. Bosch secured ISO/IEC 42001 certification in 2025, positioning it to court EU customers navigating the AI Act. Motorola Solutions bought Ava Security for USD 300 million to mesh AI video with its command-center suite. NEC landed JPY 12 billion (USD 80 million) in airport deals across India, Thailand, and Indonesia on the strength of its masked-subject accuracy ranking. Edge-optimized startups such as OpenCV.ai introduce federated learning frameworks to ease privacy concerns while still scaling sales through channel alliances.
In healthcare monitoring, retail analytics, and industrial inspection, specialized domain workflows continue to outperform generic vision stacks due to their tailored approach to specific industry needs. Vendors who integrate deep industry-specific expertise with ISO-aligned governance frameworks gain a significant competitive advantage. This is particularly critical as buyers increasingly prioritize not only accuracy but also the mitigation of liability and regulatory risks, which are becoming key decision-making factors in these sectors.
AI Video Analytics Industry Leaders
AxxonSoft Inc.
Axis Communications AB
Bosch Security Systems
Panasonic Holdings Corporation
NEC Corporation
- *Disclaimer: Major Players sorted in no particular order

Recent Industry Developments
- December 2025: Canon announced network cameras with built-in AI analytics surpassed 1 million units shipped globally, with highest demand in North America and Asia Pacific.
- November 2025: Gorilla Technology won a USD 8 million contract from Taiwan’s National Police Agency for traffic enforcement and stolen-vehicle analytics across 12,000 cameras.
- October 2025: Verint Systems partnered with a European retailer to pilot queue-management analytics in 150 stores across Germany and France targeting 30% shorter waits.
- September 2025: Panasonic launched its i-PRO Extreme AI camera series with on-device processing for up to five simultaneous analytics workloads.


Global AI Video Analytics Market Report Scope
The AI Video Analytics Market Report is Segmented by Component (Software, Hardware, Services), Deployment Mode (On-premises, Cloud, Hybrid/Edge), Analytics Type (Video Content Analytics, Facial Recognition, Crowd and Behavior Detection, Automatic Number-Plate Recognition, Gesture/Action Recognition), Application (Security and Surveillance, Traffic and Transportation Management, Retail Customer Insight, Industrial Quality Inspection, Healthcare Monitoring, Other Applications), End-User (Government and Public Safety, Retail and E-commerce, Transportation and Logistics, Manufacturing, BFSI, Healthcare, Other End-Users), and Geography (North America, South America, Europe, Asia Pacific, Middle East, Africa). The Market Forecasts are Provided in Terms of Value (USD).
| Software |
| Hardware |
| Services |
| On-premises |
| Cloud |
| Hybrid / Edge |
| Video Content Analytics |
| Facial Recognition |
| Crowd and Behavior Detection |
| Automatic Number-Plate Recognition |
| Gesture / Action Recognition |
| Security and Surveillance |
| Traffic and Transportation Management |
| Retail Customer Insight |
| Industrial Quality Inspection |
| Healthcare Monitoring |
| Other Applications |
| Government and Public Safety |
| Retail and E-commerce |
| Transportation and Logistics |
| Manufacturing |
| BFSI |
| Healthcare |
| Other End-Users |
| North America | United States | |
| Canada | ||
| Mexico | ||
| South America | Brazil | |
| Argentina | ||
| Rest of South America | ||
| Europe | Germany | |
| United Kingdom | ||
| France | ||
| Italy | ||
| Russia | ||
| Rest of Europe | ||
| Asia Pacific | China | |
| Japan | ||
| South Korea | ||
| India | ||
| Australia | ||
| Rest of Asia Pacific | ||
| Middle East and Africa | Middle East | United Arab Emirates |
| Saudi Arabia | ||
| Turkey | ||
| Rest of Middle East | ||
| Africa | South Africa | |
| Egypt | ||
| Rest of Africa | ||
| By Component | Software | ||
| Hardware | |||
| Services | |||
| By Deployment Mode | On-premises | ||
| Cloud | |||
| Hybrid / Edge | |||
| By Analytics Type | Video Content Analytics | ||
| Facial Recognition | |||
| Crowd and Behavior Detection | |||
| Automatic Number-Plate Recognition | |||
| Gesture / Action Recognition | |||
| By Application | Security and Surveillance | ||
| Traffic and Transportation Management | |||
| Retail Customer Insight | |||
| Industrial Quality Inspection | |||
| Healthcare Monitoring | |||
| Other Applications | |||
| By End-User | Government and Public Safety | ||
| Retail and E-commerce | |||
| Transportation and Logistics | |||
| Manufacturing | |||
| BFSI | |||
| Healthcare | |||
| Other End-Users | |||
| By Geography | North America | United States | |
| Canada | |||
| Mexico | |||
| South America | Brazil | ||
| Argentina | |||
| Rest of South America | |||
| Europe | Germany | ||
| United Kingdom | |||
| France | |||
| Italy | |||
| Russia | |||
| Rest of Europe | |||
| Asia Pacific | China | ||
| Japan | |||
| South Korea | |||
| India | |||
| Australia | |||
| Rest of Asia Pacific | |||
| Middle East and Africa | Middle East | United Arab Emirates | |
| Saudi Arabia | |||
| Turkey | |||
| Rest of Middle East | |||
| Africa | South Africa | ||
| Egypt | |||
| Rest of Africa | |||


Key Questions Answered in the Report
How fast is the AI video analytics market expected to grow through 2031?
The market is forecast to rise from USD 6.19 billion in 2026 to USD 17.23 billion by 2031, reflecting a 22.72% CAGR.
Which deployment mode will gain the most ground over the next five years?
Hybrid and edge architectures are projected to expand at 23.34% CAGR as latency-sensitive uses outpace cloud-only models.
Why are services outpacing software in revenue growth?
Enterprises lack in-house skills, so they purchase integration, model tuning and compliance services that are forecast to grow 23.39% CAGR to 2031.
Which application segment is advancing the quickest?
Healthcare monitoring leads with a 23.91% CAGR due to fall-detection and patient-safety rollouts amid global nurse shortages.
What is driving Asia Pacific’s leadership in growth?
Large-scale smart-city investments in China and India and favorable data-localization policies underpin a regional CAGR of 23.77%.
How concentrated is the competitive landscape?
The top five suppliers hold roughly 40-45% of revenue, indicating moderate concentration with space for vertical-focused challengers.
Page last updated on:


