
Glass Flake Coating Market Size and Share
Market Overview
| Study Period | 2021 - 2031 |
|---|---|
| Market Size (2026) | USD 1.82 Billion |
| Market Size (2031) | USD 2.27 Billion |
| Growth Rate (2026 - 2031) | 4.52 % |
| Fastest Growing Market | Asia Pacific |
| Largest Market | Asia Pacific |
| Market Concentration | Medium |
Major Players *Disclaimer: Major Players sorted in no particular order Image © Mordor Intelligence. Reuse requires attribution under CC BY 4.0. | |
Glass Flake Coating Market Analysis by Mordor Intelligence
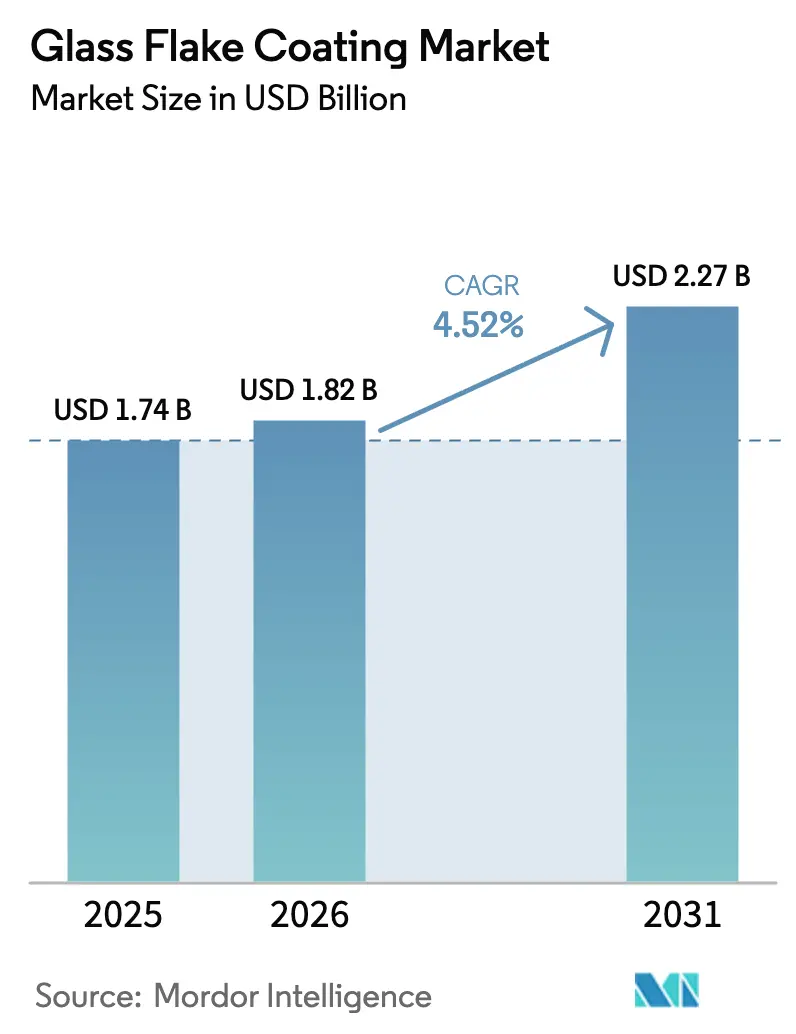
The Glass Flake Coating Market size is expected to grow from USD 1.74 billion in 2025 to USD 1.82 billion in 2026 and is forecast to reach USD 2.27 billion by 2031 at 4.52% CAGR over 2026-2031. Adoption accelerates as asset owners shift from lowest-bid procurement toward life-cycle cost modeling, recognizing that dense lamellar barriers defer maintenance and extend overall asset life. Oil and gas pipeline integrity programs, offshore wind foundation deployment, and chemical plant debottlenecking jointly underpin robust demand, while epoxy formulation advances reduce cure schedules and open new ambient-temperature application windows. Supply chains remain exposed to resin price swings, yet vertical integration and long-term offtake agreements by leading suppliers shield project timelines. Regional specialists that can satisfy ISO 17025 laboratory accreditation and ISO 12944-9 fingerprinting carve defensible niches alongside multinational incumbents.
Key Report Takeaways
- By substrate, steel accounted for 61.47% of the glass flake coating market share in 2025; concrete is expanding at a 5.82% CAGR through 2031.
- By resin, vinyl ester held 39.36% share in 2025, while epoxy is growing at the fastest 5.94% CAGR through 2031.
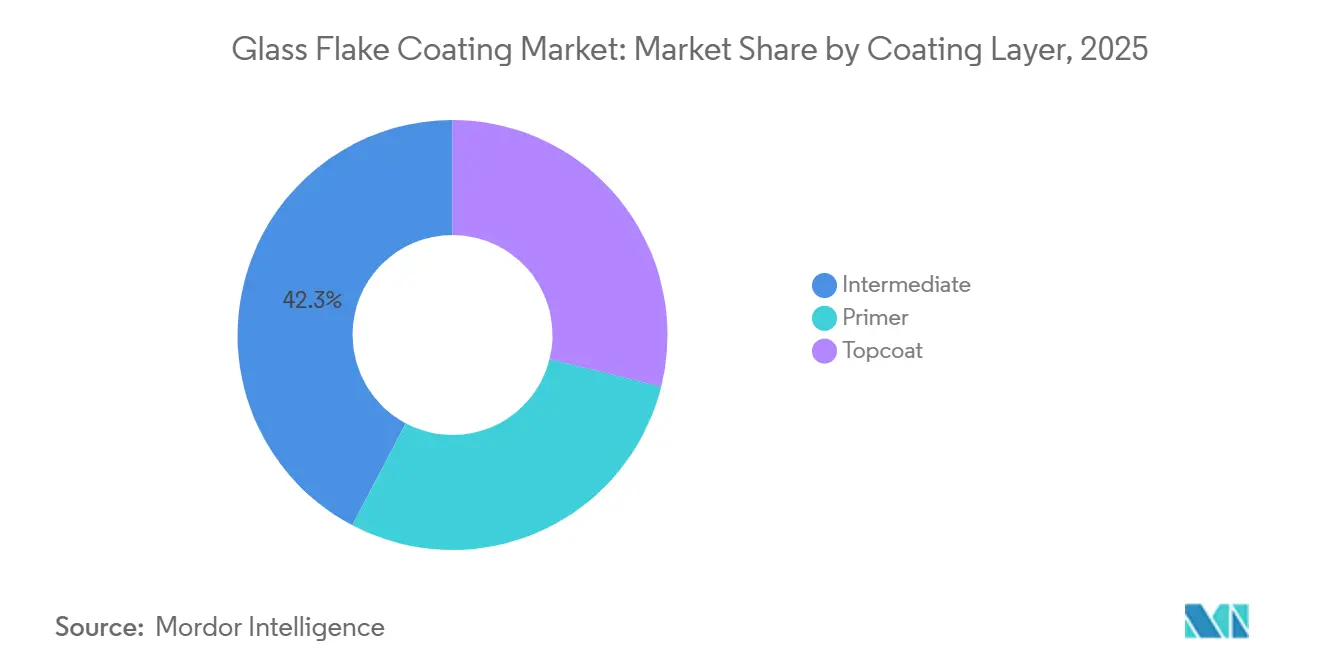
- By coating layer, intermediate coats led with 42.28% of the glass flake coating market size in 2025; topcoat is projected to rise at a 5.88% CAGR through 2031.
- By end-user industry, oil and gas commanded 37.54% share in 2025, whereas chemical processing is forecast to post the highest 5.97% CAGR to 2031.
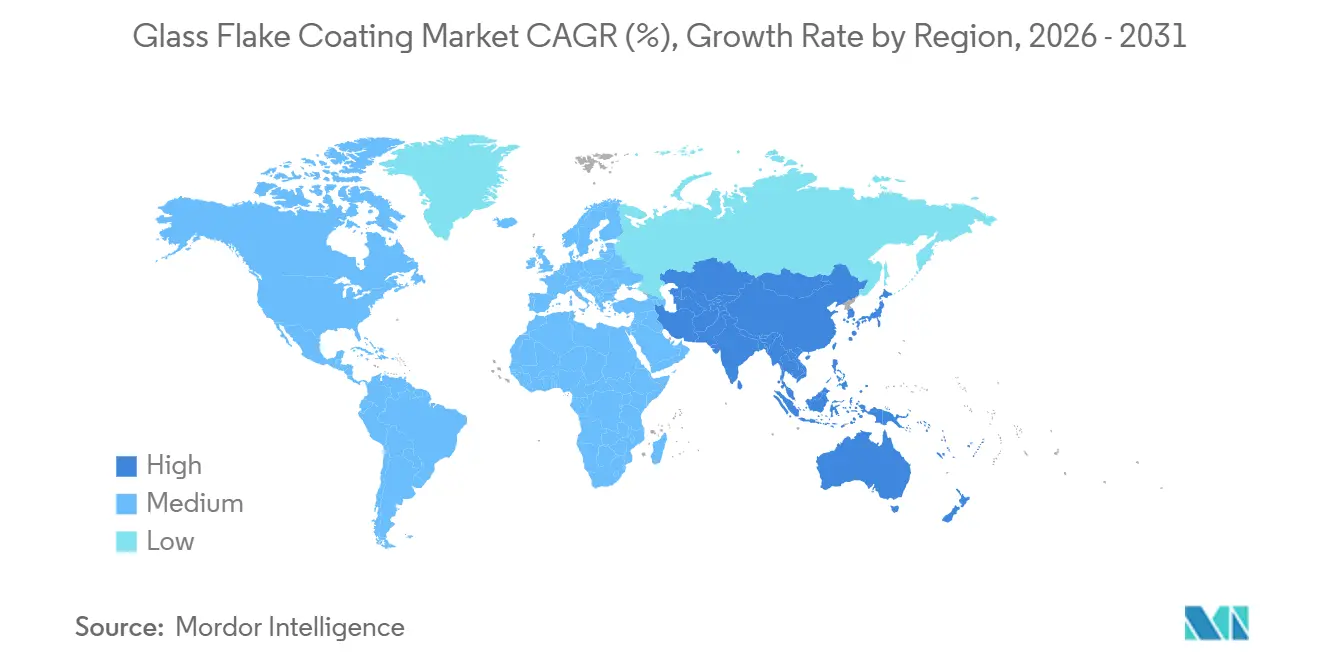
- By geography, Asia-Pacific commanded 46.31% share in 2025 and is forecast to post the highest 5.63% CAGR to 2031.
Note: Market size and forecast figures in this report are generated using Mordor Intelligence’s proprietary estimation framework, updated with the latest available data and insights as of January 2026.
Market Trends and Insights
Drivers Impact Analysis of Glass Flake Coating Market*
| Driver | (~) % Impact on CAGR Forecast | Geographic Relevance | Impact Timeline |
|---|---|---|---|
| Expanding Oil and Gas Pipeline Maintenance Activities | +1.2% | Global, with concentration in North America, Middle East, and Asia-Pacific | Medium term (2-4 years) |
| Severe Corrosion Challenges in Marine Infrastructure | +1.4% | Global, particularly Europe (offshore wind), Asia-Pacific (shipbuilding), and Middle East (offshore platforms) | Long term (≥ 4 years) |
| Rising Demand for High-Performance Coatings in Chemical Processing | +0.9% | Global, with early adoption in North America and Europe, expanding to Asia-Pacific | Medium term (2-4 years) |
| Stringent Environmental Regulations Driving Long-Life Protective Systems | +0.7% | North America and Europe (EPA VOC limits, ISO 12944), cascading to Asia-Pacific | Long term (≥ 4 years) |
| Shift Toward Life-Cycle Cost Modeling in Asset-Intensive Sectors | +0.8% | Global, led by Europe (offshore wind), North America (infrastructure), and Middle East (oil & gas) | Medium term (2-4 years) |
| Source: Mordor Intelligence | |||
Expanding Oil and Gas Pipeline Maintenance Activities
Pipeline operators are extending service life rather than replacing assets, elevating glass flake systems from premium options to baseline specifications under IOGP S-715, which prescribes 1,000 µm total dry film thickness and cyclic aging validation[1]. Energy Institute guidelines reinforce mandatory condition surveys and certified inspector oversight, adding a services multiplier to material demand. PHMSA enforcement in North America now links integrity digs to coating upgrades, particularly at girth welds where fusion-bonded epoxy is impractical. Qualification barriers rise as applicators must hold NACE or FROSIO Level III credentials and ISO 9001 systems, consolidating work among experienced contractors. As a result, the glass flake coating market benefits from specification-driven pull rather than discretionary spend.
Severe Corrosion Challenges in Marine Infrastructure
IMO PSPC mandates a 15-year ballast-tank coating life with zero blistering and a minimum 5 MPa adhesion threshold, benchmarks consistently met by multi-layer glass flake epoxy packages. A three-coat, 1,400 µm scheme surpassed thermal-sprayed aluminum under Arctic cyclic freeze testing, underscoring resilience in low temperatures. Jotun's Baltoflake polyester delivers 30-plus maintenance-free years in splash zones, and a DNV study pegged life-cycle cost savings at 50% relative to conventional epoxies. Offshore wind expansion adds thousands of monopiles and transition pieces that must meet ISO 24656 Type V glass-flake criteria, converting corrosion control into a material program line item. These dynamics lock glass flake solutions into vessel, jack-up, and foundation specifications worldwide.
Rising Demand for High-Performance Coatings in Chemical Processing
Plant managers leverage glass flake linings to tolerate hotter, more aggressive feeds without expensive alloy upgrades, cutting capital outlay by up to 50% on large reactors. Products such as Belzona 1523 allow continuous immersion at 140 °C, pushing barrier capability into territory once reserved for specialty metals. Advanced Polymer Coatings’ ChemLINE 784 competes by touting 85% volume solids and resistance to 98% sulfuric acid, intensifying R&D around cure speed and field repairability. Predictive integrity programs that quantify avoided shutdowns justify the upfront premium, embedding glass flake coatings within plant debottlenecking capital projects.
Stringent Environmental Regulations Driving Long-Life Protective Systems
The U.S. EPA caps industrial maintenance coating VOCs at 450 g/L, with exceedance fees discouraging solvent-rich formulas. High-solids glass flake epoxies meet limits but pose sprayability challenges that suppliers mitigate through exempt solvents and in-line heating rigs. EU directives link corporate carbon disclosure to product selection, giving low-VOC, long-life systems a compliance edge. ISO 12944 revisions introduce ≥ 25-year durability bands and integrate sustainability metrics, rewarding vertically integrated producers that disclose embodied carbon footprints. Consequently, environmental policy both narrows formulation latitude and elevates technical differentiation opportunities.
Restraints Impact Analysis of Glass Flake Coating Market*
| Restraint | (~) % Impact on CAGR Forecast | Geographic Relevance | Impact Timeline |
|---|---|---|---|
| Fluctuating Raw-Material and Resin Prices | -0.6% | Global, with acute impact in Asia-Pacific (resin production hubs) and Europe (energy-intensive manufacturing) | Short term (≤ 2 years) |
| Volatile Oil Prices Delaying CAPEX Cycles | -0.5% | Global, concentrated in Middle East, North America (shale), and offshore regions | Short term (≤ 2 years) |
| Application Complexity Requiring Skilled Workforce | -0.3% | Global, with acute shortages in North America and Europe; emerging in Asia-Pacific | Medium term (2-4 years) |
| Source: Mordor Intelligence | |||
Fluctuating Raw-Material and Resin Prices
Unsaturated polyester resin prices in China moved downward by 100-200 CNY per t in early 2024, but epoxy prices in the United States swung 14% month-over-month due to bisphenol-A outages and port congestion, compressing gross margins and complicating bid validity windows. Large vendors hedge through multi-year supply contracts, yet regional players pass volatility downstream, eroding competitiveness on fixed-price tenders. Energy-intensive glass flake production adds another variable, tying cost curves to LNG and electricity prices across Europe.
Volatile Oil Prices Delaying CAPEX Cycles
Brent falling below USD 70/bbl in late 2024 postponed multiple Gulf Coast petrochemical expansions and North Sea platform overhauls, deferring coating demand by 6-12 months[2]. During downturns, owners revert to lowest-price procurement, temporarily favoring standard epoxies. Suppliers with multi-market factories, such as PPG’s USD 300 million Tennessee plant, absorb the shock by redeploying capacity to automotive or construction volumes.
*Our forecasts treat driver/restraint impacts as directional, not additive. The impact forecasts reflect baseline growth, mix effects, and variable interactions.
Glass Flake Coating Market Segment Analysis
By Substrate:
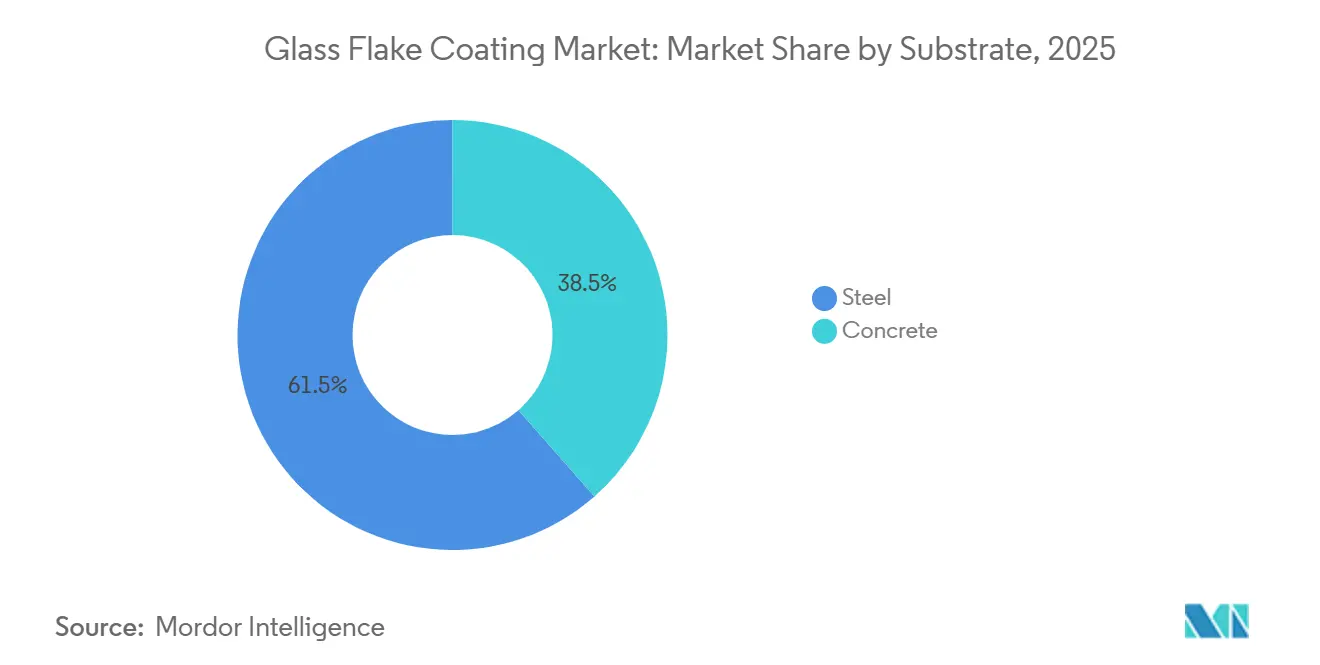
Steel Dominance Reflects Infrastructure LegacySteel contributed 61.47% of the glass flake coating market size in 2025 on the strength of global pipeline networks, offshore platforms, tanker hulls, and process vessels. Lamellar flakes orient parallel to steel substrates, delivering diffusion paths up to 20 times longer than neat resin and meeting NORSOK M-501 splash-zone performance levels. Contractors and inspectors are trained almost exclusively on steel protocols, reinforcing the substrate’s hegemony. Coupling specifications with qualified workforce availability makes steel’s dominance self-reinforcing over the forecast period.
Concrete trails but advances at a 5.82% CAGR as Asia-Pacific infrastructure owners adopt glass flake epoxies to arrest chloride ingress in bridges and wastewater assets. ACI PRC-515.2-13 lists vinyl ester and epoxy coatings for high-acid environments, provided surface moisture and profile are tightly controlled. The higher porosity of concrete necessitates vapor-permeable primers or embedded scrims to mitigate blister risk, favoring turnkey suppliers that bundle surface preparation, primer, and overcoat warranties.
By Resin:
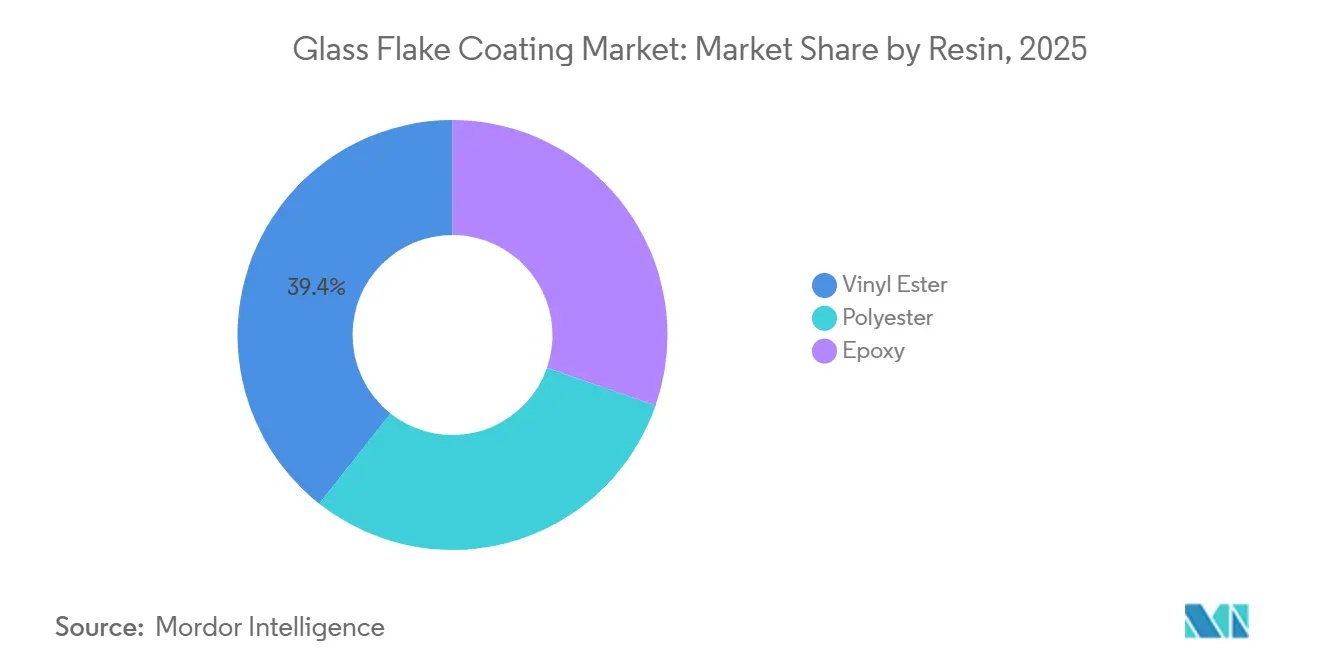
Vinyl Ester Incumbency Versus Epoxy InnovationVinyl ester retained 39.36% of the glass flake coating market share in 2025, supported by decades of splash-zone field performance under IOGP and IMO rules. Pre-approved formulations and known cathodic-disbondment behavior reduce owner risk in seawater immersion. However, epoxy is outpacing at a 5.94% CAGR through 2031 thanks to high cross-link densities and ambient cures that narrow historical performance gaps. Epoxies also bond better to marginally prepared steel, expanding retrofit suitability. Polyester remains confined to cost-sensitive construction applications, where 10-15-year service life suffices.

By Coating Layer:
Intermediate Coats Drive System ThicknessIntermediate captured 42.28% of the glass flake coating market size in 2025 because IMO PSPC and NORSOK M-501 demand total dry film thickness of 1,000 µm or more. These mid-layers embed glass flakes to provide impermeability and mechanical strength, while primers focus on adhesion and topcoats on UV resistance. Topcoats nonetheless post a 5.88% CAGR as offshore wind and bridge projects specify color-stable polyurethane or polysiloxane finishes to reduce survey frequency. System suppliers that integrate all three layers under a single warranty capture specification preference.
By End-user Industry:
Oil and Gas Sets Performance BenchmarksOil and gas dominated with a 37.54% share in 2025, and its rigorous qualification regimes cascade into marine, chemical, and infrastructure procurement. Field data collected under API 579 fitness-for-service assessments continually validate long-term barrier performance, reinforcing reliance on glass flake packages. Chemical processing, rising at a 5.97% CAGR, deploys glass flake linings to handle hot acids and solvents without exotic alloy retrofits, exemplified by ChemLINE 784 and Protecto-Coat EPG installations. Marine adoption remains tethered to IMO compliance, but offshore wind is emerging as a parallel volume driver.

Geography Analysis
APAC and North America Glass Flake Coating Market
Asia-Pacific commanded 46.31% of the glass flake coating market in 2025 and will expand at a 5.63% CAGR, led by Chinese pipeline buildouts, Indian refinery upgrades, and Southeast Asian LNG terminals that cluster in high-chloride coastal zones. Multinational suppliers leverage Singapore-based training centers and ISO 17025 labs to navigate fragmented ASEAN regulations, securing bulk orders ahead of local challengers. North America's demand is supported by PHMSA-driven pipeline integrity digs and federally funded bridge preservation that embed life-cycle cost methodology. The new PPG Tennessee facility, operational in 2026, provides regional buffer stock that reduces lead time for Gulf Coast turnarounds.
EMEA and South America Glass Flake Coating Market
Europe is seeing growth, with ScotWind and INTOG foundations alone adding an addressable demand of more than 2,000 monopiles through 2035. The CoaST program's waterborne advances aim at lowering carbon footprints and application complexity, aligning with EU Green Deal objectives. South America and the Middle East and Africa show upside from Brazilian pre-salt FPSOs and Saudi refinery upgrades, constrained by skilled labor shortages and inconsistent standard enforcement.
Regulatory Landscape
Glass flake coating regulation is increasingly tied to chemical controls and emissions limits that push formulations toward higher-solids systems and stricter substance stewardship. In the United States, the EPA finalized amendments in January 2025 to the National Volatile Organic Compound (VOC) Emission Standards for Aerosol Coatings under the Clean Air Act, adding specialty categories with reactivity-based limits (including Two Component Coatings). This increases compliance pressure on solvent-borne maintenance products used in industrial and marine touch-up operations.
In Europe, EU REACH developments are increasing documentation and material traceability requirements across coating supply chains. Under REACH Annex XVII (Entry 78) on synthetic polymer microparticles, the first annual reporting obligation to ECHA began in 2026 for certain industrial uses (including feedstock-related pellets, flakes, and powders), prompting manufacturers and downstream users to set up emissions estimation and reporting processes. In parallel, ECHA SEAC published a draft opinion in March 2026 on the proposed EU-wide restriction of PFAS, raising the need to screen and, where necessary, reformulate additive packages used in high-performance anticorrosion systems.
Value Chain Analysis
The value chain starts with upstream supply of glass flake platelets (specialty producers such as Glassflake Group), alongside resin systems (epoxy, vinyl ester, polyester), curing agents, rheology modifiers, and pigments. Coating manufacturers and formulators (including global suppliers such as Jotun, Hempel, PPG, AkzoNobel, and Sherwin-Williams, plus regional specialists) compound these inputs using controlled high-shear dispersion to achieve target flake size distribution and loadings. They then qualify products to performance regimes used in offshore and marine environments.
On the downstream side, sales flow through direct-to-project channels for large oil and gas, marine, and chemical assets, as well as contractor networks that bundle surface preparation, application, and inspection services. Execution capability is a key constraint in the chain, since performance depends on achieving specified total dry film thickness and the correct flake orientation during application. This increases reliance on trained applicators and third-party inspection. Asset owner requirements and standards-linked qualification frameworks (for example, IMO and NORSOK-linked specifications) also raise entry barriers, while larger suppliers reduce volatility exposure through vertical integration and longer-term sourcing agreements for resins and other critical intermediates.
Competitive Landscape
The top five suppliers - Jotun, Hempel, PPG, Sherwin-Williams, and AkzoNobel - collectively control roughly 65% of global revenue, signalling moderate fragmentation that leaves space for niche specialists. Type approval for IMO and NORSOK systems raises entry barriers, yet regional firms with ISO 17025 labs and certified applicator networks - such as Chugoku Marine Paints and KCC - win local projects by offering agile technical support. Strategic thrusts concentrate on vertical integration; AkzoNobel's industrial excellence roadmap targets EUR 250 million in profit through supply-chain optimization by 2027. Digital twins like Jotun HullSkater and AkzoNobel Aerofleet capture application data, enabling predictive maintenance contracts that convert coatings into service revenues. Disruptive research explores graphene or ceramic platelet fillers promising equal barrier performance at lower density, but the absence of multi-decade field history slows specification acceptance.
Glass Flake Coating Industry Leaders
-
Akzo Nobel N.V.
-
PPG Industries, Inc.
-
Jotun A/S
-
The Sherwin-Williams Company
-
Hempel A/S
- *Disclaimer: Major Players sorted in no particular order

Glass Flake Coating Market Companies Covered in this Report
- Akzo Nobel N.V.
- Asian Paints PPG Pvt. Ltd.
- BASF
- Berger Paints India
- Carboline (RPM International)
- Chemco International Ltd
- Chugoku Marine Paints Ltd.
- Hempel A/S
- Induron
- Jotun A/S
- KCC Corporation
- Nippon Paint Holdings
- Polyglass Coatings
- PPG Industries, Inc.
- Teknos Group
- The Sherwin-Williams Company
- Tnemec
Market Opportunities and Future Outlook
The strongest opportunities are in segments where owners face high corrosion exposure, high downtime costs, and tighter compliance constraints, since long-life barrier systems are easier to justify in procurement. Offshore wind foundations and marine infrastructure programs that reference ISO-based durability frameworks, along with oil and gas integrity programs that specify thick-film protective systems (for example, IOGP S-715 calling out 1,000 micrometers total dry film thickness), support adoption of qualified glass flake packages on steel-intensive assets. In China, the existence of a dedicated offshore glass flake painting standard (CB/T 4340-2013) provides a defined pathway for specifying and inspecting these systems on offshore steel structures.
Commercial differentiation is increasingly tied to environmental constraints and faster maintenance cycles. EU REACH reporting obligations for synthetic polymer microparticles that commenced in 2026 create near-term demand for improved material traceability and emissions accounting across raw materials and finished coatings sold into Europe, favoring suppliers that can document composition and support compliance data flows for customers. On the product side, suppliers are pushing high-solids and solvent-reduced systems alongside repair-focused solutions, including Sherwin-Williams positioning Dura-Plate SW-501 GF to meet NORSOK M-501 requirements and offering Repacor SW-1000 as a glass flake, two-component polyaspartic repair putty for offshore maintenance workflows. These product moves indicate continued demand for faster turnaround and lower-VOC pathways without stepping down corrosion performance.
Recent Industry Developments in Glass Flake Coating Market
- May 2026: Akzo Nobel N.V. commenced commercial rollout in Australia of an Interzone 954 protective coating variant enhanced with Sparc Technologies' ecosparc graphene additive. The rollout pairs an established heavy-duty protective platform with an advanced additive system to lift durability claims for harsh-service assets, reinforcing premium positioning in marine and energy maintenance specifications.
- March 2026: PPG Industries Inc. launched PPG SIGMASHIELD 950 and PPG SIGMASHIELD 899 GF, glass flake epoxy coatings positioned for offshore energy and industrial corrosion protection and aligned to NORSOK M-501:2022 requirements. By tying new product introductions directly to a widely referenced offshore performance framework, PPG improved its bid fit for qualified projects where type-tested systems and documented performance are gating factors.
- June 2025: Steelpaint GmbH reported long-term performance success for its Stelpant PU Combination 500 one-component coating following a trial on fiber-reinforced plastic and glass flake structures in an industrial wastewater tank application. The validation supports broader consideration of 1K maintenance coatings for corrosive water infrastructure, where simplified application and reduced downtime can affect contractor selection.
Glass Flake Coating Market Report Scope and Research Methodology
Market Definition and Coverage
For this study, the glass flake coating market is defined as the value of protective coating systems where plate-like glass flakes are used in a resin matrix to improve barrier performance against corrosion, chemicals, and water ingress across industrial assets.
Scope exclusions: Decorative glass coatings, architectural coated glass products, and glass flake filler sales that are not sold as part of a coating system are excluded.
Segments Covered in This Report
- By Substrate
- Steel
- Concrete
- By Resin
- Vinyl Ester
- Polyester
- Epoxy
- By Coating Layer
- Intermediate
- Primer
- Topcoat
- By End-user Industry
- Oil and Gas
- Marine
- Chemical Processing
- Industrial
- Construction
- Other End-user Industries
- By Geography
- Asia-Pacific
- China
- India
- Japan
- South Korea
- ASEAN Countries
- Rest of Asia-Pacific
- North America
- United States
- Canada
- Mexico
- Europe
- Germany
- United Kingdom
- France
- Italy
- NORDIC Countries
- Rest of Europe
- South America
- Brazil
- Argentina
- Rest of South America
- Middle-East and Africa
- Saudi Arabia
- South Africa
- Rest of Middle East and Africa
- Asia-Pacific
Data Sources, Market Sizing, and Validation
Desk Research
Desk research was used to set the market boundaries and build the first set of demand and supply indicators for corrosion protection coatings that use glass flakes. We relied on public sources that help explain industrial coating consumption patterns and end-user activity, such as USGS minerals and materials data, UN Comtrade trade statistics, OECD industrial indicators, Eurostat production series, and NACE or NAICS classification notes that support like-for-like comparisons.
We also reviewed technical and regulatory references that influence specification-driven demand, such as NACE International and ISO coating standards, plus peer-reviewed journals on barrier coatings, permeation, and corrosion testing. To connect these signals to company-level execution, we screened annual reports, investor presentations, and reputable press coverage on maintenance cycles in marine, oil and gas, chemical processing, and infrastructure. Where needed, patent databases were used to track formulation directions and resin system improvements over time. The desk sources listed above are illustrative, and we consulted additional public and subscription sources to collect data, cross-check assumptions, and clarify open questions.
Primary Interviews and Surveys
Primary work focused on validating how glass flake coatings are specified, purchased, and applied in the field, since volume tracks surface area, film build, and maintenance intervals more closely than unit counts. We spoke with a mix of coating formulators, applicators, asset owners, and distribution participants across major regions so pricing, resin mix shifts, and project timing could be reconciled with what is visible in public data.
Distribution of primary research fieldwork respondents
| Company type | Respondent position | Region |
|---|---|---|
| Top tier: 38% | CXOs: 13% | APAC: 43% |
| Mid tier: 42% | Functional/Unit leaders: 30% | EMEA: 36% |
| Smaller Players: 20% | Managers: 57% | Americas: 21% |
Market-Sizing & Forecasting
Sizing starts with a top-down build that reconstructs the addressable coating spend using industrial maintenance and new-build activity in corrosion-exposed assets, then applies penetration assumptions for glass flake systems where high barrier performance is typically specified. To keep totals realistic, we run selective bottom-up checks using sampled pricing and consumption logic, such as square meters coated by end-use, typical dry film thickness ranges, coat system layers, and observed material usage per project.
Key inputs used in the model include offshore and marine maintenance cadence, oil and gas pipeline and tank refurbishment activity, chemical processing capacity additions and shutdown cycles, resin price movements that influence formulated coating ASPs, and regional construction or infrastructure renewal signals that correlate with protective coating demand. When data is sparse for smaller countries, we handle gaps by proxying from closely comparable industrial bases and then adjusting using interview feedback on specification intensity.
Forecasts are derived using scenario analysis supported by simple time-series smoothing on the stable variables, then stress-tested using expert views on project pipelines and maintenance deferrals. Where leading indicators diverge, we revisit assumptions until the implied volumes and pricing trends align with practical application rates described by field respondents.
Data Validation & Update Cycle
Outputs are cross-checked against independent signals so the final numbers do not depend on any single assumption. We run variance checks across regions, compare implied coating volumes against industrial activity measures, and review outliers that can appear due to one-time megaprojects, currency shifts, or resin cost spikes.
Before sign-off, the model and the written insights are reviewed in multiple steps, and follow-up outreach is triggered when interview inputs conflict with desk signals or when a large mismatch shows up in the regional splits. Reports are refreshed annually, with interim updates when material events occur, such as major regulatory changes, sharp feedstock price moves, or sudden project slowdowns. Right before delivery, a final pass is completed so clients receive the most current view available.
Mordor Intelligence's Glass Flake Coating Market Estimate Compared With Other Published Estimates
Published market numbers for glass flake coatings do not always match because the included product set and the unit of measure behind the value build can differ across sources. Gaps also come from how pricing is treated, since some estimates assume uniform coating prices while others reflect resin system mix shifts and the effect of high-build specifications.
In our checks, the widest spread usually appears when adjacent protective coating categories are counted, or when glass flake filled primers and general anti-corrosion coatings are bundled into the same total. The table points to this issue, where counting only glass flake coating systems sold for industrial barrier and corrosion protection applications, and refreshing ASPs using resin-linked inputs, helps explain the tighter 2025 value shown by Mordor Intelligence.
Benchmark comparison
| Source | Market Size | Gaps in Research Methodology |
|---|---|---|
| Mordor Intelligence | USD 1.74 B (2025) | |
| Trade Journal A | USD 1.70 B (2024) | Uses a different base year and appears to smooth pricing, which can understate value when high-build epoxy and vinyl ester systems gain share in industrial maintenance cycles. |
| Global Consultancy B | USD 1.41 B (2025) | Likely applies a narrower demand pool closer to coatings sold into select end uses, and may exclude multi-layer system consumption tied to film build and recoat intervals, which reduces the implied market value. |
Overall, the differences are mostly explained by what is counted as a glass flake coating system and how price and consumption are converted from field usage into dollars. When scope is kept consistent and key variables like film build, resin mix, and maintenance timing are checked with practitioners, the final number becomes easier to trace and repeat from year to year.
Key Questions Answered in the Report
How fast is the glass flake coating market expected to grow through 2031?
The market is projected to expand at a 4.52% CAGR, moving from USD 1.82 billion in 2026 to USD 2.27 billion by 2031.
Which end-user industry segment drives specifications in this space?
Oil and gas leads specifications, holding 37.54% revenue share in 2025 and influencing standards like IOGP S-715 and NORSOK M-501.
Why are epoxies gaining share against vinyl esters?
New high-crosslink epoxies cure at ambient temperatures, approach vinyl ester impermeability, and are projected to post a 5.94% CAGR through 2031, the fastest among resins.
What geographic region offers the highest growth potential?
Asia-Pacific combines 46.31% share with a 5.63% CAGR, buoyed by pipelines, refineries, and offshore wind builds in China, India, and ASEAN.