Germany Dairy Market Size and Share
Market Overview
| Study Period | 2021 - 2031 |
|---|---|
| Forecast Data Period | 2026 - 2031 |
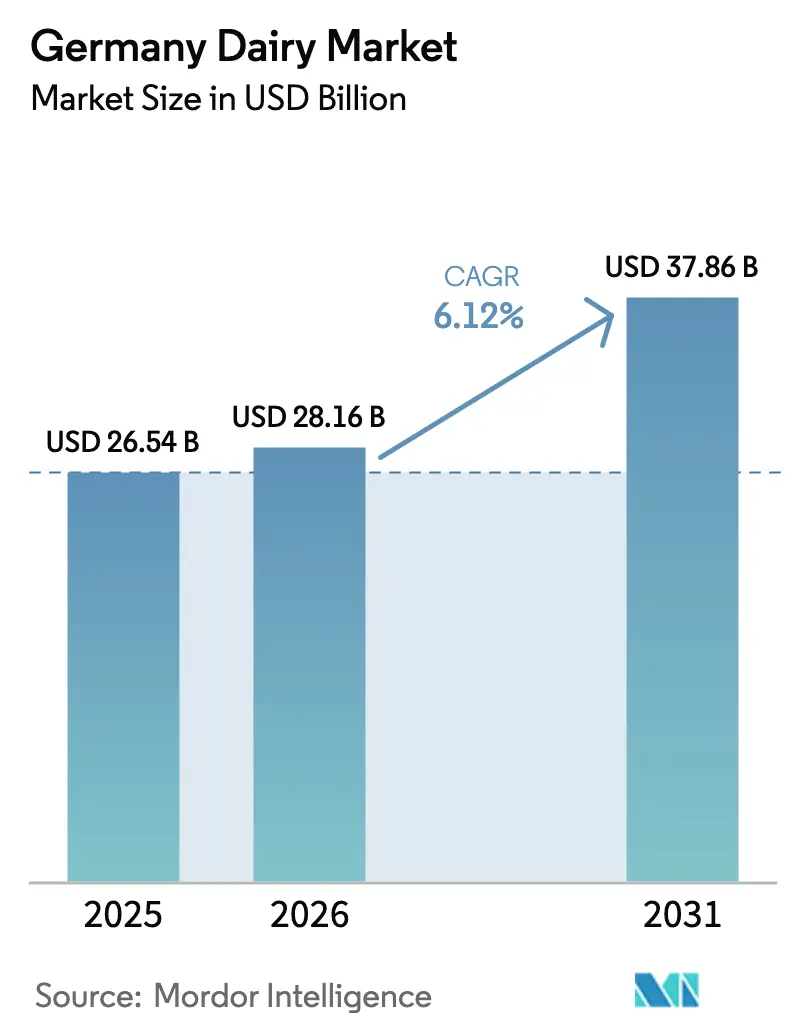
| Base Year Market Size (2025) | USD 26.54 Billion |
| Market Size (2026) | USD 28.16 Billion |
| Market Size (2031) | USD 37.86 Billion |
| Growth Rate (2026 - 2031) | 6.12% CAGR |
| Market Concentration | Medium |
Major Players
*Disclaimer: Major Players sorted in no particular order Image © Mordor Intelligence. Reuse requires attribution under CC BY 4.0. |
|
Germany Dairy Market Analysis by Mordor Intelligence
German dairy market size in 2026 is estimated at USD 28.16 billion, growing from 2025 value of USD 26.54 billion with 2031 projections showing USD 37.86 billion, growing at 6.12% CAGR over 2026-2031. Robust domestic demand, export-friendly EU policies, and rapid technology adoption underpin this trajectory, positioning the German dairy market as a focal point in the European market. Consolidation among cooperatives, premium product positioning, and sustained modernization of processing facilities add momentum, while evolving consumer preferences for functional and sustainable offerings reshape innovation agendas. Precision-fermentation enzymes, robotic milking, and value-added certifications deliver cost efficiencies and create pricing power that supports profitability despite retail price pressures. The market also benefits from steady urbanization, rising disposable incomes, and the rebound of food service channels that favor premium dairy applications.
Key Report Takeaways
- By product type, cheese led with 34.19% revenue share in 2025; dairy desserts are projected to advance at a 6.25% CAGR through 2031.
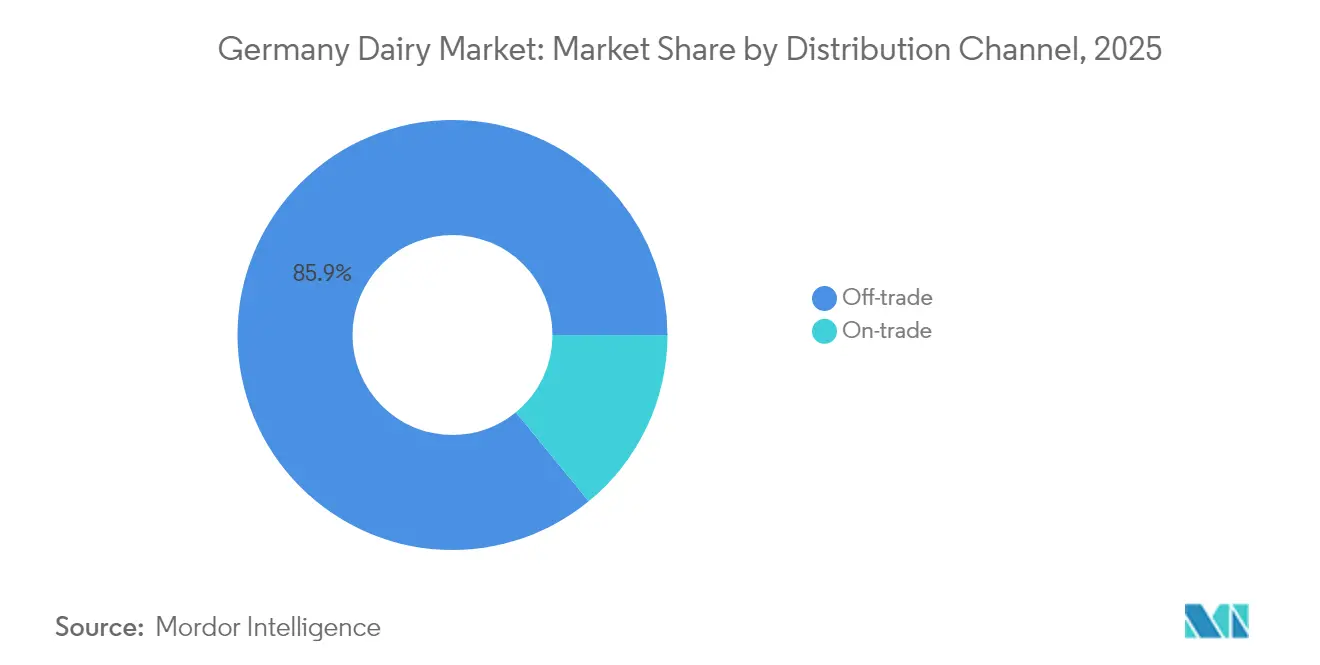
- By distribution channel, off-trade held 85.92% of the Germany dairy market share in 2025, while on-trade is expanding at a 9.35% CAGR through 2031.
Note: Market size and forecast figures in this report are generated using Mordor Intelligence’s proprietary estimation framework, updated with the latest available data and insights as of 2026.
Germany Dairy Market Trends and Insights
Drivers Impact Analysis*
| Driver | (~) % Impact on CAGR Forecast | Geographic Relevance | Impact Timeline |
|---|---|---|---|
| Cost-competitive private-label expansion in discounters | +1.2% | National, with concentration in urban markets | Short term (≤ 2 years) |
| Rising demand for high-protein & functional dairy snacks | +0.8% | National, with premium positioning in metropolitan areas | Medium term (2-4 years) |
| Strong export pull for German cheese within EU single market | +0.7% | EU-wide, with focus on neighboring markets | Long term (≥ 4 years) |
| Organic & GMO-free milk price premiums supporting farm margins | +0.6% | Rural production regions, urban consumption centers | Medium term (2-4 years) |
| Precision-fermentation enzymes enabling lactose-free line-extensions | +0.5% | National, with early adoption in tech-forward regions | Long term (≥ 4 years) |
| On-farm robotic milking boosting yield amid labour shortages | +0.4% | Rural dairy farming regions | Medium term (2-4 years) |
| Source: Mordor Intelligence | |||


Cost-Competitive Private-Label Expansion in Discounters
Private-label dairy products gain market share through strategic partnerships between discounter chains and regional cooperatives, creating cost advantages that traditional branded products struggle to match. EDEKA's sourcing of over 1 billion liters from Haltungsform 3+ suppliers demonstrates how retailers leverage animal welfare certifications to justify premium pricing while maintaining cost competitiveness[1]Source: EDEKA. "Sustainable Sourcing Commitments." 2024. edeka.de. This trend forces branded manufacturers to reconsider their value propositions, particularly in commodity categories where differentiation proves challenging. German retailers, holding a dominant market share, intensify the influence of private-label strategies during supplier negotiations. As discounters venture into organic and specialty dairy segments, traditional premium brands face mounting pressure to validate their pricing through heightened innovation and marketing efforts.
Rising Demand for High-Protein and Functional Dairy Snacks
Consumer health consciousness drives demand for dairy products with enhanced nutritional profiles, particularly protein-enriched yogurts and functional cheese varieties, which target active lifestyles. Functional dairy innovations extend beyond traditional categories, with manufacturers incorporating probiotics, omega-3 fatty acids, and plant-based protein blends to capture health-conscious consumers. This trend creates opportunities for premium positioning and margin expansion, particularly in urban markets where consumers demonstrate willingness to pay for perceived health benefits. The integration of sports nutrition concepts into mainstream dairy products represents a strategic pivot that differentiates German producers in competitive export markets.
Strong Export Pull for German Cheese Within EU Single Market
German cheese exports benefit from established distribution networks and a quality reputation within EU markets, creating sustainable competitive advantages that support premium pricing strategies. The EU-MERCOSUR agreement negotiations reinforce the value of intra-EU trade relationships. German cheese varieties, particularly those with protected designation of origin status, command premium prices in neighboring markets where consumers associate German production with quality and consistency. Export growth creates capacity utilization benefits for domestic producers, enabling them to achieve economies of scale that improve overall profitability. The single market framework eliminates trade barriers that would otherwise constrain cross-border expansion, making export development a natural extension of domestic operations rather than a separate strategic initiative.
Organic and GMO-Free Milk Price Premiums Supporting Farm Margins
Organic dairy production commands price premiums that offset higher production costs, creating sustainable business models for farmers willing to invest in certification and compliance systems. Andechser Molkerei's "Klima-Bauer" program, offering EUR 10 per tonne of CO2 saved, demonstrates how sustainability initiatives translate into direct financial benefits for participating farmers[2]Source: Andechser. "Climate Farmer Program." 2024. andechser-natur.de. The QM-Milch sustainability module expansion and Haltungsform 4 certification requirements create structured pathways for farmers to access premium markets while meeting evolving consumer expectations. Organic certification provides market differentiation that justifies higher retail prices, creating value chain benefits that extend from farm to consumer. The regulatory framework supporting organic production offers stability and predictability that encourages long-term investment in sustainable farming practices.
Restraints Impact Analysis*
| Restraint | (~) % Impact on CAGR Forecast | Geographic Relevance | Impact Timeline |
|---|---|---|---|
| Retailer squeeze on producer prices under food-inflation fatigue | -0.8% | National, with particular pressure in discount-focused regions | Short term (≤ 2 years) |
| Accelerating shift to plant-based beverages among Gen-Z consumers | -0.7% | Urban centers, with spillover to suburban markets | Medium term (2-4 years) |
| Stricter German climate-& animal-welfare regulation raising costs | -0.6% | National, with higher impact on intensive farming regions | Long term (≥ 4 years) |
| Declining dairy-farm numbers limiting raw-milk supply growth | -0.5% | Rural dairy farming regions, particularly smaller operations | Medium term (2-4 years) |
| Source: Mordor Intelligence | |||
Retailer Squeeze on Producer Prices Under Food-Inflation Fatigue
Retail consolidation creates negotiating power imbalances that pressure dairy producers to absorb cost increases rather than pass them through to consumers, compressing margins across the value chain. The German retail landscape's concentration, with major chains controlling over 85% of market share, enables coordinated pricing strategies that limit producers' ability to maintain profitability during inflationary periods[3]Source: BLE. "German Agricultural Market Statistics." 2024. ble.de. Food inflation fatigue among consumers creates consumer resistance to price increases, forcing retailers to maintain competitive pricing even when input costs rise. This dynamic particularly affects smaller regional producers who lack the scale advantages necessary to absorb margin compression without compromising operational viability. The resulting pressure encourages consolidation among producers, as evidenced by the Arla-DMK merger, which aims to achieve cost synergies that offset retail pricing pressures.
Accelerating Shift to Plant-Based Beverages Among Gen-Z Consumers
Younger consumer cohorts are demonstrating an increasing preference for plant-based alternatives, creating structural headwinds for traditional dairy consumption patterns that compound over time as demographic shifts occur. The ProVeg-Lidl partnership for cheese alternative innovation competitions reflects retail recognition of this trend and investment in alternative product development. Plant-based beverage adoption rates among Gen-Z consumers exceed those of older demographics by significant margins, suggesting that current consumption patterns may not persist as this cohort gains purchasing power. The trend extends beyond environmental concerns to include health perceptions, taste preferences, and lifestyle alignment factors that traditional dairy marketing struggles to address effectively. This demographic shift requires dairy producers to develop hybrid strategies that incorporate plant-based elements while leveraging their existing production capabilities and distribution networks.
*Our forecasts treat driver/restraint impacts as directional, not additive. The impact forecasts reflect baseline growth, mix effects, and variable interactions.
Segment Analysis
By Product Type: Cheese Dominance Through Premium Positioning
Cheese maintains its position as the largest product segment, commanding 34.19% market share in 2025, driven by Germany's strong culinary traditions and export competitiveness within EU markets. The segment benefits from protected designation of origin certifications and artisanal production methods that justify premium pricing strategies, particularly for traditional varieties like Allgäuer Bergkäse and Limburger. German cheese exports leverage established distribution networks within the EU single market, where quality reputation enables sustainable competitive advantages against lower-cost alternatives. The integration of precision fermentation technologies enables lactose-free line extensions without compromising traditional flavor profiles, expanding addressable market segments while maintaining authenticity. Formo's development of animal-free dairy proteins through biotechnology platforms represents a strategic pivot that addresses evolving consumer preferences while preserving the functional characteristics that define cheese categories.
Dairy desserts emerge as the fastest-growing segment with a projected CAGR of 6.25% through 2031, reflecting consumer demand for indulgent products that incorporate functional ingredients and premium positioning strategies. The segment's growth trajectory benefits from innovation in frozen dessert technologies and artisanal ice cream varieties that command higher margins than commodity dairy products. Product development focuses on protein enrichment, probiotic integration, and exotic flavor profiles that differentiate German producers in competitive export markets. The premiumization trend enables margin expansion opportunities, particularly in urban markets where consumers demonstrate willingness to pay for perceived quality and innovation. Retail partnerships with specialty dessert brands create distribution advantages that traditional dairy companies leverage to enter higher-margin categories without significant capital investment.


By Distribution Channel: Off-Trade Dominance Amid On-Trade Recovery
Off-trade channels maintain dominant market position with 85.92% share in 2025, reflecting German consumers' preference for retail purchasing and the strength of supermarket and hypermarket networks in dairy distribution. The channel benefits from private-label expansion strategies that create cost advantages for both retailers and consumers, particularly in commodity dairy categories where brand differentiation proves challenging. EDEKA's sourcing of over 1 billion liters from certified suppliers demonstrates how major retailers leverage scale advantages to secure favorable pricing while meeting sustainability requirements. E-commerce penetration within off-trade channels accelerates, driven by subscription models for regular dairy purchases and premium product positioning that justifies delivery costs. The integration of sustainability certifications and traceability systems creates competitive advantages for retailers who can demonstrate supply chain transparency to increasingly conscious consumers.
On-trade channels demonstrate accelerated growth at 9.35% CAGR, driven by food service recovery and premium positioning strategies that leverage artisanal dairy products in restaurant and hospitality applications. The segment's growth reflects post-pandemic normalization in dining patterns and increased demand for experiential consumption that emphasizes quality and craftsmanship. Professional kitchen adoption of specialty cheese varieties and artisanal dairy products creates market development opportunities for producers seeking to diversify beyond retail channels. The on-trade recovery benefits from tourism normalization and business travel resumption, which drive demand for premium dairy applications in hotels and restaurants. Food service partnerships enable dairy producers to showcase product quality and innovation in applications that influence consumer purchasing decisions in retail channels.
Geography Analysis
Germany's dairy market operates within a complex regulatory framework that balances domestic production capabilities with EU single market integration, creating both opportunities and constraints for market development. The country's position as Europe's largest economy provides scale advantages in domestic consumption while enabling export competitiveness within EU markets where German quality reputation commands premium pricing. Regulatory compliance under the Common Agricultural Policy reforms emphasizes environmental sustainability and animal welfare standards, creating cost pressures that favor larger, more efficient operations while potentially constraining smaller regional producers. The Haltungsform certification system expansion demonstrates how regulatory frameworks translate into market differentiation opportunities for producers willing to invest in compliance systems.
Regional production patterns reflect geographic advantages in traditional dairy farming areas, particularly in Bavaria and Lower Saxony, where established cooperative structures provide scale economies and processing capabilities. The ongoing consolidation trend, exemplified by the Arla-DMK merger creating Europe's largest dairy cooperative, reflects strategic responses to competitive pressures and regulatory requirements that favor scale advantages. Farm-level productivity improvements through robotic milking systems and precision agriculture technologies offset declining dairy farm numbers while maintaining production volumes necessary to support processing capacity utilization. The John Deere-DeLaval Milk Sustainability Center launch provides technological support for productivity improvements that align with environmental compliance requirements.
Export dynamics within the EU single market create strategic advantages for German dairy products, particularly cheese varieties that benefit from established distribution networks and quality reputation in neighboring markets. The EU-MERCOSUR agreement negotiations highlight the importance of protecting European dairy interests against lower-cost imports, reinforcing the value of intra-EU trade relationships for German producers. China's anti-subsidy investigation into EU dairy products affects EUR 513 million in trade volume, demonstrating vulnerability to external market disruptions that could impact export-dependent segments. Trade policy developments require strategic flexibility from German producers who must balance domestic market opportunities with export growth potential while managing geopolitical risks that affect international market access.
Competitive Landscape
The German dairy market demonstrates fragmented concentration levels. The anticipated merger between Arla and DMK is expected to establish Europe's largest dairy cooperative, with combined revenues of EUR 19 billion. This development is likely to significantly alter the competitive landscape by providing scale advantages and operational synergies. The ongoing trend of consolidation reflects strategic responses to the increasing negotiating power of the retail sector and the rising costs associated with regulatory compliance. Larger players are better positioned to absorb margin pressures while simultaneously investing in technology and sustainability initiatives.
Strategic trends in the market emphasize vertical integration and the adoption of advanced technologies. For example, Nestlé Germany has committed 1.2 billion CHF to regenerative agriculture partnerships through the Klim collaboration, showcasing how sustainability initiatives can drive competitive differentiation. Additionally, white-space opportunities are emerging in areas such as precision fermentation and plant-based hybrid products. Traditional dairy companies are leveraging their established distribution networks to penetrate these growing alternative segments. The Frischli-Brüggen joint venture, which filed for oat-based products with the German Cartel Office in July 2024, exemplifies how strategic partnerships can facilitate market entry with minimal capital investment.
Technological advancements are a key focus within the German dairy market. Companies are increasingly adopting robotic milking systems and AI-driven supply chain optimization to enhance operational efficiency. These technologies provide significant advantages, including cost competitiveness and consistent quality across production facilities. Such innovations are critical for maintaining a competitive edge in a market where operational excellence and sustainability are becoming essential for long-term success.
Germany Dairy Industry Leaders
-
Arla Foods amba
-
Danone SA
-
Groupe Lactalis
-
DMK Deutsches Milchkontor GmbH
-
Müller Group
- *Disclaimer: Major Players sorted in no particular order


Recent Industry Developments
- April 2025: Arla Foods and DMK Group announced their intention to merge, creating the strongest dairy cooperative in Europe. Their merger brings together more than 12,000 farmers and aims to become a single joint cooperative, achieving a combined pro forma revenue of Euro 19 billion.
- July 2024: Müller is set to construct a new production facility at its Alois Müller dairy in Aretsried, Germany, dedicated to jarred yogurt products under the Landliebe brand.


Germany Dairy Market Report Scope
Butter, Cheese, Cream, Dairy Desserts, Milk, Sour Milk Drinks, Yogurt are covered as segments by Category. Off-Trade, On-Trade are covered as segments by Distribution Channel.| Butter | ||
| Cheese | Natural Cheese | Cheddar |
| Cottage | ||
| Ricotta | ||
| Parmesan | ||
| Others | ||
| Processed Cheese | ||
| Cream | Fresh Cream | |
| Cooking Cream | ||
| Whippng Cream | ||
| Others (Clottted, Sour Cream) | ||
| Dairy Desserts | Ice Cream | |
| Cheesecakes | ||
| Frozen Desserts | ||
| Others (Puddings/desserts, trifles, fools) | ||
| Milk | Condensed milk | |
| Flavored Milk | ||
| Fresh Milk | ||
| UHT Milk (Ultra-high temperature milk) | ||
| Powdered Milk | ||
| Yogurt | Drinkable | |
| Spoonable | ||
| Sour Milk Drinks | ||
| On-trade | |
| Off-trade | Convenience Stores |
| Specialist Retailers | |
| Supermarkets and Hypermarkets | |
| On-line Retail | |
| Others (Warehouse clubs, gas stations, etc.) |
| By Product Type | Butter | ||
| Cheese | Natural Cheese | Cheddar | |
| Cottage | |||
| Ricotta | |||
| Parmesan | |||
| Others | |||
| Processed Cheese | |||
| Cream | Fresh Cream | ||
| Cooking Cream | |||
| Whippng Cream | |||
| Others (Clottted, Sour Cream) | |||
| Dairy Desserts | Ice Cream | ||
| Cheesecakes | |||
| Frozen Desserts | |||
| Others (Puddings/desserts, trifles, fools) | |||
| Milk | Condensed milk | ||
| Flavored Milk | |||
| Fresh Milk | |||
| UHT Milk (Ultra-high temperature milk) | |||
| Powdered Milk | |||
| Yogurt | Drinkable | ||
| Spoonable | |||
| Sour Milk Drinks | |||
| By Distribution Channel | On-trade | ||
| Off-trade | Convenience Stores | ||
| Specialist Retailers | |||
| Supermarkets and Hypermarkets | |||
| On-line Retail | |||
| Others (Warehouse clubs, gas stations, etc.) | |||


Market Definition
- Butter - Butter is a yellow-to-white solid emulsion of fat globules, water, and inorganic salts produced by churning the cream from cows’ milk
- Dairy - Dairy product include milk and any of the foods made from milk, including butter, cheese, ice cream, yogurt, and condensed and dried milk.
- Frozen Desserts - Frozen dairy dessert means and includes products containing milk or cream and other ingredients which are frozen or semi-frozen prior to consumption, such as ice milk or sherbet, including frozen dairy desserts for special dietary purposes, and sorbet
- Sour Milk Drinks - Sour milk is thick, curdled milk, with a sour taste, obtained from the fermentation of milk. Sour milk drinks such as kefir, laban, buttermilk have been considered in the study
| Keyword | Definition |
|---|---|
| Cultured Butter | Cultured butter is prepared by having the raw butter go through chemical processing and has been added with certain emulsifiers and foreign ingredients. |
| Uncultured Butter | This type of butter is one which has not been processed in any way |
| Natural Cheese | The type of cheese in its most natural form. It is made from natural and simple products and ingredients, including fresh and natural salts, natural colors, enzymes, and high-quality milk. |
| Processed Cheese | Processed cheese undergoes the same processes as natural cheese; however, it requires more steps and many different forms of ingredients. Making processed cheese involves melting natural cheese, emulsifying it, and adding preservatives and other artificial ingredients or colorings. |
| Single Cream | Single cream contains around 18% fat. It’s a single layer of cream that appears over boiled milk. |
| Double Cream | Double cream contains 48% fat, more than double the amount of fat of single cream. It’s heavier and thicker than single cream |
| Whipping Cream | This has a much higher fat percentage than single cream (36%). Used to top cakes, pies, and puddings and as a thickener for sauces, soups, and fillings. |
| Frozen Desserts | Desserts that are meant to be eaten in frozen condition. E.g., sherbets, sorbets, frozen yogurts |
| UHT Milk (Ultra-high temperature milk) | Milk heated at a very high temperature. Ultra-high-temperature processing (UHT) of milk involves heating for 1–8 sec at 135–154°C. which kills the spore-forming pathogenic microorganism, resulting in a product with a shelf-life of several months. |
| Non-dairy butter/Plant-based butter | Butter made from plant-derived oil such as coconut, palm, etc. |
| Non-dairy Yogurt | Yogurt made from typically made from nuts, like almonds, cashews, coconuts, and even other foods like soybeans, plantains, oats, and peas |
| On-trade | It refers to restaurants, QSRs, and bars. |
| Off-trade | It refers to supermarkets, hypermarkets, on-line channels, etc. |
| Neufchatel cheese | One of the oldest kinds of cheese in France. It is a soft, slightly crumbly, mold-ripened, bloomy-rind cheese made in the Neufchâtel-en-Bray region of Normandy. |
| Flexitarian | It refers to a consumer preferring a semi-vegetarian diet, that is centered on plant foods with limited or occasional inclusion of meat. |
| Lactose Intolerance | Lactose intolerance is a reaction in digestive system to lactose, the sugar in milk. It causes uncomfortable symptoms in response to the consumption of dairy products. |
| Cream Cheese | Cream cheese is a soft and creamy fresh cheese with a tangy taste made from milk and cream. |
| Sorbets | Sorbet is a frozen dessert made using ice combined with fruit juice, fruit purée, or other ingredients, such as wine, liqueur, or honey. |
| Sherbet | Sherbet is a sweetened frozen dessert made with fruit and some sort of dairy product such as milk or cream. |
| Shelf stable | Foods that can be safely stored at room temperature, or "on the shelf," for at least one year and do not have to be cooked or refrigerated to eat safely. |
| DSD | Direct Store Delivery is the process in supply chain management wherein the product is delivered from manufacturing plant directly to the retailer. |
| OU Kosher | Orthodox Union Kosher is a kosher certification agency based in New York City. |
| Gelato | Gelato is a frozen creamy dessert made with milk, heavy cream and sugar. |
| Grass-fed Cows | Grass-fed cows are allowed to graze in pastures, where they eat a variety of grasses and clover. |


Research Methodology
Mordor Intelligence follows a four-step methodology in all our reports.
- Step-1: Identify Key Variables: In order to build a robust forecasting methodology, the variables and factors identified in Step 1 are tested against available historical market numbers. Through an iterative process, the variables required for market forecast are set, and the model is built on the basis of these variables.
- Step-2: Build a Market Model: Market-size estimations for the forecast years are in nominal terms. Inflation is not a part of the pricing, and the average selling price (ASP) is kept constant throughout the forecast period for each country.
- Step-3: Validate and Finalize: In this important step, all market numbers, variables, and analyst calls are validated through an extensive network of primary research experts from the market studied. The respondents are selected across levels and functions to generate a holistic picture of the market studied.
- Step-4: Research Outputs: Syndicated Reports, Custom Consulting Assignments, Databases & Subscription Platforms


