United Kingdom Dairy Market Size and Share
Market Overview
| Study Period | 2021 - 2031 |
|---|---|
| Forecast Data Period | 2026 - 2031 |
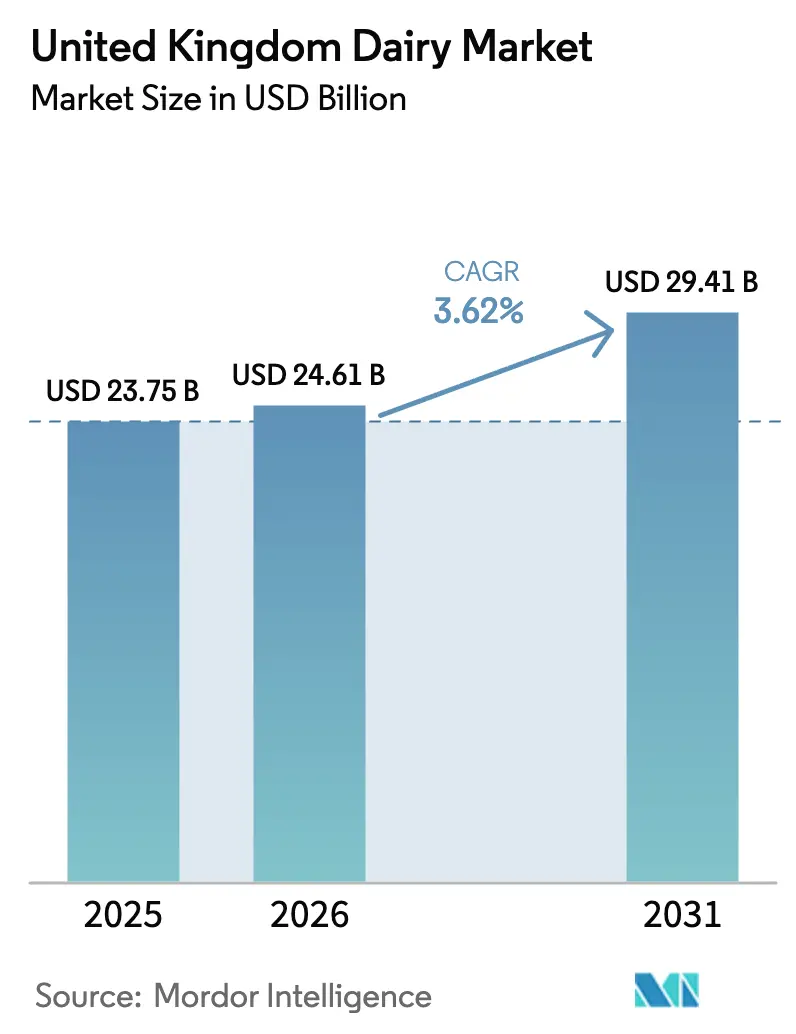
| Base Year Market Size (2025) | USD 23.75 Billion |
| Market Size (2026) | USD 24.61 Billion |
| Market Size (2031) | USD 29.41 Billion |
| Growth Rate (2026 - 2031) | 3.62% CAGR |
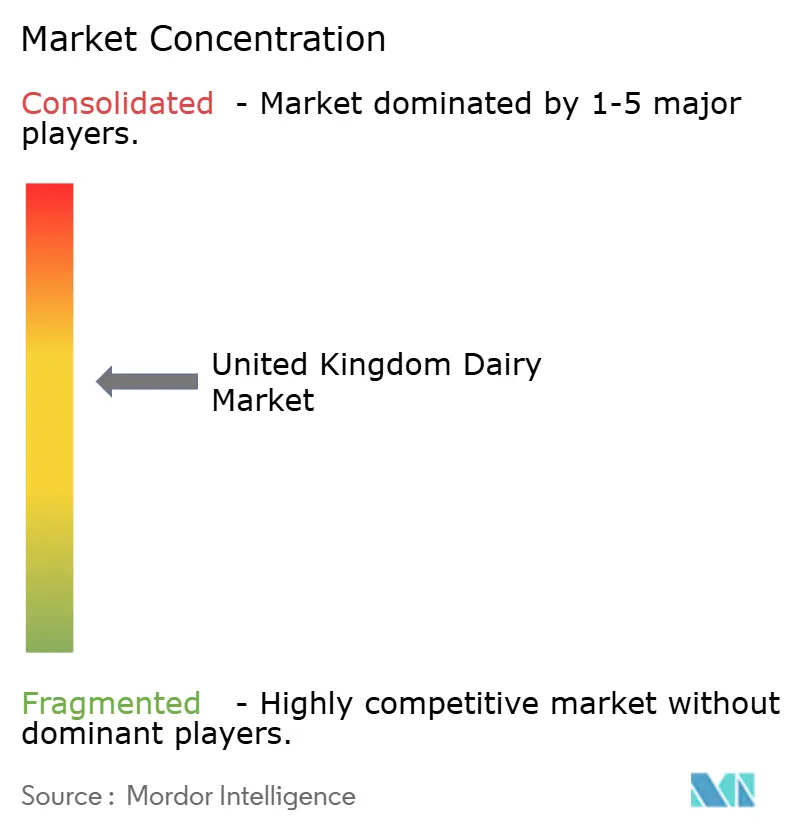
| Market Concentration | Medium |
Major Players
*Disclaimer: Major Players sorted in no particular order Image © Mordor Intelligence. Reuse requires attribution under CC BY 4.0. |
|
United Kingdom Dairy Market Analysis by Mordor Intelligence
United Kingdom Dairy Market size in 2026 is estimated at USD 24.61 billion, growing from 2025 value of USD 23.75 billion with 2031 projections showing USD 29.41 billion, growing at 3.62% CAGR over 2026-2031. Growth is supported by increasing demand for high-protein, fortified, and functional dairy products that promote fitness, weight management, and gut health. Additionally, there is a noticeable shift toward organic, clean-label, and animal-welfare-assured products, enabling consumers to align everyday dairy consumption with sustainability and ethical considerations. Concurrently, the market is witnessing a shift toward more sustainable production practices, including regenerative agriculture pilots, carbon-footprint labeling, and methane-reduction initiatives. These changes are driven by retailer commitments and corporate net-zero strategies, gradually transforming the production, sourcing, and marketing of milk.
Key Report Takeaways
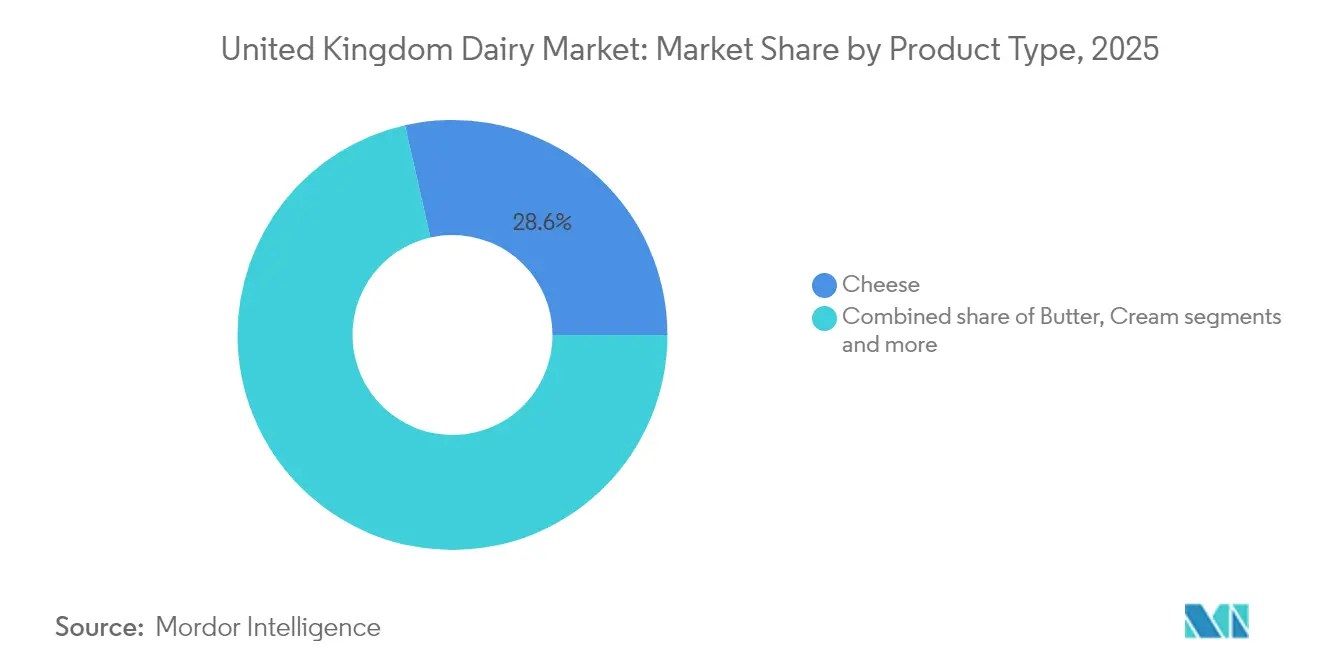
- By product type, cheese led with 28.55% of the United Kingdom dairy market share in 2025, while dairy desserts are forecast to expand at a 5.12% CAGR to 2031.
- By nature, conventional products represented 88.21% of the United Kingdom dairy market size in 2025, whereas organic lines are set to grow at a 4.75% CAGR through 2031.
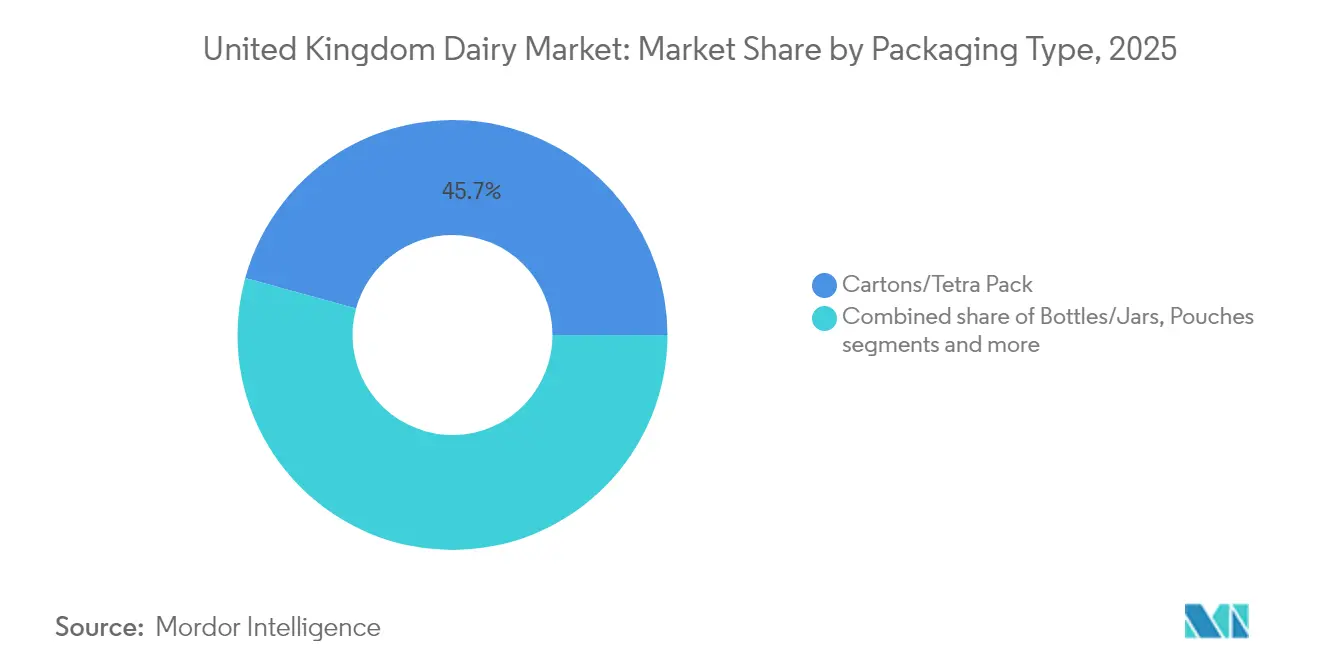
- By packaging, cartons and Tetra Pak captured 45.72% of the United Kingdom dairy market size in 2025, yet bottles and jars are projected to record a 4.18% CAGR over the forecast period.
- By distribution channel, off-trade outlets generated 82.96% of the United Kingdom dairy market share in 2025, while on-trade sales are primed for a 3.81% CAGR through 2031.
Note: Market size and forecast figures in this report are generated using Mordor Intelligence’s proprietary estimation framework, updated with the latest available data and insights as of 2026.
United Kingdom Dairy Market Trends and Insights
Drivers Impact Analysis*
| Driver | (~) % Impact on CAGR Forecast | Geographic Relevance | Impact Timeline |
|---|---|---|---|
| Health and nutrition trends | +0.8% | National, with stronger uptake in urban centers (London, Manchester, Birmingham) | Medium term (2-4 years) |
| Rising shift toward organic dairy farming | +0.5% | National, with higher penetration in South East and South West England | Medium term (2-4 years) |
| Convenience and on-the-go consumption trends | +0.3% | National, strongest in convenience stores and transport hubs | Short term (≤ 2 years) |
| Product innovation and premiumization | +0.7% | National, led by specialty retailers and coffee chains in metropolitan areas | Short term (≤ 2 years) |
| Growth of artisanal and specialty dairy | +0.4% | Regional concentration in West Country, Yorkshire, Scotland for PDO cheeses | Long term (≥ 4 years) |
| Strong marketing and brand positioning | +0.3% | National, amplified through digital channels and influencer partnerships | Short term (≤ 2 years) |
| Source: Mordor Intelligence | |||


Health and nutrition trends
Health and nutrition trends are key drivers of the United Kingdom Dairy Market, as consumers increasingly prioritize products that provide high-quality protein, calcium, and other essential nutrients in convenient formats to support muscle maintenance, weight management, and overall well-being. Consumers are actively increasing their protein intake and showing a strong preference for natural, minimally processed dairy products, which are regarded as authentic sources of complete protein, vitamins, and minerals. Additionally, there is growing interest in functional dairy products, such as high-protein milk, yogurt, and kefir, which align with fitness goals and gut health awareness. This shift is influencing innovation pipelines, with brands focusing on developing higher-protein, low-fat, and no-added-sugar formulations suitable for breakfast, snacking, and post-workout consumption, reinforcing dairy’s role in a balanced, health-oriented diet. Supporting this trend, in November 2024, The Gym Kitchen entered the dairy category by launching its high-protein skimmed milk. This fat-free, no-added-sugar milk contains approximately 60g of protein per litre and is produced using a filtration process that concentrates the natural protein content while maintaining a slightly sweet taste.
Rising shift toward organic dairy farming
The growing preference for organic dairy farming is a key driver of the United Kingdom Dairy Market. Environmentally conscious and health-focused consumers are increasingly seeking dairy products produced without synthetic fertilizers, pesticides, or routine antibiotics, while also prioritizing biodiversity and animal welfare. This trend is prompting processors and retailers to expand their organic product ranges and premium grass-fed offerings. Additionally, industry roadmaps and certification schemes are promoting lower-carbon, nature-positive production systems, which support higher shelf prices and long-term brand differentiation in both domestic and export markets. According to the Agriculture and Horticulture Development Board, data for 2024 indicates that approximately 1.5% of dairy cows in the United Kingdom were managed under organic systems, equating to around 48,000 cows out of a total of just over three million [1]Source: Agriculture and Horticulture Development Board, "Green shoots of recovery for organic dairy production", ahdb.org.uk. While organic dairy farming remains a small segment of the overall market, it represents a well-defined and growing niche with considerable potential for future expansion.
Convenience and on-the-go consumption trends
Convenience and on-the-go consumption trends are significant drivers of the United Kingdom Dairy Market. Busy consumers increasingly seek portable, ready-to-drink, and single-serve dairy products that can be consumed during transit, at work, or between activities without requiring preparation. This trend is particularly prominent among younger demographics, who prefer dairy snacks and drinks that provide quick energy, protein, and indulgent flavors. Popular formats include resealable bottles, drinkable yogurts, and handheld packs that are easy to carry and support snacking as an alternative to traditional sit-down meals. Consequently, manufacturers are focusing on products such as drinkable yogurts, kefir shots, and flavored milk drinks in convenient packaging sizes. Supporting this trend, in November 2024, Yoplait’s Yop brand introduced a new grab-and-go product in the United Kingdom: a strawberry-flavored yogurt drink in a 500-gram bottle. This product is designed for easy consumption as a snack or casual refreshment, featuring a resealable, easy-to-hold format that delivers dairy protein and calcium in a portable package.
Product innovation and premiumization
Product innovation and premiumization are significant drivers of the United Kingdom dairy market, as consumers increasingly demand dairy products that offer enhanced nutrition, unique formats, and affordable luxury experiences. These factors encourage consumers to trade up from standard milk, yogurt, and cheese. Brands are focusing on functional fortification, cleaner processing technologies, and improved sensory profiles to stand out amidst competition from dairy alternatives. Retailers are also dedicating more shelf space to value-added, premium-positioned dairy products that can achieve higher margins while remaining accessible to mainstream consumers. This trend is particularly pronounced in high-protein and fortified segments, where demand from fitness-conscious individuals, families, and older adults is fueling growth in specialized dairy products that combine health benefits with indulgent taste. Supporting this development, in September 2024, SuperNutrio introduced a nutrient-rich 100% cow’s milk in the United Kingdom. This product contains approximately twice the protein and 80% more calcium than standard cow’s milk, achieved through a patent-pending filtration process that concentrates the natural nutrients of two liters of milk into one, without the use of additives or artificial ingredients.
Restraints Impact Analysis*
| Restraint | (~) % Impact on CAGR Forecast | Geographic Relevance | Impact Timeline |
|---|---|---|---|
| Rising popularity of plant-based alternatives | -0.6% | National, with higher substitution in urban millennials and Gen Z cohorts | Medium term (2-4 years) |
| Supply chain disruptions and labor constraints | -0.5% | National, acute in rural areas dependent on seasonal labor | Short term (≤ 2 years) |
| Climate change and weather variability | -0.4% | National, with severe impacts in flood-prone regions (Somerset, Cumbria) | Long term (≥ 4 years) |
| Short shelf life of fresh dairy | -0.2% | National, most pronounced in convenience and online channels | Short term (≤ 2 years) |
| Source: Mordor Intelligence | |||
Rising popularity of plant-based alternatives
The increasing popularity of plant-based alternatives is constraining the growth of the United Kingdom Dairy Market, as a portion of consumers is shifting from traditional milk, cheese, and yogurt to options such as oat, almond, soy, and other non-dairy products. This shift is driven by perceived health, ethical, and environmental benefits. The rapid expansion of the dairy-alternatives category, bolstered by marketing emphasizing lactose-free, lower-cholesterol, and environmentally friendly attributes, is encouraging flexitarians and younger consumers to reduce or partially replace their dairy consumption. This trend directly limits the volume growth potential of conventional dairy categories. Additionally, as retailers allocate more shelf space to plant-based milks and cheeses and government and NGO initiatives advocate for plant-rich diets, competitive pressure from these substitutes is expected to increase. This dynamic is likely to restrict long-term demand for certain dairy segments, despite ongoing innovation within the dairy industry.
Supply chain disruptions and Labor Constraints
Supply chain disruptions and labor constraints are significant challenges for the United Kingdom Dairy Market as they lead to increased production costs, reduced supply reliability, and limited flexibility for processors to adapt to demand fluctuations in dairy products. Volatility in feed, energy, and packaging costs, driven by global conflicts, trade tensions, and logistics bottlenecks, reduces farm margins and may result in herd reductions or plant slowdowns. Additionally, shortages of skilled labor in farming, transportation, and processing, worsened by post-Brexit immigration changes, increase wage costs and complicate the maintenance of optimal milking, animal welfare, and processing schedules. These structural challenges contribute to higher retail prices, increased risk of stock shortages, and delays in product innovation, which can reduce consumption and drive cost-sensitive consumers toward cheaper alternatives or private-label products. Consequently, these factors limit the overall growth potential of the United Kingdom dairy market.
*Our forecasts treat driver/restraint impacts as directional, not additive. The impact forecasts reflect baseline growth, mix effects, and variable interactions.
Segment Analysis
By Product Type: Cheese Anchors, Desserts Accelerate
Cheese accounted for a 28.55% share of the United Kingdom dairy market in 2025. The segment continues to dominate due to its everyday versatility, strong taste appeal, and alignment with evolving health and lifestyle trends. Cheese is a staple in the United Kingdom's meal repertoire, frequently used as a topping for pizzas and pasta, a filling for sandwiches and burgers, and a flavor enhancer in home-cooked dishes. This widespread usage ensures consistent baseline demand, even when other dairy categories experience fluctuations. Additionally, consumers are increasingly opting for premium, artisanal, and specialty cheese variants rather than exiting the category. This trend toward premiumization boosts value share, encourages experimentation, and builds on familiar consumption occasions.
Dairy desserts are projected to grow at a compound annual growth rate (CAGR) of 5.12% through 2031, making them the fastest-growing product type in the United Kingdom dairy market. This growth is driven by their combination of sensory indulgence and modern wellness adaptations, positioning them as a key area of innovation. Dairy desserts appeal to a wide range of consumers with premium, health-oriented treats. Manufacturers are driving this growth through relentless product diversification, incorporating mix-ins, chunks, probiotics, botanicals, and exotic flavors such as salted caramel layers or superfood-infused frozen novelties. These innovations deliver multi-textural experiences, command higher margins, and expand consumption occasions from post-dinner rituals to anytime snacking and social sharing.


By Nature: Organic Premiums Offset Volume Decline
In 2025, conventional dairy accounted for 88.21% of the market share, maintaining its dominance in the dairy market due to its extensive scale, affordability, and integration into everyday British diets. These factors align with consumer preferences for reliable staples and nutritional essentials without the premium pricing or limited availability associated with organic alternatives. This strong position is supported by well-established supply chains that ensure consistent high volumes of fresh and UHT milk, along with significant cheese and butter production. These operations benefit from economies of scale, advanced processing efficiencies, and farmers' familiarity with conventional systems, which yield higher outputs per herd compared to organic farming constraints. Consumers continue to favor conventional dairy for its proven nutritional benefits, including protein, calcium, iodine, and vitamins, reinforced by cultural traditions.
Organic dairy is projected to grow at a CAGR of 4.75% through 2031, establishing a premium growth segment within the United Kingdom dairy market. This growth is driven by increasing consumer demand for ethical, sustainable, and health-focused alternatives that offer cleaner nutrition free from synthetic pesticides, antibiotics, and hormones. Organic dairy appeals to environmentally conscious families, wellness-focused individuals, and flexitarians who prioritize animal welfare, regenerative farming practices, and transparent supply chains over conventional options. Supporting this trend, in March 2024, Shepherds Purse collaborated with Acorn Organic Dairy to introduce its first organic cheese, Organic Yorkshire Blue. This Soil Association-approved blue cheese was developed over 12 months using organic milk from cows grazing on Yorkshire and Durham Dales pastures, showcasing how artisan innovation is expanding organic product offerings.
By Packaging: Sustainability Drives Bottles, Cartons Hold
In 2025, cartons and Tetra Pak accounted for 45.72% of the United Kingdom dairy market, driven by their combination of convenience, sustainability, and preservation capabilities. These packaging types meet consumer preferences for portable and eco-friendly formats that maintain the freshness of milk and UHT dairy products without requiring refrigeration. Utilizing advanced aseptic technology, these cartons incorporate multi-layer barriers made of paperboard, polyethylene, and aluminum foil, effectively blocking light, oxygen, and contaminants. This design significantly extends shelf life, reduces food waste, and allows for ambient storage. Their lightweight yet durable construction supports stackable logistics, while features like pourable spouts and resealable designs enhance usability for children and the elderly. These attributes make them suitable for a wide range of products, from everyday semi-skimmed milk to premium flavored yogurts and plant-based dairy alternatives, while also supporting high-speed filling lines that improve manufacturing efficiency.
Bottles and jars are projected to grow at a CAGR of 4.18% through 2031, gaining traction in the United Kingdom dairy market due to their focus on premiumization, reusability, and sensory appeal. These packaging formats elevate everyday dairy staples such as milk, cream, yogurt, and artisanal cheeses, catering to consumers seeking enhanced freshness, perceived purity, and upscale presentation. The shift toward recyclable glass and rPET bottles highlights their appeal, offering a sense of luxury and environmental responsibility. Glass jars are particularly suited for thick yogurts, flavored creams, and cultured dairy products, as they preserve delicate flavors without the risk of plastic-related off-notes. Meanwhile, resealable PET and HDPE bottles for drinkable yogurts and single-serve milk products provide portability and portion control, aligning with on-the-go lifestyles and family convenience, all while maintaining effective barrier protection against light and oxygen.
By Distribution Channel: Off-Trade Dominates, On-Trade Recovers
In 2025, off-trade channels accounted for 82.96% of the United Kingdom dairy market, driven by their convenience, extensive product variety, and integration into daily household routines. Supermarkets, hypermarkets, and convenience stores serve as primary hubs for purchasing dairy products, offering competitive pricing, loyalty rewards, and promotional bundles that support consistent consumption. This dominance is further reinforced by a well-established retail infrastructure, including chilled aisles designed to maintain dairy freshness, private-label options that rival branded products in quality at lower prices, and strategic product placements that encourage cross-purchases, such as yogurt with cereals or cheese with crackers. These factors embed dairy products deeply into British meal planning, from breakfast to baking. Additionally, the growth of e-commerce within off-trade channels enhances accessibility, offering home delivery for bulk purchases, discounts on UHT products, and personalized recommendations that cater to time-constrained families and urban consumers.
On-trade channels are projected to grow at a compound annual growth rate (CAGR) of 3.81% through 2031, contributing significantly to the United Kingdom dairy market. This growth is fueled by the revival of dining culture, the premiumization of foodservice offerings, and increasing demand for versatile dairy ingredients that enhance restaurant, cafe, and hospitality menus. From coffee pairings to indulgent desserts and global fusion dishes, dairy products play a critical role in elevating menu offerings. Foodservice operators are focusing on premium, traceable organic products and functional options, such as barista blends and probiotic toppings, to stand out in a competitive market. The recovery of tourism and the rise of social dining trends further boost dairy usage in high-traffic locations, ensuring consistent quality for high-volume applications. According to the Office for National Statistics (UK), consumer spending on restaurants and cafes in the United Kingdom reached GBP 138.39 billion in 2024, highlighting strong investment in the hospitality sector . This, in turn, drives increased dairy procurement for menu staples and innovative offerings.
Geography Analysis
The United Kingdom encompasses the entire geographic scope of this market, with regional dynamics influenced by farm concentration, consumer preferences, and infrastructure. The South West region, including Devon, Cornwall, and Somerset, serves as a hub for artisan and organic dairy production. This area leverages its lush pastures and traditional expertise to produce premium products such as cheeses, clotted creams, and Protected Designation of Origin (PDO) items like Cornish clotted cream and West Country farmhouse Cheddar. These products enjoy strong loyalty from both local consumers and tourists. The region's prominence is attributed to high herd densities, favorable grass-growing conditions, and robust cooperative structures.
Scotland's dairy sector, primarily located in Ayrshire and Dumfries, is increasingly focused on premium cheese and butter exports. The cooler climate in these areas supports the production of high-quality milk solids, which are ideal for mature cheddars, Dunlop cheese, and salted butters. These products appeal to international markets seeking robust flavors and Scotch provenance. Investments in processing facilities and improved port access enhance export capabilities, while domestic consumers value these products as symbols of national pride and farm-to-table experiences. Additionally, breed advantages, such as Ayrshire cattle known for butterfat-rich yields, further strengthen the region's dairy output.
Urban areas, particularly London, Manchester, and Birmingham, are key drivers of premiumization and the adoption of functional dairy products. Coffee chains and health-food retailers play a significant role in distributing high-protein yogurt and kefir, catering to professionals and wellness-focused consumers who prioritize gut health and plant-dairy hybrids. Dense populations and diverse demographics in these cities foster innovation in grab-and-go formats. Advanced cold-chain logistics ensure product freshness across multicultural menus. According to Dairy UK, there are 10,400 active dairy farmers in the country, producing nearly 15 billion liters of milk annually, which forms the backbone of the national supply chain and supports the abundance of dairy products in urban markets .
Competitive Landscape
The United Kingdom dairy market is moderately consolidated, with key players such as Arla Foods amba, Bel Group, Dale Farm Cooperative Ltd., Saputo Inc., and Danone SA holding significant market shares. These companies leverage extensive product portfolios and global scale to drive innovation, while cooperatives ensure alignment with farmers and maintain regional supply stability. Market leaders sustain their positions through frequent product launches, focusing on high-protein formats, premium organic offerings, and functional dairy products that align with wellness trends. Their efforts are supported by strong investments in research and development (R&D) and marketing.
Vertical integration is becoming more prominent, allowing companies to control the supply chain from farm to shelf. For example, Arla's GBP 179 million mozzarella plant in Devon, operational since 2024, supplies pizza chains and foodservice distributors with fresh, scalable volumes. This reduces reliance on imports and meets the growing demand for stretched-curd cheeses in Italian-inspired menus. Such investments highlight how major players secure milk supplies, optimize logistics, and ensure consistent quality. Meanwhile, companies like Müller and Lactalis are expanding yogurt and cream production facilities to cater to the increasing demand for premium products in cafes and restaurants.
Opportunities are emerging in regenerative agriculture and carbon-neutral milk programs, particularly in pasture-based systems that appeal to environmentally conscious consumers seeking low-emission dairy products without compromising on creaminess or nutrition. These initiatives create premium market segments for traceable, grass-fed products that command higher margins in urban health-focused outlets and export markets. Partnerships with retailers further enhance shelf presence for fortified, eco-friendly yogurts and cheeses. Companies adopting blockchain technology for provenance and biodiversity certifications are well-positioned for growth, addressing regulatory requirements and the rising demand from flexitarian consumers.
United Kingdom Dairy Industry Leaders
-
Arla Foods amba
-
Bel Group
-
Dale Farm Cooperative Ltd.
-
Danone SA
-
Saputo Inc.
- *Disclaimer: Major Players sorted in no particular order

Recent Industry Developments
- September 2025: Arla Foods has introduced Arla Cultura, a gut-health-focused dairy range aimed at providing accessible, science-based nutrition to British consumers. Each product in the range is lactose-free and fortified with vitamin D, calcium, protein, fiber, and a distinctive blend of bacterial cultures.
- May 2025: Lactalis UK & Ireland has launched a new spreadable cheese under the Leerdammer brand, expanding beyond its traditional sliced cheese range. The Leerdammer Original Spreadable (125g) offers the brand’s characteristic mild and nutty flavor in a soft format.
- February 2025: Danone introduced a new skyr yogurt range in the United Kingdom. The Natural variant contains 14 g of protein per serving and has no added sugars. The Strawberry variant provides 12 g of protein per serving and is free from artificial colors and flavors.
- October 2024: St Helen’s Farm Dairy, located in Seaton Ross, has introduced a milk product containing double the standard protein content. This product is free from additives, preservatives, and artificial flavorings.


United Kingdom Dairy Market Report Scope
Butter, Cheese, Cream, Dairy Desserts, Milk, Sour Milk Drinks, Yogurt are covered as segments by Category. Off-Trade, On-Trade are covered as segments by Distribution Channel.| Butter | Salted Butter | |
| Unsalted Butter | ||
| Cheese | Natural Cheese | Cheddar |
| Cottage | ||
| Ricotta | ||
| Processed Cheese | ||
| Cream | Fresh Cream | |
| Cooking Cream | ||
| Whippng Cream | ||
| Others (Clottted, Sour Cream) | ||
| Dairy Desserts | Ice Cream | |
| Cheesecakes | ||
| Frozen Desserts | ||
| Others (Puddings/desserts, trifles, fools) | ||
| Milk | Condensed milk | |
| Flavored Milk | ||
| Fresh Milk | ||
| UHT Milk (Ultra-high temperature milk) | ||
| Powdered Milk | ||
| Yogurt | Drinkable | |
| Spoonable | ||
| Organic |
| Conventional |
| Cartons/Tetra Pack |
| Bottles/Jars |
| Pouches |
| Others |
| On-trade | |
| Off-trade | Convenience Stores |
| Specialist Retailers | |
| Supermarkets and Hypermarkets | |
| On-line Retail | |
| Others (Warehouse clubs, gas stations, etc.) |
| By Product Type | Butter | Salted Butter | |
| Unsalted Butter | |||
| Cheese | Natural Cheese | Cheddar | |
| Cottage | |||
| Ricotta | |||
| Processed Cheese | |||
| Cream | Fresh Cream | ||
| Cooking Cream | |||
| Whippng Cream | |||
| Others (Clottted, Sour Cream) | |||
| Dairy Desserts | Ice Cream | ||
| Cheesecakes | |||
| Frozen Desserts | |||
| Others (Puddings/desserts, trifles, fools) | |||
| Milk | Condensed milk | ||
| Flavored Milk | |||
| Fresh Milk | |||
| UHT Milk (Ultra-high temperature milk) | |||
| Powdered Milk | |||
| Yogurt | Drinkable | ||
| Spoonable | |||
| By Nature | Organic | ||
| Conventional | |||
| By Packaging | Cartons/Tetra Pack | ||
| Bottles/Jars | |||
| Pouches | |||
| Others | |||
| By Distribution Channel | On-trade | ||
| Off-trade | Convenience Stores | ||
| Specialist Retailers | |||
| Supermarkets and Hypermarkets | |||
| On-line Retail | |||
| Others (Warehouse clubs, gas stations, etc.) | |||


Market Definition
- Butter - Butter is a yellow-to-white solid emulsion of fat globules, water, and inorganic salts produced by churning the cream from cows’ milk
- Dairy - Dairy product include milk and any of the foods made from milk, including butter, cheese, ice cream, yogurt, and condensed and dried milk.
- Frozen Desserts - Frozen dairy dessert means and includes products containing milk or cream and other ingredients which are frozen or semi-frozen prior to consumption, such as ice milk or sherbet, including frozen dairy desserts for special dietary purposes, and sorbet
- Sour Milk Drinks - Sour milk is thick, curdled milk, with a sour taste, obtained from the fermentation of milk. Sour milk drinks such as kefir, laban, buttermilk have been considered in the study
| Keyword | Definition |
|---|---|
| Cultured Butter | Cultured butter is prepared by having the raw butter go through chemical processing and has been added with certain emulsifiers and foreign ingredients. |
| Uncultured Butter | This type of butter is one which has not been processed in any way |
| Natural Cheese | The type of cheese in its most natural form. It is made from natural and simple products and ingredients, including fresh and natural salts, natural colors, enzymes, and high-quality milk. |
| Processed Cheese | Processed cheese undergoes the same processes as natural cheese; however, it requires more steps and many different forms of ingredients. Making processed cheese involves melting natural cheese, emulsifying it, and adding preservatives and other artificial ingredients or colorings. |
| Single Cream | Single cream contains around 18% fat. It’s a single layer of cream that appears over boiled milk. |
| Double Cream | Double cream contains 48% fat, more than double the amount of fat of single cream. It’s heavier and thicker than single cream |
| Whipping Cream | This has a much higher fat percentage than single cream (36%). Used to top cakes, pies, and puddings and as a thickener for sauces, soups, and fillings. |
| Frozen Desserts | Desserts that are meant to be eaten in frozen condition. E.g., sherbets, sorbets, frozen yogurts |
| UHT Milk (Ultra-high temperature milk) | Milk heated at a very high temperature. Ultra-high-temperature processing (UHT) of milk involves heating for 1–8 sec at 135–154°C. which kills the spore-forming pathogenic microorganism, resulting in a product with a shelf-life of several months. |
| Non-dairy butter/Plant-based butter | Butter made from plant-derived oil such as coconut, palm, etc. |
| Non-dairy Yogurt | Yogurt made from typically made from nuts, like almonds, cashews, coconuts, and even other foods like soybeans, plantains, oats, and peas |
| On-trade | It refers to restaurants, QSRs, and bars. |
| Off-trade | It refers to supermarkets, hypermarkets, on-line channels, etc. |
| Neufchatel cheese | One of the oldest kinds of cheese in France. It is a soft, slightly crumbly, mold-ripened, bloomy-rind cheese made in the Neufchâtel-en-Bray region of Normandy. |
| Flexitarian | It refers to a consumer preferring a semi-vegetarian diet, that is centered on plant foods with limited or occasional inclusion of meat. |
| Lactose Intolerance | Lactose intolerance is a reaction in digestive system to lactose, the sugar in milk. It causes uncomfortable symptoms in response to the consumption of dairy products. |
| Cream Cheese | Cream cheese is a soft and creamy fresh cheese with a tangy taste made from milk and cream. |
| Sorbets | Sorbet is a frozen dessert made using ice combined with fruit juice, fruit purée, or other ingredients, such as wine, liqueur, or honey. |
| Sherbet | Sherbet is a sweetened frozen dessert made with fruit and some sort of dairy product such as milk or cream. |
| Shelf stable | Foods that can be safely stored at room temperature, or "on the shelf," for at least one year and do not have to be cooked or refrigerated to eat safely. |
| DSD | Direct Store Delivery is the process in supply chain management wherein the product is delivered from manufacturing plant directly to the retailer. |
| OU Kosher | Orthodox Union Kosher is a kosher certification agency based in New York City. |
| Gelato | Gelato is a frozen creamy dessert made with milk, heavy cream and sugar. |
| Grass-fed Cows | Grass-fed cows are allowed to graze in pastures, where they eat a variety of grasses and clover. |


Research Methodology
Mordor Intelligence follows a four-step methodology in all our reports.
- Step-1: Identify Key Variables: In order to build a robust forecasting methodology, the variables and factors identified in Step 1 are tested against available historical market numbers. Through an iterative process, the variables required for market forecast are set, and the model is built on the basis of these variables.
- Step-2: Build a Market Model: Market-size estimations for the forecast years are in nominal terms. Inflation is not a part of the pricing, and the average selling price (ASP) is kept constant throughout the forecast period for each country.
- Step-3: Validate and Finalize: In this important step, all market numbers, variables, and analyst calls are validated through an extensive network of primary research experts from the market studied. The respondents are selected across levels and functions to generate a holistic picture of the market studied.
- Step-4: Research Outputs: Syndicated Reports, Custom Consulting Assignments, Databases & Subscription Platforms


