Europe Cheese Market Size and Share
Market Overview
| Study Period | 2021 - 2031 |
|---|---|
| Forecast Data Period | 2026 - 2031 |
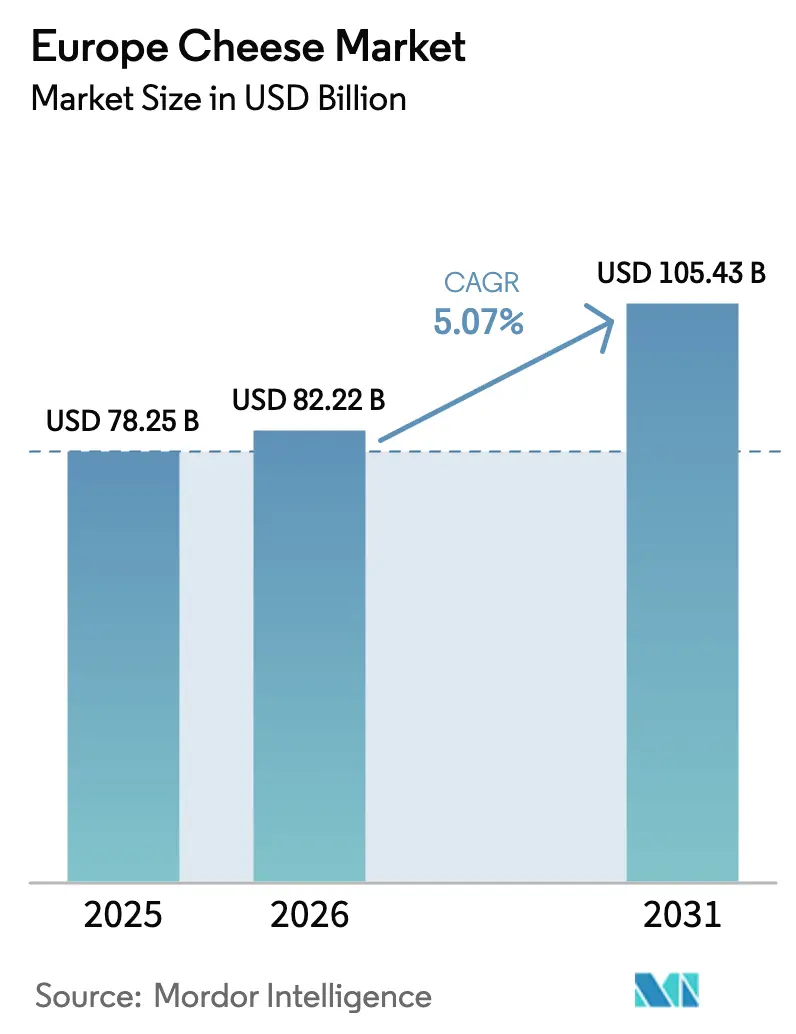
| Base Year Market Size (2025) | USD 78.25 Billion |
| Market Size (2026) | USD 82.22 Billion |
| Market Size (2031) | USD 105.43 Billion |
| Growth Rate (2026 - 2031) | 5.07% CAGR |
| Market Concentration | Medium |
Major Players *Disclaimer: Major Players sorted in no particular order Image © Mordor Intelligence. Reuse requires attribution under CC BY 4.0. | |
Europe Cheese Market Analysis by Mordor Intelligence
The Europe cheese market size was valued at USD 78.25 billion in 2025 and estimated to grow from USD 82.22 billion in 2026 to reach USD 105.43 billion by 2031, at a CAGR of 5.07% during the forecast period (2026-2031). The market growth is driven by changing consumer preferences toward convenient food options, increased focus on sustainable practices, and demand for premium cheese varieties. France remains the market leader due to its protected designation of origin system, which preserves traditional cheese production methods. Germany is experiencing the fastest market growth, supported by higher consumer purchasing power and expanded modern retail formats that improve cheese availability. Natural cheese continues to lead in volume sales, while processed cheese shows significant growth in foodservice and ready-meal production due to its extended shelf life, consistent melting properties, and portion control benefits. The market's distribution channels are evolving through new packaging innovations, such as resealable containers and single-serve options, along with increased cheese sales through e-commerce platforms.
Key Report Takeaways
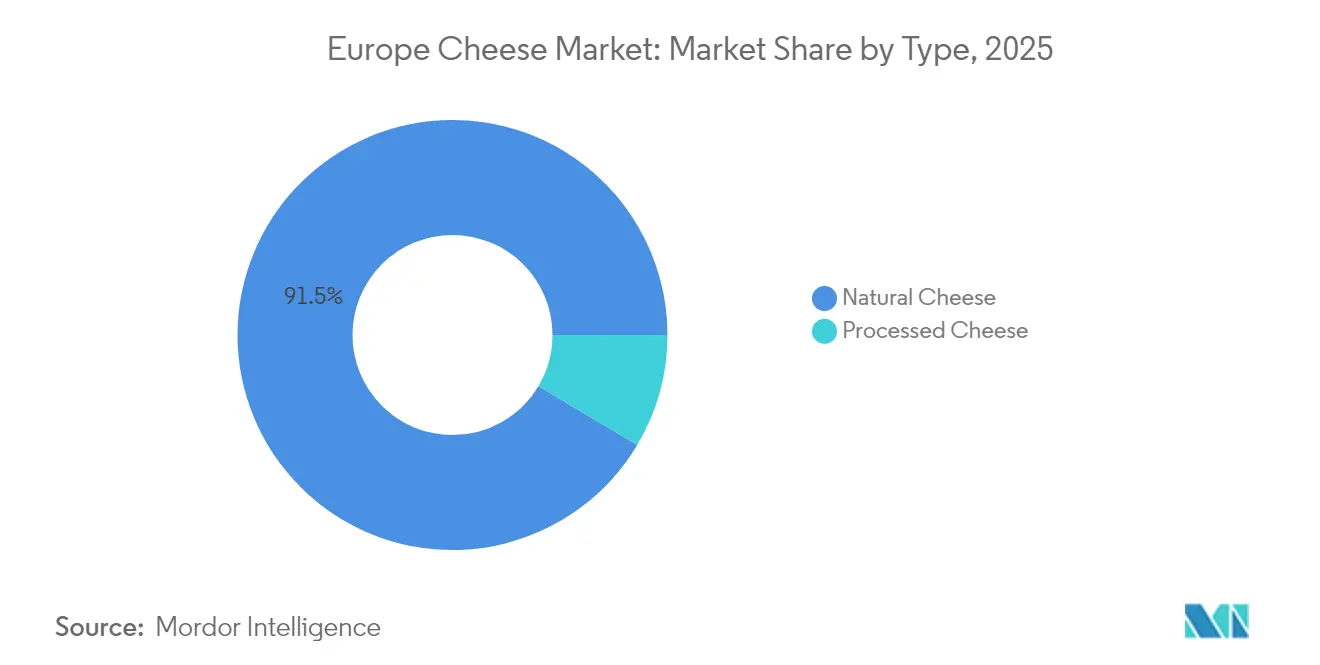
- By type, natural cheese captured 91.45% of Europe cheese market share in 2025; processed cheese is projected to expand at a 7.05% CAGR through 2031.
- By form, blocks held 31.65% of the Europe cheese market size in 2025 while slices record the highest forecast CAGR at 6.48% to 2031.
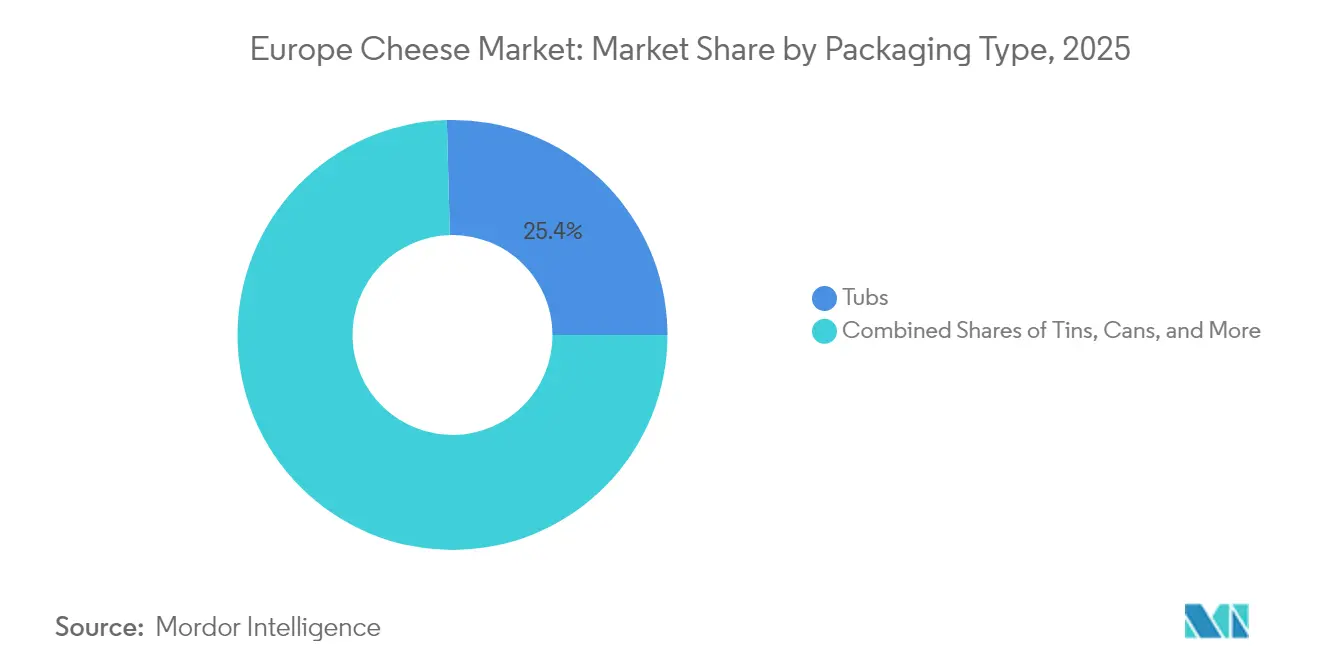
- By packaging, tubs commanded 25.42% revenue share in 2025 and are set to rise at a 6.35% CAGR.
- By distribution, off-trade channels accounted for 77.35% of 2025 sales; on-trade recovers at a 6.50% CAGR as foodservice normalizes.
- By geography, France led with 25.88% revenue share in 2025; Germany is advancing at a 6.85% CAGR through 2031.
Note: Market size and forecast figures in this report are generated using Mordor Intelligence’s proprietary estimation framework, updated with the latest available data and insights as of 2026.
Europe Cheese Market Trends and Insights
Drivers Impact Analysis*
| Driver | (~) % Impact on CAGR Forecast | Geographic Relevance | Impact Timeline |
|---|---|---|---|
| Popularity of ready-to-eat and convenience foods | +1.2% | Germany, UK, Netherlands core, spillover to Nordic markets | Medium term (2-4 years) |
| Sustainability concerns driving interest in eco-friendly cheese products | +0.8% | EU-wide, strongest in Germany, Netherlands, Denmark | Long term (≥4 years) |
| Proliferation of cheese varieties and specialty types | +0.9% | France, Italy, Spain leading, expanding to Eastern Europe | Medium term (2-4 years) |
| Advancements in cheese ripening and flavor enhancement technology | +0.6% | Global, concentrated in major production hubs | Long term (≥4 years) |
| Increasing product visibility via new formats | +0.7% | Urban markets across Western Europe, expanding eastward | Short term (≤2 years) |
| Premiumization trend driving purchase of aged/artisanal cheeses | +1.0% | France, Germany, UK, Netherlands leading premium adoption | Medium term (2-4 years) |
| Source: Mordor Intelligence | |||


Popularity of Ready-to-Eat and Convenience Foods
The evolution of modern lifestyles continues to reshape how consumers approach cheese consumption, with households gravitating towards products offering simplicity and ease of preparation. European convenience food sales experienced substantial growth, driving increased market share for cheese-based products through advancements in packaging technology and preservation methods. The market shows a clear shift towards convenience-oriented formats including pre-sliced, pre-shredded, and portion-controlled options, representing a significant portion of total cheese volume and demonstrating a permanent change in consumer behavior beyond pandemic-influenced patterns. The processed cheese category has particularly flourished in this environment, capitalizing on advantages like longer shelf stability and reliable melting characteristics. By expanding into ready-meals, snack applications, and on-the-go formats, cheese products have transcended their traditional role in meal preparation, substantially broadening their market presence and consumer accessibility.
Sustainability Concerns Driving Interest in Eco-Friendly Cheese Products
Environmental consciousness significantly influences purchasing behaviors across European markets, where consumers demonstrate a strong commitment to sustainability. According to a 2024 consumer survey, 67% of European consumers express willingness to pay premium prices for sustainably produced cheese products [1]Source: European Environment Agency, “Food System Sustainability,” eea.europa.eu. The organic cheese segment experiences substantial growth, with sales volumes surpassing conventional varieties by a 3:1 margin. Major manufacturers respond to this trend by increasing their adoption of carbon-neutral packaging by 45%. Dairy cooperatives actively embrace regenerative agriculture practices to enhance soil health, improve long-term productivity, and ensure compliance with EU Green Deal regulatory requirements. While plant-based cheese alternatives currently represent less than 3% of the total market value, their presence motivates traditional cheese manufacturers to strengthen their environmental commitments and make substantial investments in sustainable production technologies. This increasing focus on sustainability creates distinct competitive advantages for producers who successfully demonstrate quantifiable environmental improvements while maintaining high standards for taste and product functionality.
Proliferation of Cheese Varieties and Specialty Types
The artisanal and specialty cheese segments are witnessing substantial growth as consumers increasingly value authentic and distinctive products, demonstrating their willingness to pay premium prices for superior quality. Protected Designation of Origin (PDO) cheese sales showed significant momentum in 2024, with younger consumers actively seeking traditional varieties that were historically limited to specialty markets [2]Source: European Commission, “Geographical Indications and Quality Schemes,” agriculture.ec.europa.eu. Regional cheese specialties have successfully transcended their geographical boundaries through enhanced cold-chain logistics infrastructure and digital commerce platforms. This expansion has enabled Italian Gorgonzola to establish a strong presence in Nordic markets, while Dutch aged Gouda has successfully penetrated Mediterranean regions. The market has responded to evolving consumer preferences by developing innovative hybrid varieties that skillfully blend traditional cheese-making techniques with contemporary flavor profiles, attracting consumers who seek new taste experiences. This strategic market expansion reinforces premiumization trends, enabling specialty cheeses to generate 40-60% higher profit margins compared to commodity varieties, while simultaneously building strong brand loyalty through their unique taste profiles and consumer experiences.
Advancements in Cheese Ripening and Flavor Enhancement Technology
Advanced fermentation control and aging processes enable manufacturers to maintain consistent product quality while optimizing production efficiency and minimizing resource wastage. Precision fermentation technologies provide manufacturers granular control over flavor development, substantially reducing traditional aging periods without compromising taste characteristics. IoT sensors integrated into automated ripening environments maintain precise control over temperature, humidity, and air circulation parameters, enhancing production consistency and minimizing product spoilage compared to conventional aging facilities. These technological advancements create opportunities for smaller manufacturers to achieve quality standards previously attainable only by large-scale operations. The implementation of modified atmosphere and active packaging materials has significantly extended product shelf life, facilitating expanded distribution networks and reducing food waste throughout the supply chain.
Restraints Impact Analysis*
| Restraint | (~) % Impact on CAGR Forecast | Geographic Relevance | Impact Timeline |
|---|---|---|---|
| Health-related concerns over excessive fat and calorie content | -0.7% | Northern Europe, UK leading health-conscious markets | Short term (≤2 years) |
| Regulatory complexities for food safety/adulteration and labeling | -0.4% | EU-wide, particularly complex in cross-border trade | Medium term (2-4 years) |
| Lack of standardization in regional cheese quality/type definitions | -0.3% | Eastern Europe, emerging markets with developing standards | Long term (≥4 years) |
| Hygiene and traceability challenges in farm-to-table supply chains | -0.5% | Rural production areas, small-scale producers across EU | Medium term (2-4 years) |
| Source: Mordor Intelligence | |||
Health-Related Concerns Over Excessive Fat and Calorie Content
Health awareness influences traditional cheese consumption patterns, particularly in markets where obesity rates and cardiovascular disease concerns affect dietary choices. European health authorities recommend limiting saturated fat intake to less than 10% of daily calories, resulting in a 3-4% annual decline in full-fat cheese consumption among health-conscious demographics [3]Source: European Centre for Disease Prevention and Control, “Healthy Diet Recommendations,” ecdc.europa.eu. While reduced-fat cheese alternatives gain market share, they face challenges in taste and functionality, creating a gap between health objectives and consumer preferences. The emerging plant-based alternatives market offers options with no cholesterol and lower saturated fat content, compelling traditional manufacturers to adapt their product formulations. This health-driven shift significantly affects consumers aged 25-40, who show increased willingness to reduce cheese consumption or transition to alternatives, potentially limiting future market growth.
Regulatory Complexities for Food Safety/Adulteration and Labeling
The European Union's evolving food safety regulations create compliance requirements that affect smaller producers more severely while increasing costs across the industry. EU Regulation 2017/625's enhanced traceability requirements necessitate detailed documentation throughout the supply chain, from farm to retail, resulting in an 8-12% increase in administrative costs for mid-sized producers. The varying interpretations of labeling requirements by different member states complicate cross-border trade, creating obstacles for companies expanding within the single market. New regulations requiring environmental impact disclosure and carbon footprint labeling demand substantial investments in measurement and reporting systems, giving larger companies with dedicated compliance departments an advantage over smaller artisanal producers. The regulatory divergence following Brexit further complicates UK-EU trade relationships, requiring separate compliance systems and potentially restricting market access for smaller producers.
*Our forecasts treat driver/restraint impacts as directional, not additive. The impact forecasts reflect baseline growth, mix effects, and variable interactions.
Segment Analysis
By Type: Natural Dominance Faces Processing Innovation
Natural cheese holds a 91.45% market share in 2025, as European consumers prefer traditional production methods and authentic flavors that reflect the region's culinary heritage. The processed cheese segment is growing at a 7.05% CAGR through 2031, supported by foodservice recovery and industrial food applications that require consistent melting properties and longer shelf life. In natural cheese categories, hard varieties such as Cheddar and Parmesan lead in volume due to their versatility in retail and foodservice applications. Soft cheeses like Cottage and Ricotta gain popularity among health-conscious consumers seeking protein-rich, lower-fat options.
The "Others" segment in natural cheese shows strong growth due to increasing specialty and artisanal varieties, supported by PDO protections that enable premium pricing. Advances in processing technology are reducing the distinction between natural and processed categories, as manufacturers develop hybrid products combining authentic taste with enhanced functionality. Cold-pressed processing techniques maintain natural flavors while achieving the consistency needed for industrial applications, allowing natural cheese producers to compete in traditionally processed cheese markets. This technological evolution has created new opportunities for manufacturers to expand their product portfolios and meet diverse consumer preferences while maintaining quality standards across both natural and processed cheese segments.


By Form: Convenience Formats Drive Slice Growth
Traditional blocks maintain their dominant position with a 31.65% market share in 2025, as manufacturers and consumers continue to value their cost efficiency and adaptability across various cooking applications. The sliced cheese segment demonstrates remarkable momentum, achieving the highest growth rate at 6.48% CAGR through 2031. This significant growth trajectory reflects the evolving preferences of consumers, particularly in urban areas and among younger generations, who increasingly prioritize convenience over traditional cost considerations in their purchasing decisions.
The foodservice industry shows substantial demand for shredded cheese products, as restaurants implement operational efficiencies and standardize portion sizes. Simultaneously, cheese cubes have established a strong presence in the snacking category, effectively expanding cheese consumption beyond conventional meal preparation times. The "Others" category encompasses innovative product formats, including cheese sticks, spreadable varieties, and portion-controlled packaging solutions that address the growing demand for portable consumption options. The widespread adoption of sliced formats correlates directly with the expansion of sandwich consumption patterns and breakfast convenience trends, further accelerated by the shift to remote work environments. Pre-portioned cheese formats demonstrate tangible benefits by reducing household food waste by 15-20% compared to traditional blocks, effectively addressing environmental sustainability concerns while providing precise portion control options that resonate with health-conscious consumers.
By Packaging Type: Tubs Lead Dual Metrics Through Sustainability
The packaging market shows tubs commanding a significant 25.42% market share in 2025, while also achieving the highest growth rate at 6.35% CAGR. This strong performance reflects how tubs meet consumer needs through resealable features that minimize food waste and allow easy product viewing. Tins continue to play a vital role in specialty cheese segments, especially for export markets and emergency food supplies where longer shelf life is crucial, while cans remain the preferred choice for industrial users seeking efficient bulk packaging solutions.
The "Others" category encompasses various packaging solutions including vacuum-sealed pouches, modified atmosphere packaging, and biodegradable materials that help companies meet environmental standards. The EU's regulations on single-use plastics have pushed manufacturers toward recyclable and compostable packaging options, with tubs gaining an advantage due to their larger surface area for displaying sustainability information. Consumer studies indicate that 73% of buyers prefer packaging with clear recycling instructions, which has strengthened the market position of tub packaging that effectively communicates environmental compliance.
By Distribution Channel: Off-Trade Dominance Meets On-Trade Recovery
The cheese market shows a clear consumer preference for off-trade channels, which account for 77.35% of market share in 2025. This trend stems from the behavioral changes that took root during pandemic lockdowns and continues due to budget-conscious consumers choosing to cook at home. In the off-trade segment, supermarkets and hypermarkets lead in sales volume by offering competitive prices and extensive product ranges, while specialist retailers carve out their niche in premium segments by providing expert guidance and carefully selected products.
Meanwhile, the on-trade segment demonstrates promising growth potential with a projected 6.50% CAGR through 2031. This growth reflects the evolving landscape of foodservice operations, where restaurants increasingly use cheese as a key differentiator in their menu offerings. The online retail channel is experiencing rapid expansion, particularly in specialty and artisanal cheese categories, where detailed product descriptions and customer reviews help inform purchase decisions. This shift in the on-trade sector represents a fundamental change, as cheese transitions from a basic ingredient to a premium component that enables restaurants to command higher menu prices.
Geography Analysis
France's dominant position in the market, with a 25.88% share in 2025, reflects its deep-rooted cheese-making traditions and the refined tastes of its consumers, which fuel both local demand and strong export performance. The nation's extensive range of over 400 cheese varieties, many protected under AOC certification, creates lasting market advantages through their authentic character and regional identity, enabling higher pricing worldwide. The well-structured supply chain network, connecting local farms with specialized processors, ensures stringent quality standards and product traceability in line with EU regulations. Yet, the mature market faces growth limitations as household consumption reaches peak levels, particularly with the trend toward smaller family units.
The German market's remarkable growth trajectory, projected at 6.85% CAGR through 2031, showcases how consumer eating habits are evolving beyond traditional bread-based meals to embrace cheese as both a cooking ingredient and standalone food choice. As German households enjoy increased spending power, they are actively choosing premium and artisanal cheese options, supported by an expanding retail network that serves both city centers and rural areas. The country's robust approach to food safety, combined with EU compliance, creates an environment conducive to both domestic production and import growth. Germany's strategic location in Europe makes it an attractive base for international producers looking to establish regional distribution networks.
The diverse markets of Italy, United Kingdom, Spain, Netherlands, and other European countries offer substantial growth potential, despite their varying regulatory frameworks and consumer preferences. Italy's renowned varieties, such as Parmigiano-Reggiano and Gorgonzola, continue to find new opportunities in global markets, riding the wave of Italian cuisine's international appeal. Meanwhile, the UK's post-Brexit landscape presents a mixed scenario where domestic producers face both challenges and opportunities in their competition with European imports.
Competitive Landscape
The European cheese market shows a balanced mix of competition, where both large corporations and local specialists find their place. Companies like Groupe Lactalis, Arla Foods, and FrieslandCampina benefit from their size through better purchasing power, efficient production, and strong distribution networks. At the same time, smaller producers thrive by offering handcrafted quality, authentic local products, and unique specialty cheeses. This diverse market structure reflects how deeply cheese is tied to local cultures, where regional tastes and traditional making methods naturally prevent any single company from dominating the entire market.
The industry shows interesting contrasts in how companies approach technology. Large manufacturers invest heavily in automated systems and supply chain improvements, while smaller producers focus on maintaining quality standards and sustainable practices that justify their premium prices. This difference in approach helps each type of producer maintain its market position and serve its target customers effectively.
Companies are now putting more effort into sustainability, creating new products, and selling directly to consumers. Many are taking control of their entire production process while also making store-brand products to ensure steady sales and reduce marketing costs. New opportunities are emerging in plant-based options, cheese products with health benefits, and better packaging that keeps products fresh longer while being environmentally friendly. The 23% increase in patents for fermentation and packaging technologies in 2024 shows how companies are competing through innovation to stand out in this established market.
Europe Cheese Industry Leaders
Arla Foods amba
Bel Group
Galbani
Granarolo SpA
Groupe Lactalis
- *Disclaimer: Major Players sorted in no particular order

Recent Industry Developments
- May 2025: Lactalis is expanding its footprint in Portugal with the acquisition of local cheese maker Queijos Tavares, adding two production facilities and renowned brands such as Seia do Tavares and Serras de Penela to its portfolio.
- May 2025: Leerdammer has launched its first spreadable cheese product, the Leerdammer Original Spreadable, featuring the brand’s signature mild and nutty flavor in a smooth, soft format. The launch marks Leerdammer’s entry into the spreadable cheese category, aiming to expand its market presence beyond sliced cheeses.
- September 2024: Kellanova has launched its Cheez-It brand in the UK and Ireland, debuting Cheez-It Snap’d snacks with flavors tailored to European tastes and a crispy, baked texture. The product is now available in nearly 7,000 stores, supported by a major marketing campaign.


Europe Cheese Market Report Scope
Natural Cheese, Processed Cheese are covered as segments by Product Type. Off-Trade, On-Trade are covered as segments by Distribution Channel. Belgium, France, Germany, Italy, Netherlands, Russia, Spain, Turkey, United Kingdom are covered as segments by Country.| Natural Cheese | Cheddar |
| Cottage | |
| Ricotta | |
| Parmesan | |
| Others | |
| Processed Cheese |
| Shredded |
| Blocks |
| Cubes |
| Slices |
| Others |
| Tubs |
| Tins |
| Cans |
| Others |
| On-trade | |
| Off-trade | Convenience Stores |
| Specialist Retailers | |
| Supermarkets and Hypermarkets | |
| Online Retail | |
| Others |
| Germany |
| United Kingdom |
| Italy |
| France |
| Spain |
| Netherlands |
| Poland |
| Belgium |
| Sweden |
| Rest of Europe |
| By Type | Natural Cheese | Cheddar |
| Cottage | ||
| Ricotta | ||
| Parmesan | ||
| Others | ||
| Processed Cheese | ||
| By Form | Shredded | |
| Blocks | ||
| Cubes | ||
| Slices | ||
| Others | ||
| By Packaging Type | Tubs | |
| Tins | ||
| Cans | ||
| Others | ||
| By Distribution Channel | On-trade | |
| Off-trade | Convenience Stores | |
| Specialist Retailers | ||
| Supermarkets and Hypermarkets | ||
| Online Retail | ||
| Others | ||
| By Geography | Germany | |
| United Kingdom | ||
| Italy | ||
| France | ||
| Spain | ||
| Netherlands | ||
| Poland | ||
| Belgium | ||
| Sweden | ||
| Rest of Europe | ||


Market Definition
- Butter - Butter is a yellow-to-white solid emulsion of fat globules, water, and inorganic salts produced by churning the cream from cows’ milk
- Dairy - Dairy product include milk and any of the foods made from milk, including butter, cheese, ice cream, yogurt, and condensed and dried milk.
- Frozen Desserts - Frozen dairy dessert means and includes products containing milk or cream and other ingredients which are frozen or semi-frozen prior to consumption, such as ice milk or sherbet, including frozen dairy desserts for special dietary purposes, and sorbet
- Sour Milk Drinks - Sour milk is thick, curdled milk, with a sour taste, obtained from the fermentation of milk. Sour milk drinks such as kefir, laban, buttermilk have been considered in the study
| Keyword | Definition |
|---|---|
| Cultured Butter | Cultured butter is prepared by having the raw butter go through chemical processing and has been added with certain emulsifiers and foreign ingredients. |
| Uncultured Butter | This type of butter is one which has not been processed in any way |
| Natural Cheese | The type of cheese in its most natural form. It is made from natural and simple products and ingredients, including fresh and natural salts, natural colors, enzymes, and high-quality milk. |
| Processed Cheese | Processed cheese undergoes the same processes as natural cheese; however, it requires more steps and many different forms of ingredients. Making processed cheese involves melting natural cheese, emulsifying it, and adding preservatives and other artificial ingredients or colorings. |
| Single Cream | Single cream contains around 18% fat. It’s a single layer of cream that appears over boiled milk. |
| Double Cream | Double cream contains 48% fat, more than double the amount of fat of single cream. It’s heavier and thicker than single cream |
| Whipping Cream | This has a much higher fat percentage than single cream (36%). Used to top cakes, pies, and puddings and as a thickener for sauces, soups, and fillings. |
| Frozen Desserts | Desserts that are meant to be eaten in frozen condition. E.g., sherbets, sorbets, frozen yogurts |
| UHT Milk (Ultra-high temperature milk) | Milk heated at a very high temperature. Ultra-high-temperature processing (UHT) of milk involves heating for 1–8 sec at 135–154°C. which kills the spore-forming pathogenic microorganism, resulting in a product with a shelf-life of several months. |
| Non-dairy butter/Plant-based butter | Butter made from plant-derived oil such as coconut, palm, etc. |
| Non-dairy Yogurt | Yogurt made from typically made from nuts, like almonds, cashews, coconuts, and even other foods like soybeans, plantains, oats, and peas |
| On-trade | It refers to restaurants, QSRs, and bars. |
| Off-trade | It refers to supermarkets, hypermarkets, on-line channels, etc. |
| Neufchatel cheese | One of the oldest kinds of cheese in France. It is a soft, slightly crumbly, mold-ripened, bloomy-rind cheese made in the Neufchâtel-en-Bray region of Normandy. |
| Flexitarian | It refers to a consumer preferring a semi-vegetarian diet, that is centered on plant foods with limited or occasional inclusion of meat. |
| Lactose Intolerance | Lactose intolerance is a reaction in digestive system to lactose, the sugar in milk. It causes uncomfortable symptoms in response to the consumption of dairy products. |
| Cream Cheese | Cream cheese is a soft and creamy fresh cheese with a tangy taste made from milk and cream. |
| Sorbets | Sorbet is a frozen dessert made using ice combined with fruit juice, fruit purée, or other ingredients, such as wine, liqueur, or honey. |
| Sherbet | Sherbet is a sweetened frozen dessert made with fruit and some sort of dairy product such as milk or cream. |
| Shelf stable | Foods that can be safely stored at room temperature, or "on the shelf," for at least one year and do not have to be cooked or refrigerated to eat safely. |
| DSD | Direct Store Delivery is the process in supply chain management wherein the product is delivered from manufacturing plant directly to the retailer. |
| OU Kosher | Orthodox Union Kosher is a kosher certification agency based in New York City. |
| Gelato | Gelato is a frozen creamy dessert made with milk, heavy cream and sugar. |
| Grass-fed Cows | Grass-fed cows are allowed to graze in pastures, where they eat a variety of grasses and clover. |


Research Methodology
Mordor Intelligence follows a four-step methodology in all our reports.
- Step-1: Identify Key Variables: In order to build a robust forecasting methodology, the variables and factors identified in Step 1 are tested against available historical market numbers. Through an iterative process, the variables required for market forecast are set, and the model is built on the basis of these variables.
- Step-2: Build a Market Model: Market-size estimations for the forecast years are in nominal terms. Inflation is not a part of the pricing, and the average selling price (ASP) is kept constant throughout the forecast period for each country.
- Step-3: Validate and Finalize: In this important step, all market numbers, variables, and analyst calls are validated through an extensive network of primary research experts from the market studied. The respondents are selected across levels and functions to generate a holistic picture of the market studied.
- Step-4: Research Outputs: Syndicated Reports, Custom Consulting Assignments, Databases & Subscription Platforms


