
Market Overview
| Study Period | 2021 - 2031 |
|---|---|
| Market Size (2026) | USD 37.96 Billion |
| Market Size (2031) | USD 52.11 Billion |
| Growth Rate (2026 - 2031) | 6.55 % |
| Fastest Growing Market | Middle East and Africa |
| Largest Market | Asia Pacific |
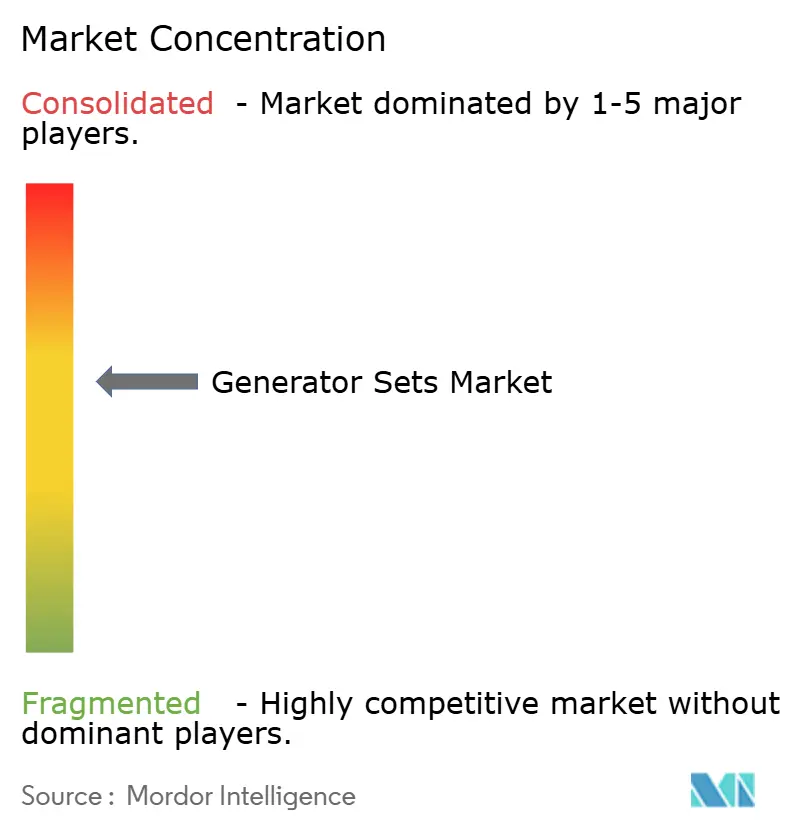
| Market Concentration | Medium |
Major Players *Disclaimer: Major Players sorted in no particular order Image © Mordor Intelligence. Reuse requires attribution under CC BY 4.0. | |
Generator Sets Market Analysis by Mordor Intelligence
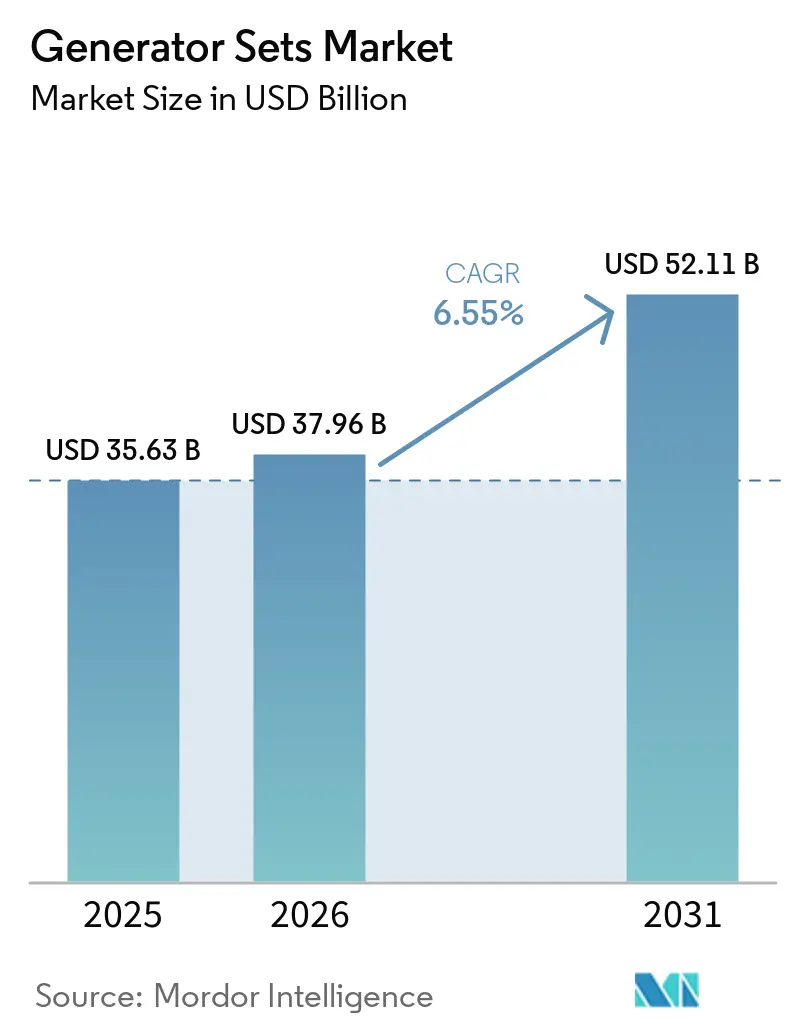
The Generator Sets Market size was valued at USD 35.63 billion in 2025 and estimated to grow from USD 37.96 billion in 2026 to reach USD 52.11 billion by 2031, at a CAGR of 6.55% during the forecast period (2026-2031).
Recent momentum stems from data-center construction, industrial electrification, and persistent grid instability in emerging economies. The generator sets market benefits from a strong aftermarket because fleets run longer hours under volatile weather and volatile grids, raising service revenue. Dual-fuel, hydrogen-ready, and digitally connected models are capturing incremental spend as enterprises align backup strategies with decarbonization targets. Meanwhile, suppliers invest in large-engine production, advanced alternators, and remote analytics to defend share against battery-only solutions that threaten the lower-kVA range.
Key Report Takeaways
- By capacity, the 75–375 kVA segment captured 39.10% of the generator sets market share in 2025, while the 375–750 kVA class is projected to advance at a 8.95% CAGR through 2031.
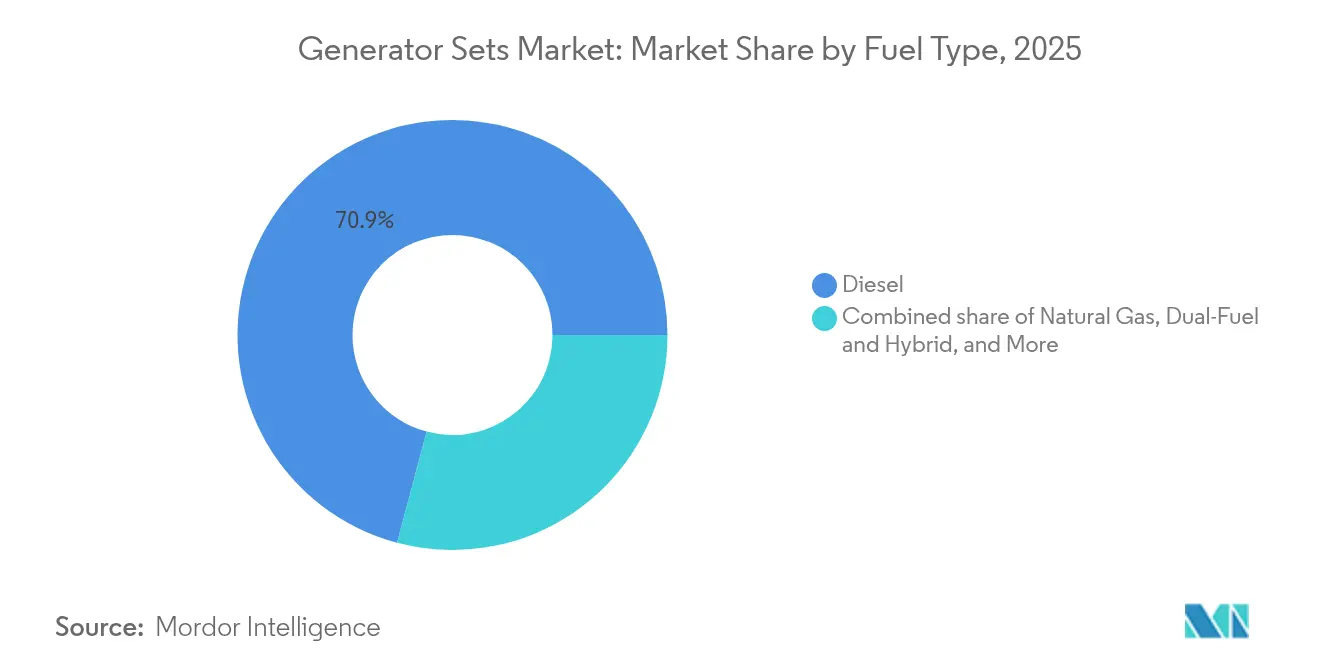
- By fuel type, diesel retained 70.85% of the generator sets market size in 2025; dual-fuel and hybrid units are forecast to expand at a 10.2% CAGR between 2026 and 2031.
- By application, standby power held 49.65% revenue share in 2025, whereas micro-grid and hybrid support systems are expected to climb at an 10.9% CAGR to 2031.
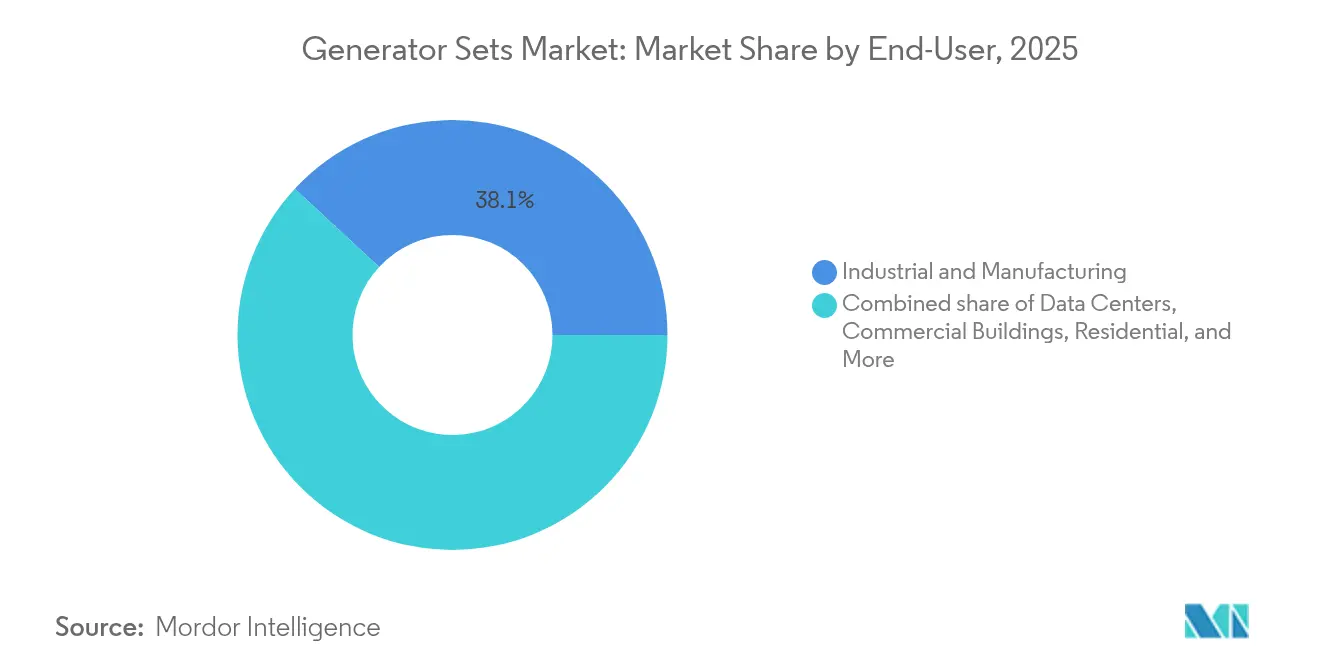
- By end user, industrial and manufacturing facilities accounted for 38.10% of demand in 2025, while data centers are set to grow at a 9.65% CAGR through 2031.
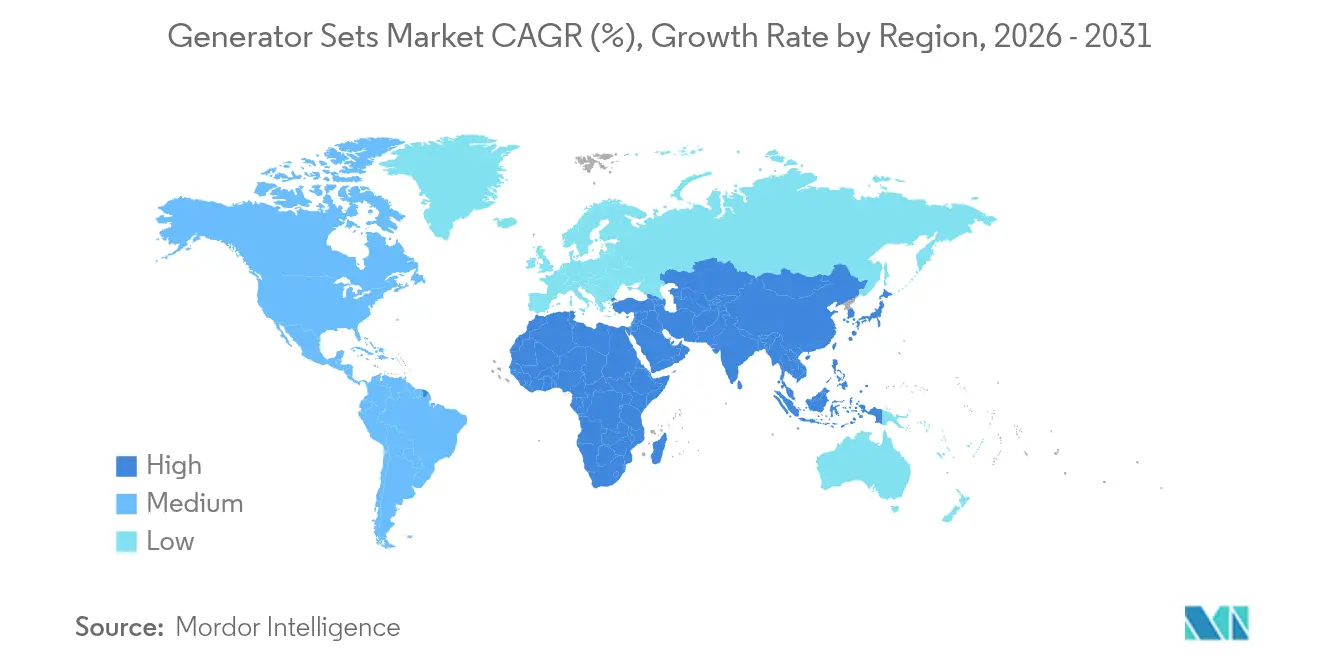
- By geography, Asia-Pacific led with 36.65% of revenue in 2025, whereas the Middle East and Africa region is positioned to post a 9.35% CAGR to 2031.
Note: Market size and forecast figures in this report are generated using Mordor Intelligence’s proprietary estimation framework, updated with the latest available data and insights as of 2026.
Market Trends and Insights
Drivers Impact Analysis of Generator Sets Market*
| Driver | (~) % Impact on CAGR Forecast | Geographic Relevance | Impact Timeline |
|---|---|---|---|
| Grid-reliability concerns in emerging economies | +1.2% | Asia-Pacific; Middle East & Africa; Latin America | Medium term (2–4 years) |
| Surging data-center build-outs worldwide | +0.8% | Global | Short term (≤ 2 years) |
| Rapid industrialisation and construction activities | +0.6% | Asia-Pacific; MEA; Latin America | Medium term (2–4 years) |
| Electrification gaps in off-grid telecom towers | +0.4% | Africa; Southeast Asia; rural India & China | Long term (≥ 4 years) |
| Micro-grid and hybrid system integration demand | +0.3% | Global | Long term (≥ 4 years) |
| Hydrogen-ready dual-fuel gensets gaining traction | +0.2% | Europe; North America; Japan; South Korea | Long term (≥ 4 years) |
| Source: Mordor Intelligence | |||
Grid-reliability concerns in emerging economies
Frequent outages in developing regions continue to compel businesses to treat generator sets as primary and standby assets. Nigeria’s peak generation touched 6,003 MW in 2024, yet persistent supply gaps required most mid-size factories to keep 75–375 kVA diesels running for several hours each day[1]“Nigeria Targets Higher Generation as Supply Gaps Persist,” Nigeria Tribune, tribuneonlineng.com. Similar instability pervades parts of Southeast Asia, Latin America, and Sub-Saharan Africa, where manufacturing losses during unplanned downtime outweigh fuel and maintenance outlays. The reliability driver keeps the generator sets market firmly anchored in diesel because service networks, parts availability, and operator familiarity remain strongest for that fuel class. At the same time, power-quality worries are prompting enterprises to embed digital monitoring and predictive-maintenance modules to squeeze higher uptime from installed fleets.
Surging data-center build-outs worldwide
Hyperscale platforms, colocation providers, and sovereign-cloud programs are spending aggressively on 100% uptime infrastructure. ABB notes that even single-digit-minute utility-grid outages jeopardize turbulent AI workloads, cementing backup generation as a design imperative[2]“Data Centers and the Need for Reliable Backup,” ABB, abb.com. Engineering, Procurement & Construction firms have responded with multi-block, above-2000 kVA designs that can parallel seamlessly and ramp quickly. Pennsylvania's 4.5 GW natural-gas project specifically sized its output around future-proof data-center hypersites. Vendors such as Generac introduced purpose-built, hydrogen-capable gensets for these campuses in early 2025. The trend accelerates procurement cycles, lifting high-capacity unit volume and spurring fresh investment in emissions-aftertreatment to satisfy sustainability scorecards.
Rapid industrialisation and construction activities
New semiconductor fabs, electric-vehicle battery plants, and rail corridors have pushed megaproject spending in the United States 156% above 2019 levels, a trajectory mirrored in India and parts of ASEAN[3]“US Construction Megaprojects Report 2025,” Conexpo-Con/Agg, conexpoconagg.com. Construction sites demand rental and mobile gensets in the 375–750 kVA bracket to energize cranes, welding sets, and temporary offices. Once operational, factories install larger industrial generator units for process-critical standby functions. Emission rules in urban zones are reshaping purchase preferences toward Tier 4F-compliant diesel packages, yet the price differential relative to Tier 2 machines remains manageable given rising unplanned downtime penalties. Manufacturers thus align product roadmaps with mid-range growth, offering quick-ship containerized formats and remote diagnostics as standard features.
Electrification gaps in off-grid telecom towers
Tower companies rolling out 4G and 5G sites across rural Africa and Southeast Asia are deploying hybrid solar-battery-generator architectures to limit diesel run hours. Battery stacks cover predictable evening loads, while controlled genset starts to bridge cloudy or high-demand intervals. Studies by academic groups modeling India’s rural telecom base stations demonstrate lifecycle-cost wins of up to 28% when a small 30 kVA diesel is paired with 20 kWh of lithium-ion storage. Suppliers offering factory-integrated solar MPPT chargers and cloud telemetry secure higher margins than commodity engine builders. Over time, telecom hybridization is expected to shrink pure-diesel volumes below 75 kVA yet open service revenue streams via performance-guarantee contracts.
Restraints Impact Analysis of Generator Sets Market*
| Restraint | (~) % Impact on CAGR Forecast | Geographic Relevance | Impact Timeline |
|---|---|---|---|
| Volatile diesel prices and fuel supply risks | -0.7% | Global | Short term (≤ 2 years) |
| Stricter emission norms for stationary engines | -0.5% | North America; Europe; Asia-Pacific | Medium term (2–4 years) |
| Rising adoption of battery-storage alternatives | -0.4% | North America; Europe; Australia; urban China | Medium term (2–4 years) |
| Cap-ex hesitation amid decarbonization cycles | -0.3% | Developed markets | Long term (≥ 4 years) |
| Source: Mordor Intelligence | |||
Volatile diesel prices and fuel supply risks
Average wholesale diesel in the United States is forecast at USD 3.61 per gallon in 2025 after swinging between USD 3.30 and USD 4.05 during 2024[4]“Diesel Price Forecast 2025,” Intek Freight & Logistics, intekfreight-logistics.com. Industrial prime-power users attribute up to 70% of lifecycle cost to fuel, so unreliability in price and delivery exerts direct pressure on OPEX. Remote mines and island grids are most exposed because shipping disruptions or refinery outages create multi-week shortages. End users are therefore accelerating feasibility studies on gas pipelines, LPG swaps, or stationary battery packs sized for one-hour discharge windows. While diesel retains logistical advantages, procurement patterns increasingly favor suppliers able to bundle forward-fuel contracts or dual-fuel conversion kits that hedge volatility.
Stricter emission norms for stationary engines
The United States Environmental Protection Agency’s Tier 4F mandate slashes NOₓ and particulate emissions by over 90% from Tier 1 baselines, compelling the addition of selective catalytic reduction and diesel particulate filters. California regulators plan Tier 5 steps after 2029 that further tighten limits and may force hourly runtime caps outside emergency events. Europe already requires Stage V compliance for most mobile engines, and the Bay Area Air Quality Management District now extends Tier 4F to standby units below 1,000 BHP. Compliance escalates capital outlays and maintenance complexity, prompting some buyers to leapfrog diesel for gas or hybrid storage where local permitting is simpler. The result is a modest curb on diesel-unit growth, offset partially by premium pricing on advanced aftertreatment packages.
*Our forecasts treat driver/restraint impacts as directional, not additive. The impact forecasts reflect baseline growth, mix effects, and variable interactions.
Generator Sets Market Segment Analysis
By Capacity:
Mid-Range Stability Drives Market FoundationThe generator sets market size for 75–375 kVA reached USD 13.93 billion in 2025, equal to 39.10% of global revenue. Commercial offices, SMEs, and edge-data facilities prize this range for its balance of power and affordability, supporting demand for commercial genset solutions. Growth continues but moderates as installed fleets mature in China and Brazil.
A sharper 8.95% CAGR through 2031 is predicted for 375–750 kVA units, driven by medium-scale factories and high-performance buildings adopting dense HVAC and IoT control loads. Manufacturers respond with smart paralleling kits and Tier 4F compliance to satisfy urban air-quality ordinances. Enlarged alternators offer transient response suitable for elevator banks and semiconductor tools. Larger bands—750–2000 kVA and above-2000 kVA—serve hyperscale data centers, LNG liquefaction, and utility peak-shaving islands. Caterpillar’s USD 725 million Indiana expansion boosts large-engine throughput to capture that premium slice of the generator sets market.
By Fuel Type:
Diesel Dominance Faces Clean-Technology DisruptionDiesel commanded 70.85% of global revenue in 2025 because its energy density, logistics, and service footprint remain unmatched. Rural mining and construction sites continue to specify Tier 2 or Tier 3 engines where regulatory waivers exist.
Yet dual-fuel and hybrid systems log a 10.2% CAGR, far above the 5.29% base-line, as enterprises chase ESG targets without sacrificing reliability. Natural-gas sets exploit stable pipeline tariffs, while hydrogen-blend kits position campuses for net-zero pledges. Mitsubishi, DEUTZ, and Generac have public hydrogen-ready roadmaps, signaling an inevitable mix shift inside the generator sets market. Bio-diesel and renewable synthetic fuels appear under the “Others” banner but gain policy support in Europe’s ReFuelEU framework.



By Application:
Standby Power Foundation Supports Micro-Grid InnovationStandby projects represent 49.65% of 2025 turnover, anchored by life-safety codes for hospitals, telecom COs, and data rooms. Rising extreme-weather events in the Gulf Coast and Southeast Asia reinforce the insurance mindset among facility managers.
The most dynamic slice is micro-grid and hybrid support, slated for an 10.9% CAGR. California Energy Commission pilots reported 20–60% operating-cost savings once AI dispatch optimized generator use. Prime-power units remain vital across off-grid mining and island tourism resorts; rental fleets prosper at construction sites and festivals, pivoting toward Stage V-certified models to enter European urban bids. The generator sets market therefore diversifies from pure emergency play into active energy-management roles.
By End User:
Industrial Foundation Meets Data-Center AccelerationIndustrial and manufacturing users secured 38.10% of 2025 revenue, purchasing mid- to high-kVA sets to protect continuous-process lines. The global onshoring wave for electronics, chemicals, and automotive keeps this base solid.
Data centers post the headline 9.65% CAGR as AI training racks multiply site power densities. Pennsylvania’s 4.5 GW gas plant underscores generation scale tailored to digital workloads. Commercial complexes, healthcare, utilities, and oil-and-gas each preserve distinct requirements— from low-harmonic alternators for MRI suites to explosion-proof housings for FPSOs—expanding the technical canvas of the generator sets market.
Geography Analysis
APAC Generator Sets Market
Asia-Pacific commanded 36.65% of global revenue in 2025. Chinese coastal provinces accelerate factory upgrades, and India’s Production-Linked Incentives spawn clusters that standardize on twin 250 kVA diesel units for 72-hour resilience. ASEAN construction booms add rental fleet demand, while Korea and Japan test hydrogen blends in hospital campuses.
MEA Generator Sets Market
The Middle East and Africa deliver the fastest 9.35% CAGR. GCC diversification toward aluminum, data parks, and green hydrogen drives standby and prime installations. Regional electricity demand could jump 29–37% between 2020 and 2030. Nigerian power-sector revenue rose 70% in 2024, yet supply gaps keep factories on captive sets.
The Americas and Europe Generator Sets Market
North America yields steady replacement cycles plus peak growth in data-center corridors of Virginia and Texas. Europe’s Stage V landscape shifts focus to gas and H₂ blends, while South America benefits from mining trucks, port expansion, and drought-driven hydro shortfalls triggering diesel rentals. The generator sets market therefore shows a balanced geographic portfolio, cushioning cyclical risk.

Regulatory Landscape
Emissions compliance continues to influence generator set design and permitting pathways in major markets. In the United States, Environmental Protection Agency (EPA) Tier 4 Final requirements for nonroad compression-ignition engines drive broad adoption of aftertreatment (DPF and SCR/DEF), especially in higher power categories. This increases both capex and maintenance complexity for diesel-led fleets.
In Europe, Regulation (EU) 2016/1628 (Stage V) governs non-road mobile machinery and is often applied to mobile and rental applications, while stationary installations are frequently governed by local air-quality and ecodesign rules, creating a split compliance environment for the same base engine platform. In India, a tightening certification regime adds further requirements: diesel generator sets under relevant HS codes fall under BIS-related safety compliance under the Machinery and Electrical Equipment Safety Order, with an enforcement deadline referenced as September 1, 2026. That timeline increases documentation and testing needs for imports and domestic supply.
Competitive Landscape
The generator sets market remains moderately fragmented; the top five vendors command roughly 45% of turnover. Caterpillar leverages scale and a broad dealer network to own high-capacity industrial niches. Cummins differentiates through fully integrated switchgear and cloud dashboards. Generac builds breadth across residential, C&I, and battery segments; its 2025 acquisitions of MOTORTECH and PowerPlay sharpen gaseous controls and storage options.
Private equity ramps activity: Blackstone acquired Trystar in 2024, and Platinum Equity rebranded Kohler Energy as Rehlko, targeting complex grid-support contracts. DEUTZ shifted from component maker to solutions provider by buying Blue Star Power Systems, adding USD 100–150 million revenue potential. Early-stage firms pitch hydrogen fuel-cell sets for hospitals seeking zero local emissions.
Digital upgrades drive service annuities. Vendors fit vibration sensors, oil-quality probes, and over-the-air firmware that move maintenance from calendar- to condition-based scheduling, deepening lock-in. Supply-chain dual sourcing of alternators and controllers reduces chip-shortage exposure. Patent strategy tightens around aftertreatment and injector technologies, raising entry barriers and protecting premium segments of the generator sets market.
Generator Sets Industry Leaders
Cummins Inc.
Generac Holdings Inc.
Caterpillar Inc.
Kohler Co.
Rolls-Royce Power Systems (MTU)
- *Disclaimer: Major Players sorted in no particular order
Generator Sets Market Companies Covered in this Report
- Caterpillar Inc.
- Cummins Inc.
- Generac Power Systems
- Kohler Co.
- Rolls-Royce Power Systems (MTU)
- AKSA Power Generation
- Briggs & Stratton Corporation
- Doosan Corporation
- Mitsubishi Heavy Industries Ltd.
- Wartsila Corporation
- Perkins Engines Company Ltd.
- Atlas Copco AB
- FG Wilson (CAT)
- HIMOINSA S.L.
- Yanmar Holdings Co. Ltd.
- Honda India Power Products Ltd.
- Kirloskar Oil Engines Ltd.
- Mahindra Powerol
- JCB Power Products
- Siemens Energy AG
- Aggreko Plc

Market Opportunities and Future Outlook
The clearest white space is in high-power, mission-critical packages built for data centers, where buyers increasingly specify large-megawatt blocks, fast paralleling, and controls that integrate with facility power management. Manufacturers are backing this with production moves. Generac expanded its manufacturing footprint for C&I products in 2026, including a new facility in Sussex, Wisconsin, and it also acquired a Belvidere, Illinois facility in 2026 to expand packaging capacity for large-megawatt generators, aligning supply with hyperscale and colocation build-outs.
A second opportunity is the shift from standalone standby sets to hybridized systems that reduce runtime and support peak shaving and microgrid dispatch. Suppliers that can bundle generator sets with battery energy storage, switchgear, and remote monitoring should find stronger fit with this direction. Recent activity supports that theme, including Generac's prior acquisition of PowerPlay Battery Energy Storage Systems (2024) to scale integrated genset-plus-storage offerings. It also includes Wärtsilä's approximately EUR 90 million program (May 2026) to expand technical production capacity at its Vaasa Sustainable Technology Hub and across its supply chain, reinforcing demand for integrated, compliance-ready configurations and service contracts that help fleets stay optimized under tighter local emissions and permitting constraints.
Recent Industry Developments in Generator Sets Market
- June 2026: Cummins introduced the QSK78 high-horsepower generator set platform to the 50Hz market, positioning it for mission-critical use cases with output up to 3,500 kVA. The launch strengthens Cummins coverage in the above-2,000 kVA class where data centers and large industrial sites demand fast ramp, high reliability, and sophisticated controls.
- December 2025: Cummins Power Generation received a firm-fixed-price contract from the U.S. Army for Large Tactical Power System (LTPS) generators in 500 kW skid configurations, with the award value reported at up to USD 500 million. The contract supports volume visibility for heavy-duty generator production and backs supply-chain commitments for engines, alternators, and controls.
- May 2024: Caterpillar disclosed a USD 90 million upgrade to its Texas plants to produce the Cat C13D engine. The investment expands access to a newer engine platform that supports updated emissions and performance requirements, helping Caterpillar serve both replacement cycles and higher-spec projects.


Generator Sets Market Report Scope and Research Methodology
Market Definition and Coverage
This market is defined as the revenue generated from sales of generator set systems that provide electricity for standby, prime, or peak-shaving use across end users, and is measured in current USD at the global level.
Scope exclusions: Our sizing does not include standalone spare parts and routine service-only revenue that is not sold together with a genset system.
Segments Covered in This Report
- By Capacity
- Below 75 kVA
- 75 to 375 kVA
- 375 to 750 kVA
- 750 to 2,000 kVA
- Above 2,000 kVA
- By Fuel Type
- Diesel
- Natural Gas
- Dual-Fuel and Hybrid
- Renewable/Bio-fuel
- Others
- By Application
- Standby Power
- Prime/Continuous Power
- Peak-Shaving
- Rental/Temporary Power
- Micro-grid and Hybrid Support
- By End-User
- Residential
- Commercial Buildings
- Industrial and Manufacturing
- Data Centers
- Healthcare Facilities
- Oil and Gas
- Utilities and Power
- Mining and Construction
- By Geography
- North America
- United States
- Canada
- Mexico
- Europe
- Germany
- United Kingdom
- France
- Italy
- NORDIC Countries
- Russia
- Rest of Europe
- Asia-Pacific
- China
- India
- Japan
- South Korea
- ASEAN Countries
- Rest of Asia-Pacific
- South America
- Brazil
- Argentina
- Rest of South America
- Middle East and Africa
- Saudi Arabia
- United Arab Emirates
- South Africa
- Egypt
- Rest of Middle East and Africa
- North America
Data Sources, Market Sizing, and Validation
Desk Research
Desk work starts with building a clear demand story for gensets and then mapping it to measurable signals. We relied on public sources such as energy and electricity access statistics from the World Bank, macro indicators from the IMF, trade and tariff line data from UN Comtrade, industrial activity series from national statistics offices, and energy outlooks from the IEA where relevant. These inputs help anchor where backup and prime power demand is structurally higher, and where additions are more cyclical.
We also reviewed company annual reports, investor presentations, and earnings commentary to understand how demand splits across end users and how price realization changes with fuel type and kVA range. In addition, we used paid subscriptions for company financials and intelligence, news and financials, and an import-export shipment-level database to sanity-check large movements in volumes and pricing by region. The desk research sources listed here are illustrative only, and many other public documents and datasets were also used to collect, validate, and clarify the analysis.
Primary Interviews and Surveys
Primary work was used to pressure-test assumptions that desk sources cannot settle cleanly, especially around typical selling prices by kVA band, mix shifts between standby and prime demand, and channel markups by region. We spoke with a balanced set of stakeholders, including OEM-side functions, distributors and integrators, rental and service ecosystem participants, and large end users in commercial and industrial settings. For a global market, inputs were intentionally gathered across APAC, EMEA, and the Americas so our demand drivers and pricing logic reflect regional buying patterns rather than one local cycle.
Distribution of primary research fieldwork respondents
| Company type | Respondent position | Region |
|---|---|---|
| Top tier: 25% | CXOs: 13% | APAC: 42% |
| Mid tier: 61% | Functional/Unit leaders: 27% | EMEA: 36% |
| Smaller Players: 14% | Managers: 60% | Americas: 22% |
Market-Sizing & Forecasting
Sizing was built using top-down and bottom-up logic so the final number stays explainable and repeatable. On the top-down side, we reconstructed the addressable spend by linking electricity reliability and outage exposure, new construction and industrial activity, and generator penetration by end user into a regional demand pool that is then priced using typical ASP ranges by kVA and fuel type. Once totals were formed, they were cross-checked with selective bottom-up approximations, such as sampled ASP x unit volumes by kVA bands and channel checks on large project cycles, and then adjusted where the two views consistently disagreed.
Key inputs used in the model (illustrative) included kVA mix shifts, diesel versus gas share changes, standby versus prime application mix, average selling price progression by kVA band, and regional demand signals tied to grid additions and outage patterns. Where bottom-up visibility was patchy in smaller countries, gaps were handled by using proxy indicators like construction starts and industrial output, followed by revalidation through interviews.
For forecasting, scenario analysis was applied to separate steady replacement demand from cyclical new demand, and then the scenarios were aligned to expected trends in grid reliability, fuel availability, and end-user capex plans shared by interviewees. This keeps the forecast responsive to real triggers without making it depend on hard-to-get data.
Data Validation & Update Cycle
Validation is done in layers so large errors get caught early. Model outputs are compared with independent signals such as regional import trends for genset categories, public construction and industrial series, and reported order commentary in financial disclosures, and then any sharp variance is investigated for timing, currency, or mix effects. Before sign-off, the work is reviewed in multiple analyst steps so assumptions, math, and scope interpretation are aligned.
The report is refreshed annually, and interim updates are made when major events materially change demand or pricing assumptions. Before delivery, a final pass is completed to confirm that the latest releases, policy changes, and material market moves have been reflected.
Mordor Intelligence's Generator Sets Market Sizing Compared With Other Published Estimates
Published market sizes for generator sets often do not match because analysts draw the scope line differently and then apply different pricing and mix assumptions. Differences also show up when one estimate is anchored to a different base year, or when currency conversion timing and inflation treatment are not handled the same way.
Some external figures bundle adjacent power equipment and broader power-backup spending into the same total, and they may also apply aggressive ASP expansion across all kVA bands. In the split-contrast sense, Mordor Intelligence counts only complete generator set systems aligned to capacity, fuel, application, and end-user definitions, and it keeps pricing tied to kVA-level mix and region checks rather than spreading one blended price uplift across the whole market.
Benchmark comparison
| Source | Market Size | Gaps in Research Methodology |
|---|---|---|
| Mordor Intelligence | USD 37.96 B (2026) | |
| Industry Publisher A | USD 35.20 B (2024) | Uses an earlier base year and a longer historical window, which can understate the later-cycle lift in large kVA demand, and the scope description does not clearly separate system sales from broader category coverage in all regions. |
| Global Consultancy B | USD 34.17 B (2024) | Anchors sizing to 2024 and applies a higher forward growth rate, which can widen differences if ASP progression and application mix (standby versus prime) are not rechecked by kVA bands and regions. |
Across the three published points, the spread is mainly explained by base-year choice and how tightly the counted revenue is limited to complete genset systems versus broader power equipment spend. By keeping the inputs traceable to a few repeatable drivers, like kVA mix, application mix, and region-level demand signals, the estimate stays practical to audit and update year to year.


Key Questions Answered in the Report
How large is the generator sets market in 2026?
The generator sets market size stands at USD 37.96 billion in 2026.
Which capacity band grows fastest?
Sets rated 375–750 kVA post the highest 8.95% CAGR thanks to medium-scale industrial and commercial projects.
Why is the dual-fuel segment accelerating?
Dual-fuel and hybrid gensets grow at 10.2% CAGR as users seek lower emissions without sacrificing runtime flexibility.
What region leads future growth?
The Middle East and Africa post the quickest 9.35% CAGR, driven by industrial diversification and power-supply gaps.
How are batteries changing backup strategies?
Lithium-ion covers short outages, so many sites adopt hybrid battery-genset systems for cost-optimized resilience.
Which end user demands the most aggressive uptime?
Data centers expand at 9.65% CAGR, requiring N+2 redundancy and often hydrogen-ready engines to meet sustainability goals.
Page last updated on:




