Middle East Data Center Market Overview
| Study Period | 2018 - 2030 |
| Base Year For Estimation | 2024 |
| Forecast Data Period | 2025 - 2030 |
| Market Volume (2025) | 1.46 Thousand MW |
| Market Volume (2030) | 3.23 Thousand MW |
| Growth Rate (2025 - 2030) | 17.25% CAGR |
| Market Concentration | Low |
Major Players*Disclaimer: Major Players sorted in no particular order |

Middle East Data Center Market Analysis
The Middle East Data Center Market size is estimated at 1.46 thousand MW in 2025, and is expected to reach 3.23 thousand MW by 2030, growing at a CAGR of 17.25%. Further, the market is expected to generate colocation revenue of USD 1,576.3 Million in 2025 and is projected to reach USD 4,702.9 Million by 2030, growing at a CAGR of 24.44% during the forecast period (2025-2030).
The Middle East data center landscape is undergoing rapid transformation driven by ambitious digital initiatives and smart city developments across the region. Government-led digital transformation programs are reshaping modern communities, with the United Arab Emirates emerging as a frontrunner in establishing a competitive digital economy. The UAE's commitment to digital advancement is evident through its impressive internet penetration rate of 99.0% as of early 2022, positioning it as a prime location for data center investments. Qatar's industrial sector has demonstrated remarkable growth, with 60 new factories becoming operational and contributing over USD 15 billion to the GDP, highlighting the region's expanding digital infrastructure requirements.
The data center market is witnessing significant investments in sustainable and technologically advanced facilities. A notable development is the partnership between Khazna Data Centers and Masdar City to construct a ground-mounted solar photovoltaic plant, demonstrating the industry's commitment to renewable energy adoption. The trend toward green data centers is gaining momentum, with facilities incorporating innovative cooling systems and energy-efficient technologies. These developments align with the region's broader sustainability goals while addressing the growing demand for data processing and storage capabilities.
Strategic partnerships and consolidation activities are reshaping the competitive landscape. Major telecommunications providers and technology companies are forming alliances to strengthen their market presence and expand their service offerings. The merger between Etisalat Group and G42's data center offerings has created the largest data center provider in the UAE, highlighting the industry's move toward consolidation for enhanced operational efficiency. This trend is expected to continue as organizations seek to build more robust and scalable infrastructure solutions.
The industry is experiencing a shift toward higher-tier facilities and enhanced security protocols. Data centers are increasingly adopting advanced security measures and obtaining international certifications to meet the growing demands of enterprise clients. The rise of edge computing and the need for low-latency applications are driving the development of distributed data center networks across the region. These facilities are being designed with redundant power systems and advanced cooling technologies to ensure maximum uptime and operational efficiency, catering to the evolving needs of digital businesses and government initiatives.
Middle East Data Center Market Trends
Growing number of mobile users and expanding 5G population coverage across the regional countries boosts the market growth
- The GCC countries have experienced substantial changes in ICT use over the past two decades, resulting in a considerable impact on the services offered to users due to developing digital infrastructure. Internet and telecommunications services are much more common in the region than they are globally, especially in GCC, with the proportion of internet users to the total population in GCC reaching 98.21%, compared to the global average of 63%, which is practically the highest in all geographic areas.
- In GCC, the total number of mobile users makes up roughly 137.66% of the population, compared to the global average of about 55%. ICT services in the GCC region are developing quickly due to the region's continued influx of new commercial mobile service providers, causing a sharp rise in the number of users. Around two-thirds of wireless network operators in the Middle East launched 5G networks, expanding 5G population coverage across the regional countries. The majority of Middle Eastern countries have already implemented commercial 4G services.
- The increasing OTT consumption also boosted data traffic for each smartphone. For instance, Etisalat released its Life TV iOS app in 2013, a year after MBC's Shahid TV app surpassed it as the most downloaded Middle Eastern app. OSN revealed the debut of Go for non-pay TV users. In the Middle East, there are large regional differences in the accessibility and cost of super-fast networks. The deployment of various OTT platforms and speed improvements may result in a greater demand for rack space, leading to a rise in the number of data centers in the Middle East.

Understand The Key Trends Shaping This Market
Download PDF
Prioritizing digital initiatives, such as 5G, digital payment and attracting sizable population of working immigrants boost the market demand
- To shift toward a knowledge-based economy, the UAE and Saudi Arabian governments are prioritizing digital initiatives, such as 5G. Due to state-wide consumer initiatives like digital payment, smartphones are leading the move to a digital lifestyle. The region's quick rebound of business and leisure travel, as well as permissive long-term visa policies like Golden Visas, which are stimulating investments across sectors from real estate to start-ups, are supporting the robust smartphone market recovery in the short term. International events, especially the FIFA World Cup in Qatar in 2022, may also present opportunities for various corporate sectors in neighboring nations.
- Though the region is attracting a sizable population of working immigrants, creating fresh demand for mass-market products, it is extremely wealthy. The Middle East accounts for more than half of global sales value except for Turkey. Apple and Samsung are the market leaders in the smartphone segment, accounting for approximately 96% of shipping volume combined.
- Device activations in the Middle East increased Y-o-Y, growing by an average of 23% in 2022. Larger markets like Iraq and Egypt, which continued to grow despite having enormous current user bases, were the main drivers of this expansion. The amount of raw data is expected to increase due to smartphone penetration and the use of 5G devices. The number of smartphone users may lead to the use of more data and the internet. The need for more data centers and higher regional utilization rates may boost the demand for the servers required to store and process the data.

OTHER KEY INDUSTRY TRENDS COVERED IN THE REPORT
- The increasing investments for the expansion of 5G network by Operators and region vision to grow digital by 2030 drives the growth of the market
- Growing demand for the bandwidth, FTTH penetration, and Government initivatives to develop fiber Deployment drives the growth of the market
- Transition to Fiber and GCC governments initiatives to roll out fiber optic cables nationwide trends boost the market demand
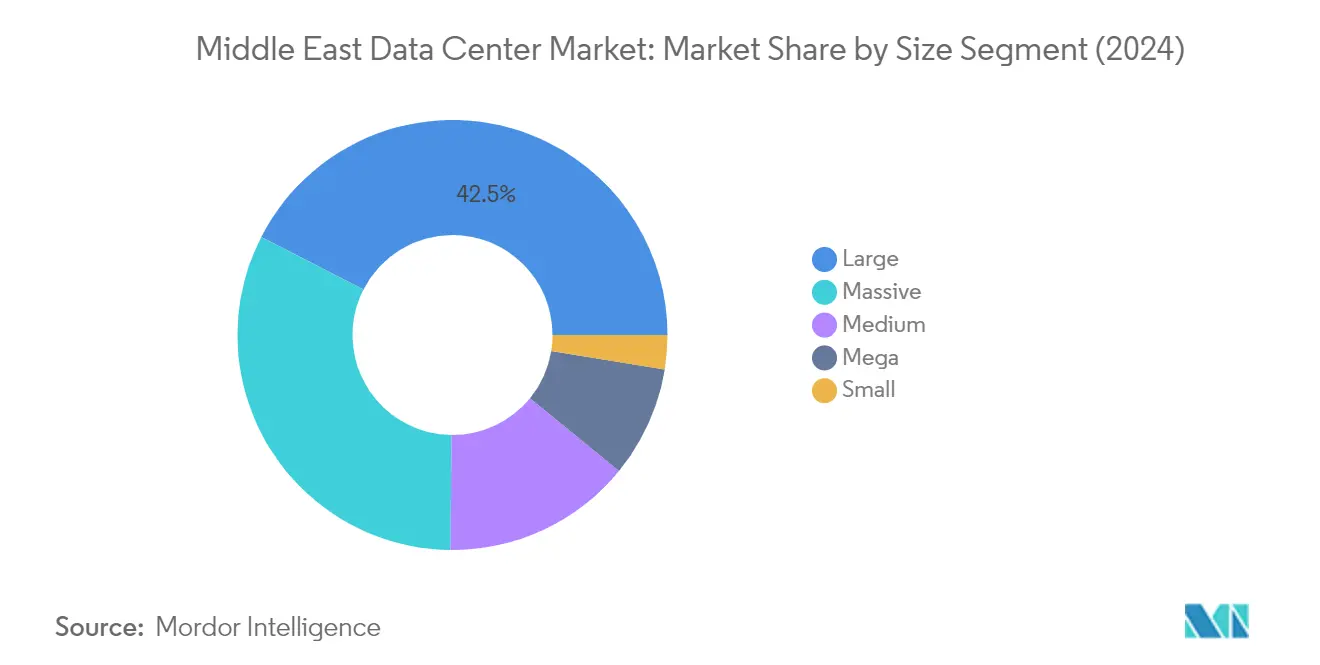
Segment Analysis: Data Center Size
Large Segment in Middle East Data Center Market
The large segment dominates the Middle East data center market, holding approximately 42% market share in 2024. This significant market position is driven by enterprises' preference for data centers with advanced features such as robust data security protocols, remote assistance capabilities, and cost-effectiveness. The segment's prominence is further strengthened by the strategic locations of large data centers across major cities, including Dubai, Abu Dhabi, Riyadh, Haifa, and Tel Aviv. These facilities primarily serve major cloud service providers, telecommunications companies, and financial institutions that require substantial computing power and storage capabilities while maintaining high security standards and operational efficiency.
Mega Segment in Middle East Data Center Market
The mega segment is emerging as the fastest-growing category in the market, expected to grow at approximately 45% during 2024-2029. This remarkable growth trajectory is primarily driven by the increasing adoption of streaming services, online gaming platforms, smart home automation devices, and smart city services across the Middle East region. The segment's expansion is further supported by large businesses' growing demand for data centers with high bandwidth capabilities, low latency requirements, and comprehensive disaster recovery solutions. The development of mega data centers is also aligned with various government initiatives and smart city projects across the region, particularly in the UAE and Saudi Arabia.
Remaining Segments in Data Center Size
The massive, medium, and small segments each play distinct roles in serving different market needs. The massive segment caters to organizations requiring extensive infrastructure for cloud services and large-scale data processing. The medium segment serves enterprises seeking balanced solutions with moderate capacity and reasonable costs, particularly appealing to regional businesses and government agencies. The small segment primarily addresses the requirements of small and medium enterprises (SMEs) looking for cost-effective data center solutions with basic infrastructure capabilities. These segments collectively provide a comprehensive range of options to meet diverse business requirements across the Middle East region.
Segment Analysis: Tier Type
Tier 3 Segment in Middle East Data Center Market
The Tier 3 segment dominates the Middle East data center market, accounting for approximately 69% of the total market share in 2024. This significant market presence is attributed to the segment's high level of redundancy and multiple power and cooling paths, offering an impressive uptime of around 99.982% with only 1.6 hours of downtime per year. The segment's prominence is particularly evident in major cities like Dubai, which leads with about 21% of Tier 3 facilities, followed by Abu Dhabi at 16% and Jeddah at 14%. Large data centers currently constitute about 59% of the Tier 3 segment, with major operators like Khazna Data Center holding a market share of nearly 20%, followed by Etihad Etisalat Company and Etisalat with market shares of 19% and 9% respectively.
Tier 4 Segment in Middle East Data Center Market
The Tier 4 segment is projected to experience the most rapid growth in the Middle East data center market from 2024 to 2029, with an expected growth rate of approximately 27%. This remarkable growth trajectory is driven by the increasing demand for complete fault tolerance and redundancy across all components. Currently, there are 11 Tier 4-certified data centers operating across strategic locations including Riyadh, Dammam, Haifa, Tirat Carmel, Jerusalem, Rosh HaAyin, Tel Aviv, Central Israel, Abu Dhabi, Dubai, Tehran, and Manama. The segment's expansion is particularly strong in Dammam, which holds about 32% of Tier 4 facilities, followed by Riyadh at 15% and Haifa at 14%, reflecting the growing emphasis on high-reliability data center infrastructure in these regions.
Remaining Segments in Tier Type
The Tier 1 and 2 segment represents the basic level of data center infrastructure in the Middle East market. These facilities primarily serve small businesses requiring basic data storage and processing capabilities with relatively affordable pricing structures. While this segment maintains a presence in key locations such as Riyadh, Al Qassim, Dammam, Dubai, Tehran, and Muscat, it is experiencing a gradual decline as businesses increasingly opt for higher-tier facilities that offer enhanced data security protocols and advanced infrastructure services. The segment's role remains relevant for organizations with minimal computing requirements and budget constraints, though its market influence continues to diminish in favor of more advanced tier classifications.
Segment Analysis: Absorption
Utilized Segment in Middle East Data Center Market
The Utilized segment dominates the Middle East data center market, accounting for approximately 81% of the total IT load capacity in 2024. This significant market share is driven by the increasing adoption of cloud services, growing telecommunications infrastructure, and rising demand from various end-user industries including BFSI, e-commerce, and government sectors. The segment's dominance is further strengthened by the rapid digital transformation initiatives across the region, particularly in countries like the UAE and Saudi Arabia, where government-led programs are accelerating the adoption of digital services. The utilized capacity is primarily concentrated in Tier 3 and Tier 4 data centers, reflecting the region's focus on high-quality infrastructure development and reliable service delivery.
Non-Utilized Segment in Middle East Data Center Market
The Non-Utilized segment in the Middle East data center market is projected to grow at approximately 12% CAGR from 2024 to 2029. This growth is primarily driven by the increasing investments in new data center facilities across the region, particularly in emerging markets and developing cities. The expansion is supported by various factors including the establishment of new business hubs, increasing foreign investments, and the growing need for backup and redundancy capacity. The segment's growth is also influenced by the strategic planning of data center operators who maintain reserve capacity to accommodate future expansion needs and ensure operational flexibility in response to sudden demand surges.
Middle East Data Center Market Geography Segment Analysis
Middle East Data Center Market in United Arab Emirates
The United Arab Emirates stands as the dominant force in the UAE data center market, commanding approximately 42% of the total market share in 2024. The country's leadership position is strengthened by its well-established fiber broadband network and strategic initiatives focused on developing a robust digital economy. The UAE's commitment to technological advancement is evident through its comprehensive smart city initiatives and favorable policies for data center investments. The ease of obtaining construction permits and a progressive regulatory framework have made it an attractive destination for both regional and international data center operators. The country's strategic geographical location, coupled with its advanced telecommunications infrastructure, positions it as a crucial digital hub connecting Europe, Asia, and Africa. The UAE's focus on sustainable data center development is particularly noteworthy, with several facilities incorporating renewable energy solutions and innovative cooling technologies to reduce environmental impact. The government's proactive approach in developing digital infrastructure and supporting emerging technologies like artificial intelligence and cloud computing continues to drive the expansion of data center capabilities across major cities like Dubai and Abu Dhabi.
Middle East Data Center Market in Saudi Arabia
Saudi Arabia is experiencing remarkable growth in its Saudi Arabia data center market, with projections indicating an impressive growth rate of approximately 18% from 2024 to 2029. The Kingdom's digital transformation journey is closely aligned with its Vision 2030 objectives, which aim to establish the country as a leading digital hub in the region. The government's substantial investment in digital infrastructure development has created fertile ground for data center expansion. The implementation of advanced technologies and the growing adoption of cloud services are driving significant demand for data center services across the Kingdom. Saudi Arabia's strategic focus on developing smart cities and implementing cutting-edge digital solutions has attracted major global technology players to establish their presence in the market. The country's commitment to sustainable development is reflected in its initiatives to power data centers through renewable energy sources. The government's proactive approach in providing preferential power rates and tax incentives for cloud computing providers has further strengthened the market's growth potential. The Kingdom's emphasis on localizing technology services and developing digital capabilities has created a robust ecosystem for data center operations.
Middle East Data Center Market in Israel
Israel's data center market is characterized by its advanced technological infrastructure and strong focus on innovation. The country's position as a global tech hub has attracted significant investments in data center infrastructure, particularly from multinational corporations seeking to establish their presence in the region. Israel's robust startup ecosystem and leadership in quantum computing initiatives have created substantial demand for advanced data center services. The government's commitment to expanding fiber optic infrastructure and improving internet connectivity has strengthened the foundation for data center operations. The country's emphasis on cybersecurity and data protection has led to the development of highly secure and sophisticated data center facilities. Israel's strategic location and advanced technological capabilities have made it an attractive destination for companies requiring high-performance computing and data processing capabilities. The market benefits from a highly skilled workforce and a strong culture of technological innovation, which continues to drive advancements in data center operations and management.
Middle East Data Center Market in Other Countries
The GCC data center market in other Middle Eastern countries, including Qatar, Oman, Iran, Bahrain, and Jordan, demonstrates varying levels of development and potential. These markets are characterized by their unique approaches to digital transformation and infrastructure development. Qatar's emergence as a popular cloud hub has attracted global hyperscalers, while Bahrain's early adoption of cloud services has positioned it as a pioneer in the region. Oman's focus on ICT development aligns with its long-term diversification plans, creating opportunities for data center expansion. The growing emphasis on digital government services and smart city initiatives across these countries continues to drive demand for data center services. These markets benefit from increasing regional connectivity and the growing adoption of digital services across various sectors. The development of regulatory frameworks and investment in digital infrastructure across these countries reflects the region's commitment to establishing robust digital economies. The varying stages of market maturity in these countries present unique opportunities for data center operators and service providers.
Get Analysis on Important Geographic Markets
Download PDF
Middle East Data Center Industry Overview
Top Companies in Middle East Data Center Market
The Middle East data center market is characterized by significant product innovation and operational advancements among leading players. Companies are increasingly focusing on developing carrier-neutral facilities with advanced security protocols and environmental certifications to meet growing customer demands. Strategic partnerships with global technology providers and cloud service companies have become a common trend to enhance service offerings and market reach. Operational agility is demonstrated through the rapid deployment of new facilities and the upgrading of existing infrastructure to support emerging technologies like 5G and IoT. Market leaders are actively expanding their geographical footprint through greenfield projects and acquisitions, particularly in key metropolitan areas across Saudi Arabia, UAE, and Israel. The industry is witnessing substantial investments in sustainable technologies and energy-efficient solutions, with companies implementing innovative cooling systems and renewable energy sources to reduce operational costs and environmental impact.
Regional Players Dominate Growing Market Landscape
The Middle East data center market exhibits a unique blend of regional telecommunications giants and specialized data center operators. Local conglomerates, particularly state-backed telecom companies, maintain a strong market presence due to their established infrastructure and government relationships. The market structure shows moderate consolidation, with regional players like Etihad Etisalat Company, Khazna Data Center, and MedOne holding significant market shares. These companies leverage their deep understanding of local markets and regulatory environments to maintain competitive advantages over international players.
The market is experiencing increased merger and acquisition activity as companies seek to expand their capabilities and market presence. Strategic partnerships between local and international players are becoming more common, enabling knowledge transfer and technological advancement. Regional operators are actively pursuing horizontal integration to expand their service portfolios and geographical coverage. The competitive landscape is evolving with the entry of international hyperscale providers, driving established players to enhance their service offerings and operational efficiency through strategic alliances and technological upgrades.
Innovation and Sustainability Drive Future Success
Success in the Middle East data center market increasingly depends on operators' ability to deliver innovative, sustainable solutions while maintaining high reliability and security standards. Incumbent players must focus on developing next-generation facilities that incorporate advanced cooling technologies, renewable energy sources, and automated management systems. Market leaders are strengthening their positions by investing in skilled workforce development, establishing strategic partnerships with technology providers, and maintaining strong relationships with government entities. The ability to offer customized solutions for specific industry verticals while maintaining cost competitiveness will be crucial for maintaining market share.
For contenders looking to gain ground, differentiation through specialized services and technological innovation presents significant opportunities. New entrants must focus on developing niche market segments and establishing strong local partnerships to overcome entry barriers. The market's future success factors include the ability to adapt to evolving regulatory requirements, particularly around data sovereignty and environmental sustainability. Companies must also address the growing demand for edge computing capabilities and hybrid infrastructure solutions while maintaining high security standards. The development of value-added services and the ability to serve specific industry verticals will become increasingly important for market success. Companies in the UAE, such as data center companies in UAE, are at the forefront of these innovations, driving the market forward.
Middle East Data Center Market Leaders
-
Bezeq International General Partner Ltd
-
EdgeConneX Inc.
-
Etihad Etisalat Company (Mobily)
-
Etisalat
-
MEEZA
- *Disclaimer: Major Players sorted in no particular order

Need More Details on Market Players and Competitors?
Download PDF
Middle East Data Center Market News
- October 2023: Mohamed bin Ali bin Mohamed Al-Mannai, the Minister of Communications and Information Technology, launched the M-VAULT 4's fourth data center building. Customers in Qatar can access cloud services through the Microsoft Cloud data center region housed in the new data center facility.
- October 2022: The company announced the development of DXB2 and DXB3 with a joint capacity of 43 MW of IT load. The DXB3 facility is an extension of an existing facility transferred to Khazna following the strategic partnership between G42 and e&.
- October 2022: The prominent network of hyperscale data centers in the Middle East and North African region and a joint venture between Khazna Data Centers and Masdar and EDF are the factors that helped ink a deal to build a ground-mounted solar photovoltaic (PV) plant to power Khazna's new data center in Masdar City.
Free With This Report
We provide a complimentary and exhaustive set of data points on the country and regional level metrics that present the fundamental structure of the industry. Presented in the form of 50+ free charts, the sections cover difficult to find data on various countries on smartphone users, data traffic per smartphone, mobile and broadband data speed, fiber connectivity network, and submarine cables.


List of Tables & Figures
- Figure 1:
- VOLUME OF IT LOAD CAPACITY, MW, MIDDLE EAST, 2018 - 2030
- Figure 2:
- VOLUME OF RAISED FLOOR AREA, SQ.FT. ('000), MIDDLE EAST, 2018 - 2030
- Figure 3:
- VALUE OF COLOCATION REVENUE, USD MILLION, MIDDLE EAST, 2018 - 2030
- Figure 4:
- VOLUME OF INSTALLED RACKS, NUMBER, MIDDLE EAST, 2018 - 2030
- Figure 5:
- RACK SPACE UTILIZATION, %, MIDDLE EAST, 2018 - 2030
- Figure 6:
- COUNT OF SMARTPHONE USERS, IN MILLION, MIDDLE EAST, 2018 - 2030
- Figure 7:
- DATA TRAFFIC PER SMARTPHONE, GB, MIDDLE EAST, 2018 - 2030
- Figure 8:
- AVERAGE MOBILE DATA SPEED, MBPS, MIDDLE EAST, 2018 - 2030
- Figure 9:
- AVERAGE BROADBAND SPEED, MBPS, MIDDLE EAST, 2018 - 2030
- Figure 10:
- LENGTH OF FIBER CONNECTIVITY NETWORK, KILOMETER, MIDDLE EAST, 2018 - 2030
- Figure 11:
- VOLUME OF IT LOAD CAPACITY, MW, MIDDLE EAST, 2018 - 2030
- Figure 12:
- VOLUME OF DATA CENTER SIZE, MW, MIDDLE EAST, 2018 - 2030
- Figure 13:
- VOLUME SHARE OF DATA CENTER SIZE, %, MIDDLE EAST, 2018 - 2030
- Figure 14:
- VOLUME SIZE OF LARGE, MW, MIDDLE EAST, 2018 - 2030
- Figure 15:
- VOLUME SHARE OF LARGE, MW, DATA CENTER SIZE, %, MIDDLE EAST, 2018 - 2030
- Figure 16:
- VOLUME SIZE OF MASSIVE, MW, MIDDLE EAST, 2018 - 2030
- Figure 17:
- VOLUME SHARE OF MASSIVE, MW, DATA CENTER SIZE, %, MIDDLE EAST, 2018 - 2030
- Figure 18:
- VOLUME SIZE OF MEDIUM, MW, MIDDLE EAST, 2018 - 2030
- Figure 19:
- VOLUME SHARE OF MEDIUM, MW, DATA CENTER SIZE, %, MIDDLE EAST, 2018 - 2030
- Figure 20:
- VOLUME SIZE OF MEGA, MW, MIDDLE EAST, 2018 - 2030
- Figure 21:
- VOLUME SHARE OF MEGA, MW, DATA CENTER SIZE, %, MIDDLE EAST, 2018 - 2030
- Figure 22:
- VOLUME SIZE OF SMALL, MW, MIDDLE EAST, 2018 - 2030
- Figure 23:
- VOLUME SHARE OF SMALL, MW, DATA CENTER SIZE, %, MIDDLE EAST, 2018 - 2030
- Figure 24:
- VOLUME OF TIER TYPE, MW, MIDDLE EAST, 2018 - 2030
- Figure 25:
- VOLUME SHARE OF TIER TYPE, %, MIDDLE EAST, 2018 - 2030
- Figure 26:
- VOLUME SIZE OF TIER 1 AND 2, MW, MIDDLE EAST, 2018 - 2030
- Figure 27:
- VOLUME SHARE OF TIER 1 AND 2, MW, TIER TYPE, %, MIDDLE EAST, 2018 - 2030
- Figure 28:
- VOLUME SIZE OF TIER 3, MW, MIDDLE EAST, 2018 - 2030
- Figure 29:
- VOLUME SHARE OF TIER 3, MW, TIER TYPE, %, MIDDLE EAST, 2018 - 2030
- Figure 30:
- VOLUME SIZE OF TIER 4, MW, MIDDLE EAST, 2018 - 2030
- Figure 31:
- VOLUME SHARE OF TIER 4, MW, TIER TYPE, %, MIDDLE EAST, 2018 - 2030
- Figure 32:
- VOLUME OF ABSORPTION, MW, MIDDLE EAST, 2018 - 2030
- Figure 33:
- VOLUME SHARE OF ABSORPTION, %, MIDDLE EAST, 2018 - 2030
- Figure 34:
- VOLUME SIZE OF NON-UTILIZED, MW, MIDDLE EAST, 2018 - 2030
- Figure 35:
- VOLUME SHARE OF NON-UTILIZED, MW, ABSORPTION, %, MIDDLE EAST, 2018 - 2030
- Figure 36:
- VOLUME OF COLOCATION TYPE, MW, MIDDLE EAST, 2018 - 2030
- Figure 37:
- VOLUME SHARE OF COLOCATION TYPE, %, MIDDLE EAST, 2018 - 2030
- Figure 38:
- VOLUME SIZE OF HYPERSCALE, MW, MIDDLE EAST, 2018 - 2030
- Figure 39:
- VOLUME SHARE OF HYPERSCALE, MW, COLOCATION TYPE, %, MIDDLE EAST, 2018 - 2030
- Figure 40:
- VOLUME SIZE OF RETAIL, MW, MIDDLE EAST, 2018 - 2030
- Figure 41:
- VOLUME SHARE OF RETAIL, MW, COLOCATION TYPE, %, MIDDLE EAST, 2018 - 2030
- Figure 42:
- VOLUME SIZE OF WHOLESALE, MW, MIDDLE EAST, 2018 - 2030
- Figure 43:
- VOLUME SHARE OF WHOLESALE, MW, COLOCATION TYPE, %, MIDDLE EAST, 2018 - 2030
- Figure 44:
- VOLUME OF END USER, MW, MIDDLE EAST, 2018 - 2030
- Figure 45:
- VOLUME SHARE OF END USER, %, MIDDLE EAST, 2018 - 2030
- Figure 46:
- VOLUME SIZE OF BFSI, MW, MIDDLE EAST, 2018 - 2030
- Figure 47:
- VOLUME SIZE OF CLOUD, MW, MIDDLE EAST, 2018 - 2030
- Figure 48:
- VOLUME SIZE OF E-COMMERCE, MW, MIDDLE EAST, 2018 - 2030
- Figure 49:
- VOLUME SIZE OF GOVERNMENT, MW, MIDDLE EAST, 2018 - 2030
- Figure 50:
- VOLUME SIZE OF MANUFACTURING, MW, MIDDLE EAST, 2018 - 2030
- Figure 51:
- VOLUME SIZE OF MEDIA & ENTERTAINMENT, MW, MIDDLE EAST, 2018 - 2030
- Figure 52:
- VOLUME SIZE OF TELECOM, MW, MIDDLE EAST, 2018 - 2030
- Figure 53:
- VOLUME SIZE OF OTHER END USER, MW, MIDDLE EAST, 2018 - 2030
- Figure 54:
- VOLUME OF COUNTRY, MW, MIDDLE EAST, 2018 - 2030
- Figure 55:
- VOLUME SHARE OF COUNTRY, %, MIDDLE EAST, 2018 - 2030
- Figure 56:
- VOLUME SIZE OF ISRAEL, MW, ISRAEL, 2018 - 2030
- Figure 57:
- VOLUME SIZE OF SAUDI ARABIA, MW, SAUDI ARABIA, 2018 - 2030
- Figure 58:
- VOLUME SIZE OF UNITED ARAB EMIRATES, MW, UNITED ARAB EMIRATES, 2018 - 2030
- Figure 59:
- VOLUME SIZE OF REST OF MIDDLE EAST, MW, REST OF MIDDLE EAST, 2018 - 2030
- Figure 60:
- VOLUME SHARE OF MAJOR PLAYERS, %, MIDDLE EAST
Middle East Data Center Industry Segmentation
Large, Massive, Medium, Mega, Small are covered as segments by Data Center Size. Tier 1 and 2, Tier 3, Tier 4 are covered as segments by Tier Type. Non-Utilized, Utilized are covered as segments by Absorption. Israel, Saudi Arabia, United Arab Emirates are covered as segments by Country.| Data Center Size | Large | |||
| Massive | ||||
| Medium | ||||
| Mega | ||||
| Small | ||||
| Tier Type | Tier 1 and 2 | |||
| Tier 3 | ||||
| Tier 4 | ||||
| Absorption | Non-Utilized | |||
| Utilized | By Colocation Type | Hyperscale | ||
| Retail | ||||
| Wholesale | ||||
| By End User | BFSI | |||
| Cloud | ||||
| E-Commerce | ||||
| Government | ||||
| Manufacturing | ||||
| Media & Entertainment | ||||
| Telecom | ||||
| Other End User | ||||
| Country | Israel | |||
| Saudi Arabia | ||||
| United Arab Emirates | ||||
| Rest of Middle East | ||||
Need A Different Region or Segment?
Customize Now
Market Definition
- IT LOAD CAPACITY - The IT load capacity or installed capacity, refers to the amount of energy consumed by servers and network equipments placed in a rack installed. It is measured in megawatt (MW).
- ABSORPTION RATE - It denotes the extend to which the data center capacity has been leased out. For instance, a 100 MW DC has leased out 75 MW, then absorption rate would be 75%. It is also referred as utilization rate and leased-out capacity.
- RAISED FLOOR SPACE - It is an elevated space build over the floor. This gap between the original floor and the elevated floor is used to accommodate wiring, cooling, and other data center equipment. This arrangement assist in having proper wiring and cooling infrastructure. It is measured in square feet (ft^2).
- DATA CENTER SIZE - Data Center Size is segmented based on the raised floor space allocated to the data center facilities. Mega DC - # of Racks must be more than 9000 or RFS (raised floor space) must be more than 225001 Sq. ft; Massive DC - # of Racks must be in between 9000 and 3001 or RFS must be in between 225000 Sq. ft and 75001 Sq. ft; Large DC - # of Racks must be in between 3000 and 801 or RFS must be in between 75000 Sq. ft and 20001 Sq. ft; Medium DC # of Racks must be in between 800 and 201 or RFS must be in between 20000 Sq. ft and 5001 Sq. ft; Small DC - # of Racks must be less than 200 or RFS must be less than 5000 Sq. ft.
- TIER TYPE - According to Uptime Institute the data centers are classified into four tiers based on the proficiencies of redundant equipment of the data center infrastructure. In this segment the data center are segmented as Tier 1,Tier 2, Tier 3 and Tier 4.
- COLOCATION TYPE - The segment is segregated into 3 categories namely Retail, Wholesale and Hyperscale Colocation service. The categorization is done based on the amount of IT load leased out to potential customers. Retail colocation service has leased capacity less than 250 kW; Wholesale colocation services has leased capacity between 251 kW and 4 MW and Hyperscale colocation services has leased capacity more than 4 MW.
- END CONSUMERS - The Data Center Market operates on a B2B basis. BFSI, Government, Cloud Operators, Media and Entertainment, E-Commerce, Telecom and Manufacturing are the major end-consumers in the market studied. The scope only includes colocation service operators catering to the increasing digitalization of the end-user industries.
| Keyword | Definition |
|---|---|
| Rack Unit | Generally referred as U or RU, it is the unit of measurement for the server unit housed in the racks in the data center. 1U is equal to 1.75 inches. |
| Rack Density | It defines the amount of power consumed by the equipment and server housed in a rack. It is measured in kilowatt (kW). This factor plays a critical role in data center design and, cooling and power planning. |
| IT Load Capacity | The IT load capacity or installed capacity, refers to the amount of energy consumed by servers and network equipment placed in a rack installed. It is measured in megawatt (MW). |
| Absorption Rate | It denotes how much of the data center capacity has been leased out. For instance, if a 100 MW DC has leased out 75 MW, then the absorption rate would be 75%. It is also referred to as utilization rate and leased-out capacity. |
| Raised Floor Space | It is an elevated space built over the floor. This gap between the original floor and the elevated floor is used to accommodate wiring, cooling, and other data center equipment. This arrangement assists in having proper wiring and cooling infrastructure. It is measured in square feet/meter. |
| Computer Room Air Conditioner (CRAC) | It is a device used to monitor and maintain the temperature, air circulation, and humidity inside the server room in the data center. |
| Aisle | It is the open space between the rows of racks. This open space is critical for maintaining the optimal temperature (20-25 °C) in the server room. There are primarily two aisles inside the server room, a hot aisle and a cold aisle. |
| Cold Aisle | It is the aisle wherein the front of the rack faces the aisle. Here, chilled air is directed into the aisle so that it can enter the front of the racks and maintain the temperature. |
| Hot Aisle | It is the aisle where the back of the racks faces the aisle. Here, the heat dissipated from the equipment’s in the rack is directed to the outlet vent of the CRAC. |
| Critical Load | It includes the servers and other computer equipment whose uptime is critical for data center operation. |
| Power Usage Effectiveness (PUE) | It is a metric which defines the efficiency of a data center. It is calculated by: (𝑇𝑜𝑡𝑎𝑙 𝐷𝑎𝑡𝑎 𝐶𝑒𝑛𝑡𝑒𝑟 𝐸𝑛𝑒𝑟𝑔𝑦 𝐶𝑜𝑛𝑠𝑢𝑚𝑝𝑡𝑖𝑜𝑛)/(𝑇𝑜𝑡𝑎𝑙 𝐼𝑇 𝐸𝑞𝑢𝑖𝑝𝑚𝑒𝑛𝑡 𝐸𝑛𝑒𝑟𝑔𝑦 𝐶𝑜𝑛𝑠𝑢𝑚𝑝𝑡𝑖𝑜𝑛). Further, a data center with a PUE of 1.2-1.5 is considered highly efficient, whereas, a data center with a PUE >2 is considered highly inefficient. |
| Redundancy | It is defined as a system design wherein additional component (UPS, generators, CRAC) is added so that in case of power outage, equipment failure, the IT equipment should not be affected. |
| Uninterruptible Power Supply (UPS) | It is a device that is connected in series with the utility power supply, storing energy in batteries such that the supply from UPS is continuous to IT equipment even during utility power is snapped. The UPS primarily supports the IT equipment only. |
| Generators | Just like UPS, generators are placed in the data center to ensure an uninterrupted power supply, avoiding downtime. Data center facilities have diesel generators and commonly, 48-hour diesel is stored in the facility to prevent disruption. |
| N | It denotes the tools and equipment required for a data center to function at full load. Only "N" indicates that there is no backup to the equipment in the event of any failure. |
| N+1 | Referred to as 'Need plus one', it denotes the additional equipment setup available to avoid downtime in case of failure. A data center is considered N+1 when there is one additional unit for every 4 components. For instance, if a data center has 4 UPS systems, then for to achieve N+1, an additional UPS system would be required. |
| 2N | It refers to fully redundant design wherein two independent power distribution system is deployed. Therefore, in the event of a complete failure of one distribution system, the other system will still supply power to the data center. |
| In-Row Cooling | It is the cooling design system installed between racks in a row where it draws warm air from the hot aisle and supplies cool air to the cold aisle, thereby maintaining the temperature. |
| Tier 1 | Tier classification determines the preparedness of a data center facility to sustain data center operation. A data center is classified as Tier 1 data center when it has a non-redundant (N) power component (UPS, generators), cooling components, and power distribution system (from utility power grids). The Tier 1 data center has an uptime of 99.67% and an annual downtime of <28.8 hours. |
| Tier 2 | A data center is classified as Tier 2 data center when it has a redundant power and cooling components (N+1) and a single non-redundant distribution system. Redundant components include extra generators, UPS, chillers, heat rejection equipment, and fuel tanks. The Tier 2 data center has an uptime of 99.74% and an annual downtime of <22 hours. |
| Tier 3 | A data center having redundant power and cooling components and multiple power distribution systems is referred to as a Tier 3 data center. The facility is resistant to planned (facility maintenance) and unplanned (power outage, cooling failure) disruption. The Tier 3 data center has an uptime of 99.98% and an annual downtime of <1.6 hours. |
| Tier 4 | It is the most tolerant type of data center. A Tier 4 data center has multiple, independent redundant power and cooling components and multiple power distribution paths. All IT equipment are dual powered, making them fault tolerant in case of any disruption, thereby ensuring interrupted operation. The Tier 4 data center has an uptime of 99.74% and an annual downtime of <26.3 minutes. |
| Small Data Center | Data center that has floor space area of ≤ 5,000 Sq. ft or the number of racks that can be installed is ≤ 200 is classified as a small data center. |
| Medium Data Center | Data center which has floor space area between 5,001-20,000 Sq. ft, or the number of racks that can be installed is between 201-800, is classified as a medium data center. |
| Large Data Center | Data center which has floor space area between 20,001-75,000 Sq. ft, or the number of racks that can be installed is between 801-3,000, is classified as a large data center. |
| Massive Data Center | Data center which has floor space area between 75,001-225,000 Sq. ft, or the number of racks that can be installed is between 3001-9,000, is classified as a massive data center. |
| Mega Data Center | Data center that has a floor space area of ≥ 225,001 Sq. ft or the number of racks that can be installed is ≥ 9001 is classified as a mega data center. |
| Retail Colocation | It refers to those customers who have a capacity requirement of 250 kW or less. These services are majorly opted by small and medium enterprises (SMEs). |
| Wholesale Colocation | It refers to those customers who have a capacity requirement between 250 kW to 4 MW. These services are majorly opted by medium to large enterprises. |
| Hyperscale Colocation | It refers to those customers who have a capacity requirement greater than 4 MW. The hyperscale demand primarily originates from large-scale cloud players, IT companies, BFSI, and OTT players (like Netflix, Hulu, and HBO+). |
| Mobile Data Speed | It is the mobile internet speed a user experiences via their smartphones. This speed is primarily dependent on the carrier technology being used in the smartphone. The carrier technologies available in the market are 2G, 3G, 4G, and 5G, where 2G provides the slowest speed while 5G is the fastest. |
| Fiber Connectivity Network | It is a network of optical fiber cables deployed across the country, connecting rural and urban regions with high-speed internet connection. It is measured in kilometer (km). |
| Data Traffic per Smartphone | It is a measure of average data consumption by a smartphone user in a month. It is measured in gigabyte (GB). |
| Broadband Data Speed | It is the internet speed that is supplied over the fixed cable connection. Commonly, copper cable and optic fiber cable are used in both residential and commercial use. Here, optic cable fiber provides faster internet speed than copper cable. |
| Submarine Cable | A submarine cable is a fiber optic cable laid down at two or more landing points. Through this cable, communication and internet connectivity between countries across the globe is established. These cables can transmit 100-200 terabits per second (Tbps) from one point to another. |
| Carbon Footprint | It is the measure of carbon dioxide generated during the regular operation of a data center. Since, coal, and oil & gas are the primary source of power generation, consumption of this power contributes to carbon emissions. Data center operators are incorporating renewable energy sources to curb the carbon footprint emerging in their facilities. |
Need More Details on Market Definition?
Ask a Question
Research Methodology
Mordor Intelligence follows a four-step methodology in all our reports.
- Step-1: Identify Key Variables: In order to build a robust forecasting methodology, the variables and factors identified in Step-1 are tested against available historical market numbers. Through an iterative process, the variables required for market forecast are set and the model is built on the basis of these variables.
- Step-2: Build a Market Model: Market-size estimations for the forecast years are in nominal terms. Inflation is not a part of the pricing, and the average selling price (ASP) is kept constant throughout the forecast period for each country.
- Step-3: Validate and Finalize: In this important step, all market numbers, variables and analyst calls are validated through an extensive network of primary research experts from the market studied. The respondents are selected across levels and functions to generate a holistic picture of the market studied.
- Step-4: Research Outputs: Syndicated Reports, Custom Consulting Assignments, Databases & Subscription Platforms

Get More Details On Research Methodology
Download PDF


