
Fuel Cell Commercial Vehicle Market Size and Share
Market Overview
| Study Period | 2020 - 2031 |
|---|---|
| Market Size (2026) | USD 1.81 Billion |
| Market Size (2031) | USD 6.23 Billion |
| Growth Rate (2026 - 2031) | 28.10 % |
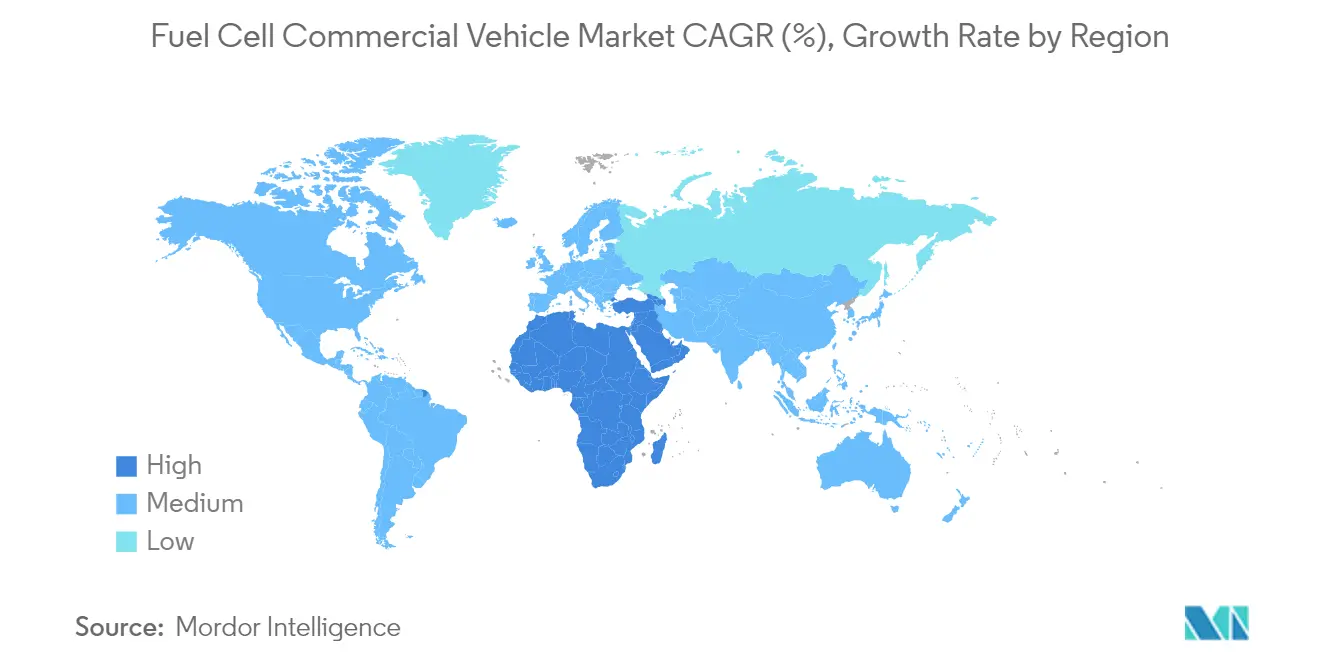
| Fastest Growing Market | Middle East and Africa |
| Largest Market | Asia Pacific |
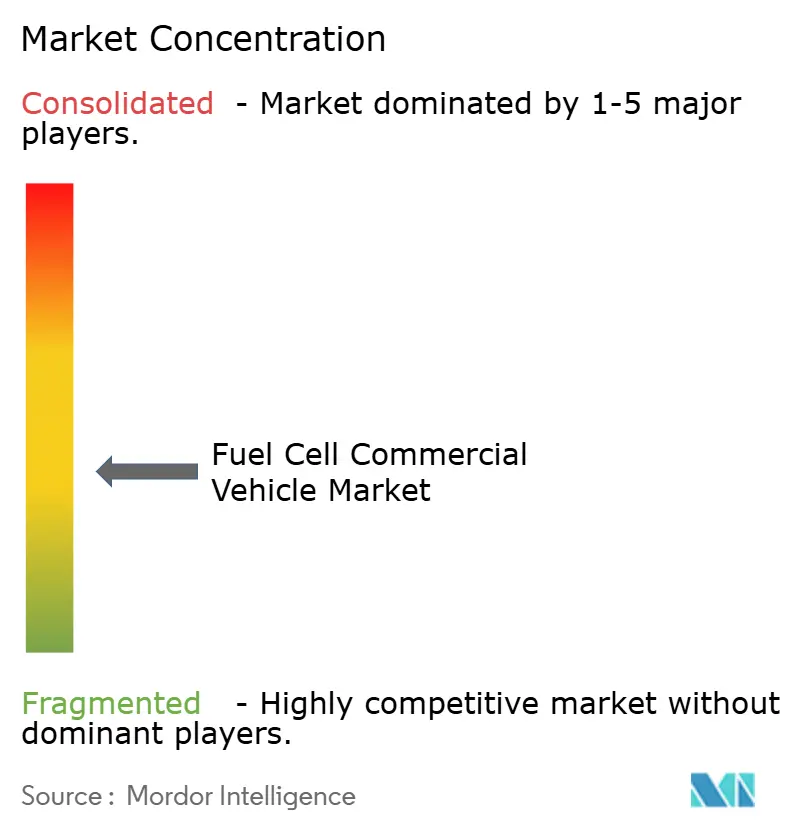
| Market Concentration | Medium |
Major Players *Disclaimer: Major Players sorted in no particular order Image © Mordor Intelligence. Reuse requires attribution under CC BY 4.0. | |
Fuel Cell Commercial Vehicle Market Analysis by Mordor Intelligence
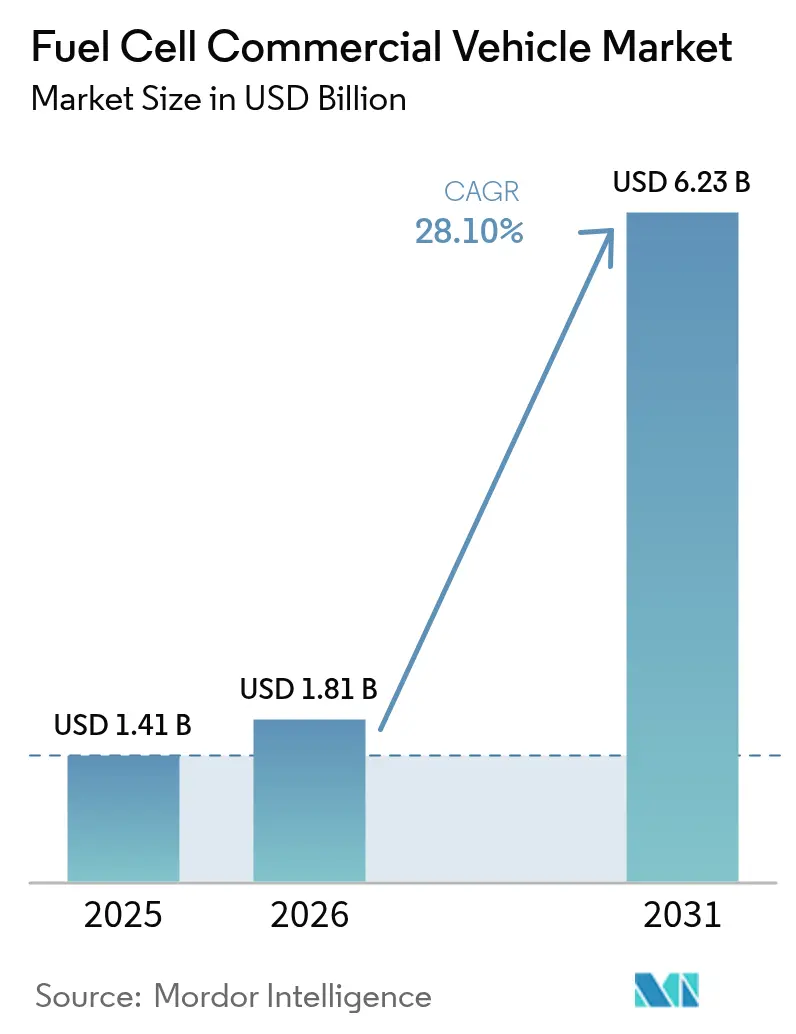
The fuel cell commercial vehicle market size was valued at USD 1.41 billion in 2025 and estimated to grow from USD 1.81 billion in 2026 to reach USD 6.23 billion by 2031, at a CAGR of 28.10% during the forecast period (2026-2031). A tight regulatory climate, the rapid fall in renewable-based hydrogen costs, and a widening corporate net-zero freight commitments push sales volumes higher yearly. Technology gains notably a fuel-cell system cost target of USD 80/kW by 2025, helping large fleets cross total-cost-of-ownership thresholds on routes over 400 km. Regional hydrogen corridors anchored around Rotterdam and Los Angeles remove early-stage infrastructure anxiety while port authorities set firm zero-emission freight targets. These forces encourage OEMs to scale production, lower per-unit costs, and launch commercial models for long-haul logistics, not just urban buses.
Key Report Takeaways
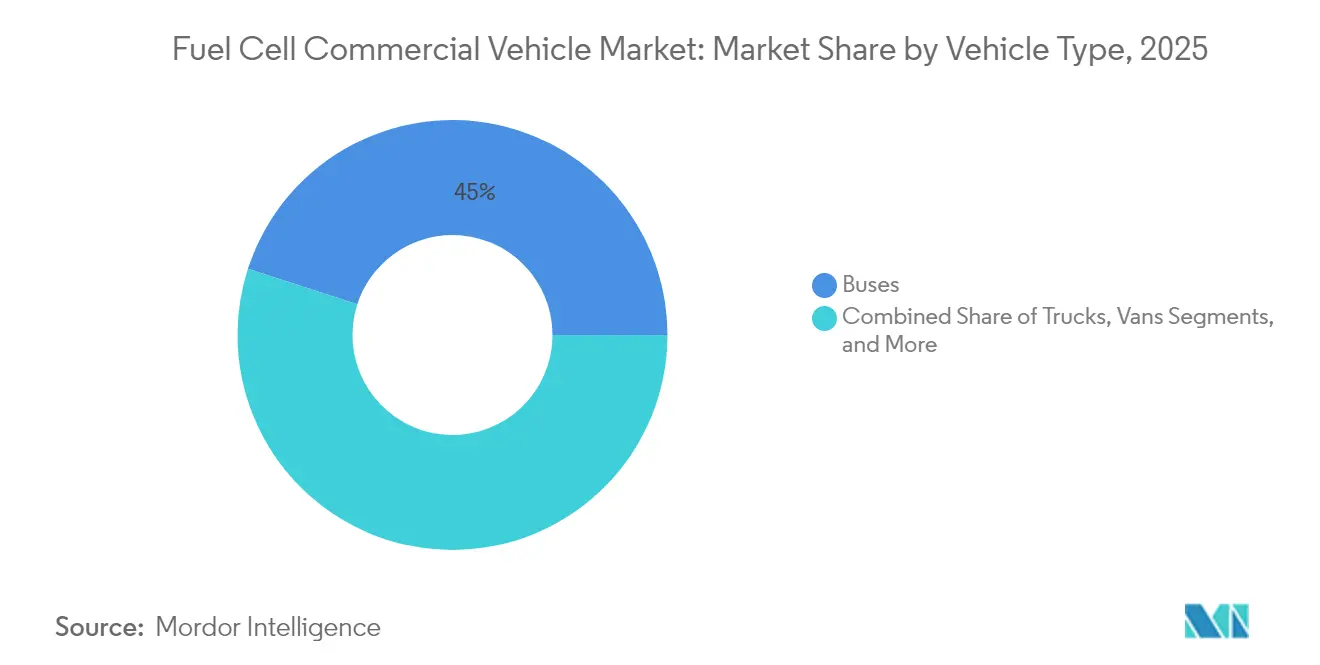
- By vehicle type, buses led the market with 45.02% of the fuel cell commercial vehicle market share in 2025, while trucks are forecast to grow at a 30.45% CAGR to 2031.
- By fuel cell type, PEMFC dominated with an 80.65% share in 2025; SOFC is expected to expand at a 30.75% CAGR through 2031.
- By power range, the 100–200 kW band accounted for 52.05% of the fuel cell commercial vehicle market size in 2025, whereas systems above 200 kW are set to rise at a 28.85% CAGR up to 2031.
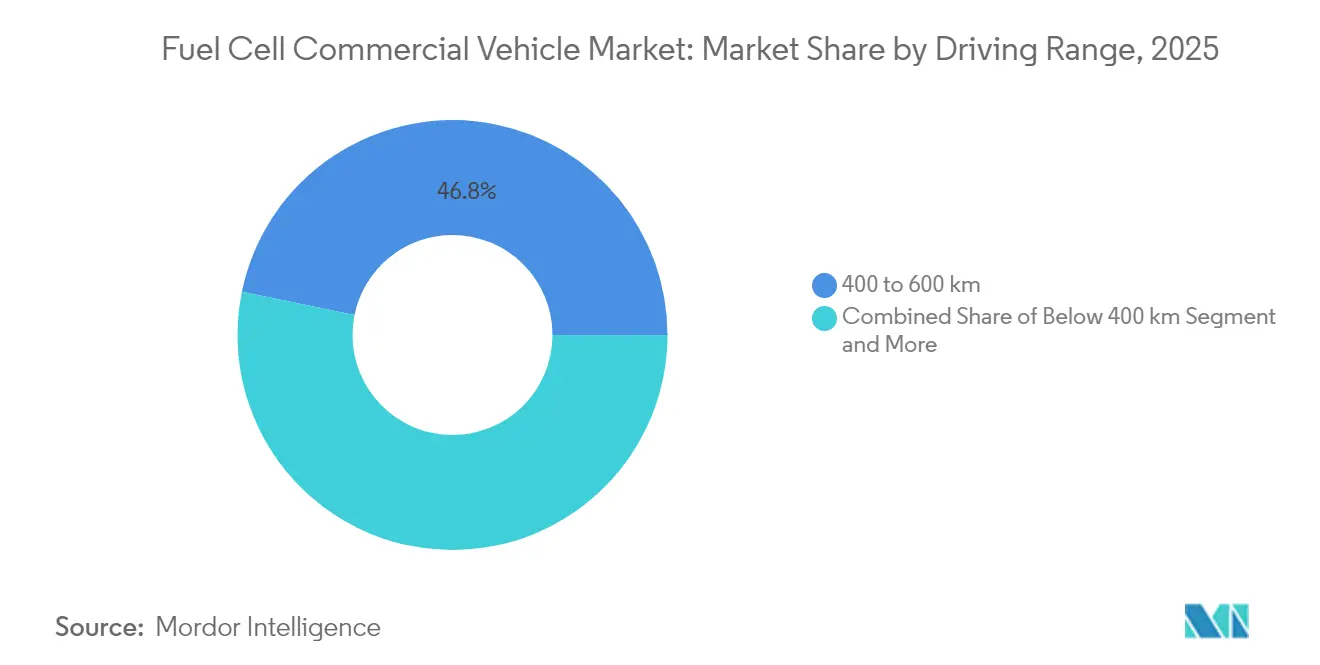
- By driving range, the 400–600 km bracket captured 46.78% of market share in 2025, while vehicles exceeding 600 km are projected to surge at a 29.65% CAGR to 2031.
- By end-user, public transit fleets held a 47.62% share of the fuel cell commercial vehicle market size in 2025; long-haul freight and logistics are advancing at a 30.90% CAGR through 2031.
- By region, Asia-Pacific commanded a 41.05% share in 2025, whereas the Middle East and Africa region is expected to be the fastest-growing region, with a projected 28.60% CAGR through 2031.
Note: Market size and forecast figures in this report are generated using Mordor Intelligence’s proprietary estimation framework, updated with the latest available data and insights as of 2026.
Market Trends and Insights
Drivers Impact Analysis of Fuel Cell Commercial Vehicle Market*
| Driver | (~) % Impact on CAGR Forecast | Geographic Relevance | Impact Timeline |
|---|---|---|---|
| Stringent Emission Regulations for Trucks and Buses | +7.8% | Europe; spillover to North America and Asia-Pacific | Medium term (2-4 years) |
| Zero-Emission Mandates for Urban Bus Fleets | +5.2% | North America (California and peers) | Short term (≤ 2 years) |
| Hydrogen Production Cost Declines in China | +4.5% | Asia-Pacific led by China | Medium term (2-4 years) |
| TCO Parity for More Than 400 km Long-Haul Trucks in Nordics | +4.2% | Europe (Nordic cluster) | Medium term (2-4 years) |
| Corporate Net-Zero Freight Alliances | +3.9% | Global, concentrated in Europe and North America | Medium term (2-4 years) |
| Port-Centric Hydrogen Corridors | +3.4% | Major port cities in Europe and North America | Short term (≤ 2 years |
| Source: Mordor Intelligence | |||
Stringent Emission Regulations for Commercial Vehicles
The EU “Fit-for-55” package requires a 90% emissions cut from heavy-duty vehicles by 2040, with interim targets of 45% by 2030 and 65% by 2035.[1]European Commission, “Reducing CO₂ Emissions from Heavy-Duty Vehicles,” climate.ec.europa.eu To curb emissions from the transportation sector, revised CO2 standards now encompass a broader spectrum of heavy-duty vehicles (HDVs). The updated regulations now include buses, coaches, trailers, and vocational trucks, collectively accounting for over 90% of HDV sales. OEMs are accelerating fuel-cell programs to meet the tougher standards, particularly for long-haul operations where battery mass and charging downtime remain challenging.
Zero-Emission Mandates for Urban Bus Fleets in North America
California’s Innovative Clean Transit Regulation compels transit operators to transition to 100% zero-emission fleets by 2040. Purchases must already be 25% zero-emission, reaching 50% by 2026. Federal grants of USD 1.5 billion in 2024 funded roughly 600 additional buses, and full-size fuel-cell electric bus deployments grew 55% year-over-year. Agencies prefer fuel-cell platforms for blocks above 250 km, requiring dual battery packs if executed with pure BEVs, compromising seating capacity. Operators also report that ambient-temperature-insensitive refuelling simplifies service planning in cold northern climates.
Corporate Net-Zero Freight Alliances Accelerating OEM Purchase Commitments
Hyundai’s NorCAL ZERO fleet of 30 XCIENT trucks logged nearly 450,000 miles since September 2023.[2]Hyundai Motor Company, “Hyundai Motor Unveils the New XCIENT Heavy-Duty Fuel Cell Truck at ACT Expo 2025,” hyundai.com Similar fleet pilots by Ford and HTWO Logistics are locking in multi-year vehicle orders, creating scale incentives that shorten payback periods for OEMs and hydrogen suppliers. As more shippers peg Scope-3 emissions targets to the Science-Based Targets Initiative timelines, OEMs receive clearer volume visibility, enabling higher-capacity stack production runs and reducing per-vehicle mark-ups. Credit-rating agencies have started to view such alliance-backed truck orders as investment-grade revenue streams, lowering the cost of capital for debut hydrogen truck leasing platforms.
Port-Centric Hydrogen Corridors Spurring Early Adoption
Rotterdam and Los Angeles are bundling clean hydrogen supply, refueling stations, and heavy-duty truck pilots into integrated corridors. California alone plans 100 stations to serve 1.5 million zero-emission vehicles by 2025. California's clean hydrogen hub is set to take shape with a hefty USD 1.2 billion backing from the Alliance for Renewable Clean Hydrogen Energy Systems (ARCHES), targeting a production milestone of 45,000 tons daily by 2045.[3]California Energy Commission, “2024 Zero-Emission Vehicle Infrastructure Plan,” energy.ca.gov Port-centric initiatives are laying the groundwork for the broader adoption of hydrogen fuel cell vehicles.
Restraints Impact Analysis of Fuel Cell Commercial Vehicle Market*
| Restraint | (~) % Impact on CAGR Forecast | Geographic Relevance | Impact Timeline |
|---|---|---|---|
| High Infrastructure Costs for Hydrogen Refueling Stations | -5.20% | Global, acute in emerging markets | Medium term (2-4 years) |
| Competition from Battery-Electric Trucks in Short-Haul | -4.80% | Regions with mature charging networks | Short term (≤ 2 years) |
| Slow Roll-Out of Green Hydrogen Supply in Emerging Markets | -4.70% | Asia (ex China), Africa, South America | Long term (≥ 4 years) |
| Fuel-Cell Durability Concerns in Heavy-Duty Cycles | -3.90% | Global, harsher climates worst affected | Medium term (2-4 years) |
| Source: Mordor Intelligence | |||
Fuel-Cell Durability Concerns in Heavy-Duty Cycles
Despite recent technological advances, fuel cell systems for heavy-duty applications still grapple with significant durability concerns. Heavy trucks require systems capable of at least 25,000 operating hours. The Million Mile Fuel Cell Truck Consortium targets 30,000 hours by 2030. UCLA’s 2025 breakthrough of more than 200,000 hours in lab tests addresses lifetime anxiety but is still moving toward scaled commercial validation. These technologies have yet to be widely commercialized and integrated into production vehicles.
Competition from Battery-Electric Trucks in Short-Haul
Battery-electric trucks already beat diesel on total cost in China and are on track for parity in the EU and the U.S. by 2030.[4]International Energy Agency, “Global EV Outlook 2025 – Executive Summary,” iea.org Rapid charger rollouts and mandated driver rest periods favor depot-charging solutions under 200 km, capping hydrogen’s near-term addressable volume on local routes. In contrast, hydrogen fuel cell trucks are less cost-effective than battery electric trucks, indicating a competitive landscape in commercial vehicle electrification.
*Our forecasts treat driver/restraint impacts as directional, not additive. The impact forecasts reflect baseline growth, mix effects, and variable interactions.
Fuel Cell Commercial Vehicle Market Segment Analysis
By Vehicle Type:
Buses Lead Adoption While Trucks AccelerateBuses held 45.02% of the hydrogen fuel cell commercial vehicle market share in 2025 as transit agencies tapped dedicated funding lines to replace aging diesel fleets. Solaris captured 65% of European fuel-cell bus registrations, reflecting OEM specialization in depot-based operations. Orders such as Orange County Transportation Authority’s 40 FCEBs underscore the segment’s traction. Momentum benefits from predictable routes and return-to-depot refueling, traits that fit 350-bar compressed-gas systems and simplify daily operations for maintenance teams. Procurement frameworks that bundle vehicles with fueling contracts further improve budget certainty for public-sector buyers.
Trucks are forecast to outpace buses with a 30.45% CAGR from 2026 to 2031, moving the hydrogen fuel cell commercial vehicle market toward freight logistics. Nikola’s 500-mile TRE FCEV and Hyundai’s XCIENT class-8 platform are positioned for hub-to-hub logistics, exploiting 20-minute refueling and higher payload headroom over BEVs. Corporate freight alliances provide offtake guarantees that help banks underwrite new refueling stations. As green hydrogen supply stabilizes, total-cost parity on 400-600 km lanes is expected to unlock nationwide rollouts across Nordic and Central European freight corridors.



By Fuel Cell Type:
PEMFC Dominance Challenged by SOFC InnovationPEMFC technology commanded 80.65% of the fuel cell commercial vehicle market in 2025, valued for its rapid start-up and tolerance to frequent load changes. Platinum loading per stack continues to fall, closing cost gaps while meeting city-bus duty cycles. Fleet trials in California show PEMFC buses exceeding 20,000 hours with degradation under 10%, reinforcing operator confidence in multi-shift service.
Solid Oxide Fuel Cell (SOFC) is expected to grow at a 30.75% CAGR through 2031. Electrical efficiency up to 60%, combined with tolerance for lower-purity hydrogen, supports long-haul and auxiliary-power integration scenarios. Material science progress has trimmed operating temperatures to 700 °C, allowing quicker heat-up and smaller thermal-management components. Reduced reliance on platinum-group metals promises lower stack costs at scale, setting the stage for expanded adoption once durability reaches 30,000 hours.
By Power Range:
100–200 kW Segment Optimizes Performance and CostSystems rated 100–200 kW accounted for 52.05% of the hydrogen fuel cell commercial vehicle market size in 2025, serving medium-duty trucks and city buses where weight and cost ceilings are tight. OEMs favor this range for route mixes under 300 km, where energy demands stay moderate and pack downsizing yields savings in storage tanks and power electronics.
Power ranges above 200 kW are forecast to rise 28.85% annually up to 2031 due to increasing class-8 truck demand. Ford’s Super Duty chassis test program targets a 300-mile range while accommodating a 10,000-lb payload. Smaller, higher-power stacks pair with 700 bar tanks, preserving freight payloads even as vehicle energy reserve doubles for cross-country trips.
By Driving Range:
400–600 km Range Captures Current Market Sweet SpotA 400–600 km driving window secured a 46.78% share of the hydrogen fuel cell commercial vehicle market in 2025, balancing payload with tank volume. Hyundai’s 724 km XCIENT spec sits inside this window and has proven reliable in mixed-grade Californian routes. Transit operators running intercity buses also report efficient duty cycles without excessive onboard storage.
Vehicles offering more than 600 km are on track for a 29.65% CAGR through 2031. Advances in 700 bar composites and cryogenic liquid hydrogen cut tank weight by 15%, enabling payload-neutral range extensions. Nikola’s TRE liquid-hydrogen variant holds 70 kg of fuel and delivers roughly 805 km, making two-shift duty feasible without interim refilling.
By End-User:
Public Transit Fleets Lead While Freight Logistics AcceleratesDue to direct federal and state funding, public transit fleets accounted for 47.62% of the hydrogen fuel cell commercial vehicle market in 2025. The Federal Transit Administration’s 2024 allocation of USD 1.5 billion covered the procurement of nearly 600 buses, of which a significant share were FCEBs. Blueprint plans from agencies like Santa Clara VTA designate fuel cells for longer inter-suburban routes, allowing battery buses to handle shorter loops.
Long-haul freight & logistics is set to grow 30.90% annually to 2031 as shippers look for range, quick refueling, and stable cold-weather performance. Hyundai’s HTWO Logistics pilot in Georgia schedules 21 trucks for internal plant movements, showcasing early vertical integration from hydrogen production to vehicle deployment. As green-hydrogen hubs come online, carriers are expected to widen usage from port shuttles to national trunk lines.
Geography Analysis
APAC Fuel Cell Commercial Vehicle Market
Asia-Pacific region led the hydrogen fuel cell commercial vehicle market with a 41.05% share in 2025, underpinned by China’s 125,000 tpa green-hydrogen capacity and large-scale component manufacturing. Cost advantages in electrolyser production and domestic procurement quotas have built a localised value chain spanning stacks, power electronics, and tanks. Japan and South Korea reinforce the region’s edge with long-running R&D programs and early OEM production lines.
Europe Fuel Cell Commercial Vehicle Market
Europe follows closely, driven by binding CO₂ cuts that require 45% lower heavy-duty emissions by 2030 and 90% by 2040. Refueling coverage reached 187 stations by May 2024, and fuel-cell bus registrations rose 82% during the same period. Cross-border projects, such as the H2Accelerate collaboration, aim to link Scandinavia to Northern Italy with 150 stations by 2030.
North America Fuel Cell Commercial Vehicle Market
North America benefits from a blend of federal incentives and state mandates. California’s ARCHES hub, backed by USD 1.2 billion, targets 45,000 tons/day of hydrogen by 2045. The U.S. Department of Energy wants 30% of new medium- and heavy-duty sales to be zero-emission by 2030, propelling truck OEM pilot fleets across the Pacific Northwest, the Gulf Coast, and the Great Lakes.
MEA Fuel Cell Commercial Vehicle Market
The Middle East and Africa region is expected to be the forecast to grow at 28.60% CAGR to 2031, is building on abundant solar and wind resources plus existing gas pipeline networks. Saudi Arabia and the UAE are constructing pilot truck corridors linking ports with inland distribution centers, aiming to decarbonize a freight sector that accounts for a quarter of regional emissions.

Regulatory Landscape
Regulation is tightening around both tailpipe CO2 and enabling infrastructure, pushing fuel cell commercial vehicles into formal compliance pathways. In Europe, Regulation (EU) 2023/1804 (AFIR) hardwires hydrogen refuelling deployment along the TEN-T core network for heavy-duty operation. It complements the EU Fit-for-55 heavy-duty CO2 reduction trajectory (45% by 2030, 65% by 2035, and 90% by 2040), which increasingly covers a broader set of trucks and buses.
In North America, the US EPA Phase 3 greenhouse-gas standards for heavy-duty vehicles begin phasing in from MY 2027. Program design changes such as ending certain credit multipliers for BEV and PHEV from MY 2027 also shift the incentive landscape that OEM compliance teams evaluate when choosing zero-emission powertrains. Safety and homologation standards are advancing as well: US FMVSS hydrogen fuel system integrity requirements are codified under 49 CFR 571.307 for vehicles manufactured on or after September 1, 2028. In India, the Ministry of Road Transport and Highways issued a July 2026 notification granting a 7-year permit exemption for hydrogen-powered trucks and buses, contingent on AIS-140-compliant vehicle-location tracking, which reduces operating friction for early fleet deployments.
Value Chain Analysis
The value chain spans hydrogen production (gray, blue, and green), purification and compression/liquefaction, distribution (pipeline, tube trailer, liquid delivery), and refuelling stations built around 350 bar and 700 bar pressures. It also covers the vehicle stack-and-balance-of-plant supply base, including MEA and membranes, bipolar plates, compressors, humidifiers, and thermal systems, plus storage tanks and power electronics integrated by OEMs. At the supply-chain level, the highest-leverage pinch points remain hydrogen refuelling capex and reliable hydrogen supply at fleet scale, which has supported corridor-based rollouts anchored at ports and logistics hubs where utilization can be sustained.
OEMs and tier suppliers are responding with deeper partnerships and standardization moves to reduce duplicated R&D and improve purchasing scale for stacks and BoP components. In March 2026, Toyota moved to join Daimler Truck and Volvo Group as an equal shareholder in cellcentric under a non-binding agreement, which signals a shift toward shared heavy-duty fuel cell system development. In parallel, Toyota and Isuzu announced in April 2026 a joint development track for a light-duty FCEV truck based on the ELF EV platform. Fleet-and-fuel ecosystem efforts also continue, including Toyota-Hyroad (May 2026), which links vehicle deployments to refuelling access, while OEM production timing remains constrained by regional station readiness, as reflected in earlier serial-production delays communicated by Kenworth (April 2025) and Daimler Truck (July 2025) tied to infrastructure availability and demand visibility.
Competitive Landscape
Market concentration is moderate as global OEMs race to lock down supply chains while specialist fuel-cell integrators contribute stack know-how. Hyundai, Toyota, and SAIC lead early deployments, supported by vertically integrated hydrogen strategies that include production and refueling assets. Hyundai’s XCIENT trucks in the NorCAL ZERO project alone have logged nearly 450,000 miles since 2023, demonstrating field reliability.
European incumbents are catching up. The cellcentric joint venture between Volvo and Daimler pools R&D budgets to deliver 300-series fuel-cell systems by mid-decade. Mercedes-Benz’s GenH2 prototype crossed the Swiss Alps with a 40-ton payload in 2024, signalling readiness for serial production. Partnerships with Ballard and Cummins supply proven stacks while allowing OEMs to focus on vehicle integration.
Competitive tactics now emphasize cost-down roadmaps and infrastructure alliances. Early movers sign multi-year purchase agreements with energy majors, ensuring hydrogen offtake while guaranteeing station volumes. Regulators accelerate the transition by tightening CO₂ ceilings, pressuring laggards to acquire technology licenses or risk compliance penalties. Vertical integration, from electrolyser plants to truck servicing, emerges as a differentiator that can shave cents per kilogram off delivered hydrogen costs and secure lifetime maintenance revenue.
Fuel Cell Commercial Vehicle Industry Leaders
Hyundai Motor Company
Toyota Motor Corporation
Ballard Power Systems
Volvo Group
Nikola Corporation
- *Disclaimer: Major Players sorted in no particular order
Fuel Cell Commercial Vehicle Market Companies Covered in this Report
- Hyundai Motor Company
- Toyota Motor Corporation
- Ballard Power Systems
- Volvo Group (cellcentric JV)
- Nikola Corporation
- PACCAR Inc.
- Mercedes-Benz Group AG
- Honda Motor Co.
- SAIC Motor Corporation
- Foton Motor Group
- Tata Motors Limited
- Solaris Bus & Coach sp. z o.o.
- Plug Power Inc.
- Hyzon Motors Inc.
- Cummins Inc.
- Wrightbus Ltd.
- Zhejiang Geely Holding Group
- Dongfeng Motor Corporation
- Xiamen King Long Motor Group
- Gaussin S.A.

Market Opportunities and Future Outlook
Near-term opportunity clusters are forming where public funding and corridor planning lower early infrastructure risk, and where duty cycles favor fast refuelling and long-range operation over depot charging. California remains a leading anchor market: the California Energy Commission issued the April 2026 GFO-25-607 solicitation under the Clean Transportation Program to fund hydrogen refuelling infrastructure across light-, medium-, and heavy-duty FCEVs. CARB incentive frameworks such as HVIP also continue to include fuel cell-specific support for fleets. Corporate deployments are increasingly tied to integrated hubs, including Toyota Motor North America aligning Class 8 truck deployments with station development, such as plans for a permanent hydrogen fueling station at its North American Parts Center California and a May 2026 collaboration with Hyroad to deploy fuel cell Class 8 trucks in Southern California.
Outside North America, multi-country regulation and procurement programs keep the pipeline active, particularly for buses and corridor trucks. Europe is converting AFIR requirements into concrete station rollouts along TEN-T routes, alongside cross-border initiatives such as H2Accelerate aimed at multi-country heavy-duty coverage. This creates openings for station developers, hydrogen suppliers, and OEMs offering 100-200 kW to >200 kW platforms matched to 400-600 km and >600 km operations. In Asia-Pacific, policy-backed vehicle targets and funding programs support fleet orders and component localization, while manufacturer alliances, including cellcentric standardization efforts, and depot-plus-corridor station builds improve bankability by pairing vehicle volumes with fuel offtake and service contracts.
Recent Industry Developments in Fuel Cell Commercial Vehicle Market
- June 2026: Ballard Power Systems announced an order for 15 MW (150 FCmove-HD+ modules) for off-grid stationary power generation, with deliveries starting in the second half of 2026. The win broadens utilization for heavy-duty-grade fuel cell modules beyond vehicles, helping suppliers smooth production loading and strengthen negotiating leverage on stack components shared with bus and truck platforms.
- May 2026: Toyota announced a strategic collaboration with Hyroad Energy to deploy hydrogen fuel cell Class 8 trucks in Southern California. Linking truck deployment to a defined fleet operator and refuelling ecosystem supports higher station utilization and creates a replicable blueprint for regional hub-to-hub freight operations.
- October 2024: Nikola reported wholesaling 88 hydrogen-powered Class 8 trucks in Q3 2024. The shipment volume highlighted early fleet demand for fuel cell tractors in North America and provided real-world operating data that OEMs and infrastructure partners use to refine service, refuelling, and uptime assumptions.


Fuel Cell Commercial Vehicle Market Report Scope and Research Methodology
Market Definition and Coverage
For this study, the market covers the revenue generated from commercial vehicles that are propelled by a hydrogen fuel cell system, where the fuel cell stack provides traction power either directly or through an electric drivetrain.
Scope exclusions: We exclude non-commercial passenger fuel cell cars, pure battery-electric commercial vehicles without a fuel cell, and hydrogen internal combustion engine commercial vehicles.
Segments Covered in This Report
- By Vehicle Type
- Buses
- Trucks
- Vans
- Other Vehicle Types (Pickup Trucks, etc.)
- By Fuel Cell Type
- Proton Exchange Membrane Fuel Cell (PEMFC)
- Phosphoric Acid Fuel Cell (PAFC)
- Solid Oxide Fuel Cell (SOFC)
- Others
- By Power Range
- Below 100 kW
- 100 kW - 200 kW
- Above 200 kW
- By Driving Range
- Below 400 km
- 400 km - 600 km
- Above 600 km
- By End-User
- Public Transit Fleets
- Long-Haul Freight & Logistics
- Last-Mile Delivery
- Municipal & Utility Services
- Other Applications
- By Geography
- North America
- United States
- Canada
- Rest of North America
- Europe
- Germany
- United Kingdom
- France
- Italy
- Rest of Europe
- Asia-Pacific
- China
- India
- Japan
- South Korea
- Rest of Asia-Pacific
- South America
- Brazil
- Argentina
- Rest of South America
- Middle East and Africa
- United Arab Emirates
- South Africa
- Saudi Arabia
- Rest of Middle East and Africa
- North America
Data Sources, Market Sizing, and Validation
Desk Research
Desk work started by mapping how many fuel cell commercial vehicles are actually getting deployed, and where deployments are concentrated, since this market is still early and can swing on a few large orders. We referenced public sources such as vehicle registration and transport statistics, customs and trade data for hydrogen and fuel cell system components, and policy releases that specify targets and incentive windows.
To keep the inputs grounded, we also reviewed materials such as regulatory and incentive documents, national energy and transport agencies, multilateral sources that track hydrogen infrastructure and investment, and peer-reviewed papers on fuel cell stack cost and efficiency trends. Company filings, investor presentations, and press releases were then used to time-check production plans and deliveries. A paid subscription for company financials and intelligence, plus selective patent databases, supported quicker cross-checks on capacities and product readiness. These are illustrative sources only, and many other public references were used to collect data, validate assumptions, and clarify open questions.
Primary Interviews and Surveys
Primary calls and surveys were used to validate the adoption curve and pricing logic that are not always visible in public data, especially for fleet orders and pilot programs. We spoke with a mix of vehicle OEM ecosystem participants, fleet and transit operators, hydrogen infrastructure stakeholders, and component suppliers across the main demand regions, and then we re-contacted selected respondents when major policy or tender announcements shifted the outlook.
Distribution of primary research fieldwork respondents
| Company type | Respondent position | Region |
|---|---|---|
| Top tier: 37% | CXOs: 16% | APAC: 50% |
| Mid tier: 45% | Functional/Unit leaders: 27% | EMEA: 29% |
| Smaller Players: 18% | Managers: 57% | Americas: 21% |
Market-Sizing & Forecasting
Sizing was built using a top-down demand pool approach where deployments were reconstructed from commercial vehicle rollouts, announced fleet procurements, and hydrogen corridor build-outs, which are then translated into revenue using price bands by vehicle class. To ensure the totals did not drift, we corroborated them with selective bottom-up approximations, such as sampled ASP times unit volumes for key use cases and limited supplier roll-ups where public shipment or capacity signals were available.
Key model inputs included (illustrative): annual fuel cell bus and truck deliveries, order backlog timing for public transit and logistics fleets, fuel cell stack system cost per kW progression, average rated power bands used in heavy-duty applications, hydrogen refueling station additions along freight routes, and incentive eligibility windows that influence fleet purchase timing. Where direct unit data was missing for smaller countries, gaps were handled through proxy indicators such as comparable policy strength, infrastructure density, and fleet size patterns, followed by adjustments from expert feedback.
For forecasting, scenario analysis was used around two main levers, rollout pace of hydrogen refueling networks and the speed of cost-down in fuel cell systems, and then a central case was selected based on the most consistent expert consensus. Output values were kept in USD with consistent currency timing assumptions so the year-over-year pattern stays traceable to the same set of drivers.
Data Validation & Update Cycle
Validation was done by checking the model outputs against independent signals such as known fleet tenders, public delivery announcements, and infrastructure commissioning timelines, and then comparing implied ASPs and unit counts against what respondents consider workable. Any outliers, such as a sudden step-change in revenue without a matching deployment or policy trigger, were flagged and reviewed before final sign-off.
Before publication, the estimates go through multiple analyst reviews so that assumptions, conversions, and arithmetic checks are consistently applied across regions and years. The report is refreshed annually, and interim updates are triggered when material events occur, such as major subsidy resets, large fleet awards, or significant production scale-up announcements. Right before delivery, we do a final pass to ensure the latest public information is reflected.
Mordor Intelligence's Fuel Cell Commercial Vehicle Market Estimate Compared With Other Published Estimates
Published market numbers for fuel cell commercial vehicles can look far apart, even when they all appear reasonable at first glance, because the market is still forming and scope choices matter a lot. Differences usually come from what counts as a commercial vehicle in practice, which years are treated as the base, and how prices are carried forward when early projects have uneven pricing.
The main gap comes from whether revenue is counted only when commercial fuel cell vehicles are delivered and in operation-ready configurations, where Mordor Intelligence ties the value to deployment-linked unit assumptions and vehicle-class ASP bands rather than broader opportunity-style totals that can include earlier pipeline activity.
Benchmark comparison
| Source | Market Size | Gaps in Research Methodology |
|---|---|---|
| Mordor Intelligence | USD 1.41 B (2025) | |
| Industry Publisher A | USD 2.23 B (2024) | Uses a different base year and is presented as sales value and demand, which can pull in a wider set of vehicle categories and counting conventions that are not strictly aligned to delivered, revenue-recognized deployments. |
| Industry Publisher B | USD 4.30 B (2025) | Appears to apply a broader commercial vehicle scope and longer-range pricing assumptions across vehicle classes, which can inflate the starting year if pilot pricing and early procurement values are generalized too quickly. |
The spread across the three figures is mostly explained by base-year choice and how strictly deliveries and vehicle scope are defined before revenue is counted. By keeping the inputs tied to observable deployments, realistic power and range mixes, and consistent ASP logic, the final number stays transparent and can be repeated as new tenders, infrastructure additions, and deliveries show up in the data.


Key Questions Answered in the Report
What is the expected size of the hydrogen fuel cell commercial vehicle market by 2031?
The hydrogen fuel cell commercial vehicle market is forecast to reach USD 6.23 billion by 2031, reflecting a 28.10% CAGR during 2026-2031.
Where is the fastest regional growth anticipated?
The Middle East and Africa is projected to grow at a 28.60% CAGR as new hydrogen corridors leverage low-cost renewable resources and existing gas infrastructure.
Which is the largest market in Fuel Cell Commercial Vehicle Market?
Asia-Pacific commanded a 41.05% share of the Fuel Cell Commercial Market in 2025
How do hydrogen trucks compare with battery-electric trucks on short routes?
For distances below 200 km, battery-electric trucks often show lower total cost, making hydrogen less competitive in local delivery segments.
Page last updated on:





