Brazil Alternative Fuel Vehicles Market Size and Share
Market Overview
| Study Period | 2017 - 2029 |
|---|---|
| Forecast Data Period | 2025 - 2029 |
| Historical Data Period | 2017 - 2023 |
| Market Size (2025) | USD 21.25 Billion |
| Market Size (2029) | USD 38.12 Billion |
| Growth Rate (2025 - 2029) | 15.73% CAGR |
| Market Concentration | High |
Major Players*Disclaimer: Major Players sorted in no particular order Image © Mordor Intelligence. Reuse requires attribution under CC BY 4.0. | |

Brazil Alternative Fuel Vehicles Market Analysis by Mordor Intelligence
The Brazil Alternative Fuel Vehicles Market size is estimated at 21.25 billion USD in 2025, and is expected to reach 38.12 billion USD by 2029, growing at a CAGR of 15.73% during the forecast period (2025-2029).
Brazil's alternative fuel vehicles industry is undergoing a transformative phase, characterized by significant investments in domestic manufacturing capabilities and infrastructure development. A landmark development in July 2023 saw BYD announcing a BRL 3 billion investment to establish its first electric car plant outside Asia in Brazil, demonstrating the country's growing attractiveness as a manufacturing hub for electric vehicles. This investment encompasses three production facilities focusing on electric and hybrid vehicles, chassis for electric buses and trucks, and lithium processing, positioning Brazil as a crucial player in the global electric vehicle supply chain. The strategic location and abundant natural resources have made Brazil an increasingly attractive destination for international automakers looking to establish regional manufacturing bases.
The technological landscape of Brazil's alternative fuel vehicle sector is rapidly evolving, with manufacturers introducing advanced alternative powertrain solutions and enhanced battery technologies. Automakers are increasingly focusing on developing vehicles specifically tailored to Brazilian market conditions and consumer preferences, incorporating features that address local climate conditions, road infrastructure, and driving patterns. The industry has witnessed a significant shift toward localization of production and technology adaptation, with several manufacturers establishing research and development centers to customize their offerings for the Brazilian market. This localization trend has led to the development of more affordable and market-appropriate alternative fuel vehicles.
Infrastructure development has emerged as a critical focus area, with significant progress in expanding the charging network across major urban centers. The country has made substantial strides in charging infrastructure deployment, reaching approximately 1,204.9 charging stations in 2022, marking a crucial milestone in supporting the growing fleet of electric vehicles. Private sector partnerships and government initiatives have played a crucial role in expanding this infrastructure, particularly in metropolitan areas and along major highways. The strategic placement of charging stations has helped address range anxiety concerns and enhance consumer confidence in electric vehicle adoption.
The manufacturing ecosystem is experiencing a notable transformation with the emergence of a robust supply chain network. Local component manufacturing capabilities are expanding, particularly in battery production and electric powertrain systems. The industry has witnessed increased collaboration between international technology providers and local manufacturers, fostering knowledge transfer and technological expertise. This evolution of the manufacturing landscape has contributed to reduced production costs and improved accessibility of alternative fuel vehicles in the Brazilian market. The development of local supply chains has also created new opportunities for small and medium-sized enterprises to participate in the clean mobility industry, fostering innovation and competition.
Brazil Alternative Fuel Vehicles Market Trends and Insights
Growing demand and government incentives drive electric vehicle market in Brazil
- Brazil has great potential for the automobile market, and the South American vehicle industry has experienced substantial growth over the past few years. In recent years, the demand for electric vehicles, primarily passenger cars, has increased in the region owing to rising awareness of electric vehicles, growing environmental concerns, and governmental push towards adopting electric vehicles. These factors are gradually shifting consumers to electric vehicles, and the sales of EVs grew from 2022 to 2021.
- Brazil holds potential demand for electric buses as the country is focusing on adopting more renewable power generation, which may utilize the country’s large niobium and lithium reserves, a crucial factor for EV batteries’ development. Moreover, in December 2022, Sao Paulo banned purchasing diesel buses and announced the deployment of 2600 electric buses by the end of 2024. Similar factors in other countries are expected to boost the electrification of vehicles during the forecast period.
- Brazil's approach to growing its EV market indicates a larger regional movement in South America toward electrification of transportation. As countries across the continent implement comparable incentives, a collaborative push toward reducing carbon emissions is evident. These concerted efforts will likely foster a significant increase in EV sales, contributing to a greener and more sustainable future for transportation in South America. This regional dynamism, spearheaded by Brazil's initiatives, showcases the potential for integrated strategies that combine resource utilization, policy incentives, and technological innovation to address global environmental challenges.


OTHER KEY INDUSTRY TRENDS COVERED IN THE REPORT
- Brazil's population grows steadily, driven by a young demographic and cultural diversity, requiring strategic planning
- In Brazil, the consumer spending for vehicle purchase (CVP) was projected to increase from USD 130.3 million in 2022 to USD 141 million in 2023, indicating a revival of the automotive market
- Brazil's auto interest rate surged to 39.4% in 2022, reflecting Brazil's response to economic conditions and potential strategies to address inflation, fiscal challenges, and lending sector stabilization
- Rapid growth in Brazil’s EV charging stations marks a promising shift in green mobility landscape
- Brazil's electrification journey from 2024 to 2030 is set to witness a robust uptake in passenger cars and LCVs initially, followed by a steady decline. However, the forecast for medium & heavy-duty trucks indicates no growth, while the trajectory for buses is expected to be more diverse, peaking in 2024
- Due to an abrupt increase in global oil prices, the average gasoline prices increased by 16.3% in Brazil
- Brazil's economic rebound, fueled by diverse exports and domestic consumption, highlights its ambition in sectors like technology and green energy
- Brazil aims to stabilize inflation as it navigates economic challenges for long-term growth and stability
- The shared rides segment in Brazil, a key player in South America, had demonstrated resilience despite hurdles and was poised for a robust rebound in 2022-2023. With urbanization, technological progress, and a focus on sustainability as key drivers, the market is projected to witness steady growth from 2024 to 2030
- The rise of Brazil's electric vehicle market: Battery costs drop, and alliances take center stage
- Brazil's used car sales market is poised for steady growth despite economic challenges
- South America's hybrid and electric vehicle production shows Brazil leading with Chevrolet, Honda, and VW as major contributors and a notable rise in Toyota's production
Segment Analysis: Vehicle Type
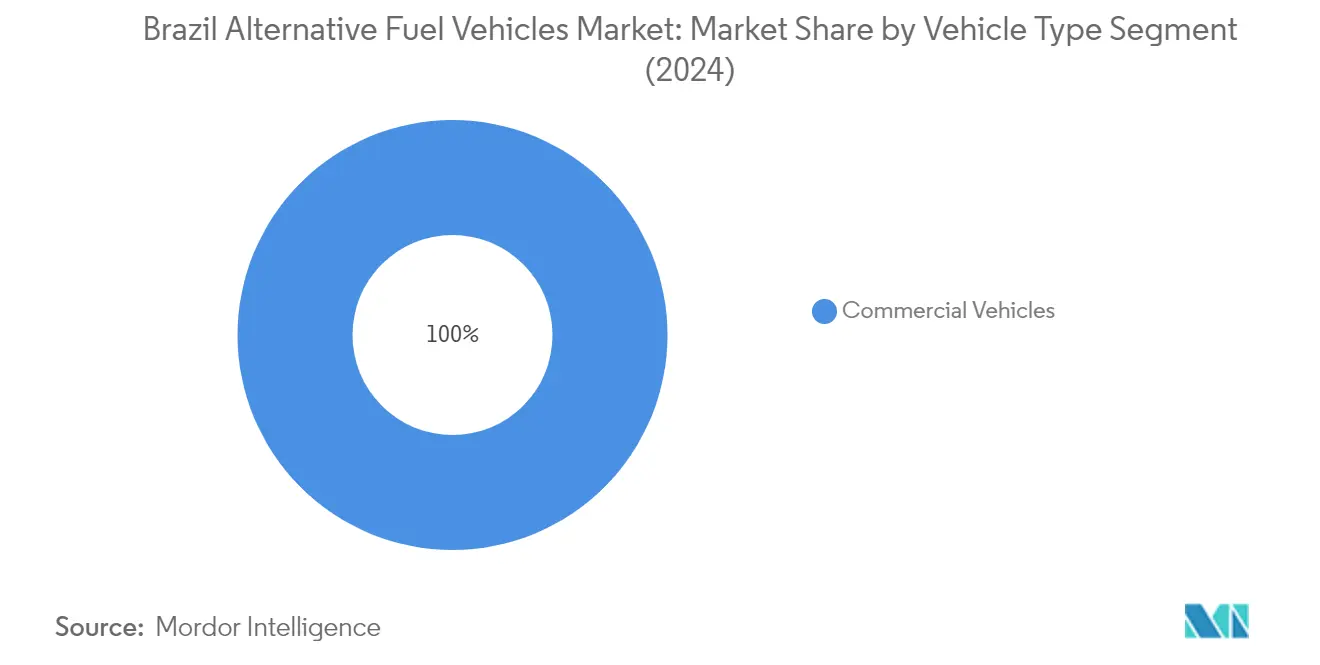
Commercial Vehicles Segment in Brazil Alternative Fuel Vehicles Market
Commercial vehicles continue to dominate the Brazil alternative fuel vehicles market, commanding approximately 100% market share in 2024. This overwhelming dominance can be attributed to several factors, including robust demand from the logistics and transportation sectors, government initiatives promoting clean energy vehicles, and increasing adoption of electric vehicles such as electric buses in urban areas. The segment's strong performance is further bolstered by significant investments in charging infrastructure specifically designed for commercial vehicles, growing environmental consciousness among fleet operators, and the cost advantages offered by alternative fuel commercial vehicles over traditional diesel variants in terms of long-term operations and maintenance.

Medium-duty Commercial Trucks Segment in Brazil Alternative Fuel Vehicles Market
The medium-duty commercial trucks segment is experiencing remarkable growth momentum in the Brazil alternative fuel vehicles market, projected to grow at approximately 67% during 2024-2029. This exceptional growth trajectory is driven by increasing urbanization, rising demand for last-mile delivery services, and growing adoption of electric vehicles for inner-city logistics. The segment's expansion is further supported by advancements in battery technology, improving vehicle range and performance, alongside supportive government policies promoting clean transportation solutions. Fleet operators are increasingly recognizing the operational benefits of alternative fuel medium-duty trucks, particularly in terms of reduced maintenance costs and environmental compliance.
Remaining Segments in Vehicle Type
The passenger vehicles segment in the Brazil alternative fuel vehicles market represents an emerging opportunity, with manufacturers increasingly introducing new hybrid vehicles and electric models tailored to consumer preferences. While currently having a smaller market presence compared to commercial vehicles, this segment shows promise for future growth as charging infrastructure expands and consumer awareness increases. The two-wheeler segment, though nascent, is gradually gaining attention with the introduction of electric motorcycles and scooters, particularly in urban areas where maneuverability and cost-effectiveness are key considerations.
Segment Analysis: Fuel Category
BEV Segment in Brazil Alternative Fuel Vehicles Market
Battery electric vehicles (BEV) dominate the Brazilian alternative fuel vehicles market, commanding approximately 48% market share in 2024. This leadership position is driven by significant technological advancements in battery technology, extensive government support through tax incentives and subsidies, and growing consumer awareness about environmental sustainability. The segment's strong performance is further bolstered by expanding charging infrastructure across urban centers, decreasing battery costs, and the introduction of new BEV models from major automotive manufacturers. Additionally, Brazil's commitment to renewable energy sources complements the environmental benefits of BEVs, making them an increasingly attractive option for environmentally conscious consumers and businesses alike.
FCEV Segment in Brazil Alternative Fuel Vehicles Market
The fuel cell vehicles (FCEV) segment is emerging as the fastest-growing category in Brazil's alternative fuel vehicles market, with projections indicating approximately 28% growth from 2024 to 2029. This remarkable growth trajectory is supported by increasing investments in hydrogen infrastructure and the government's strategic focus on developing green hydrogen as a sustainable fuel source. The segment's expansion is further accelerated by technological advancements in fuel cell technology, improving efficiency and reducing costs. Brazil's abundant renewable energy resources provide a unique opportunity to produce green hydrogen, positioning FCEVs as a viable solution for both commercial and passenger vehicle applications.
Remaining Segments in Fuel Category
The remaining segments in Brazil's alternative fuel vehicles market include hybrid vehicles (HEV) and Plug-in Hybrid Electric Vehicles (PHEV), both playing crucial roles in the transition towards sustainable mobility. HEVs serve as a practical bridge technology, offering improved fuel efficiency without the range anxiety associated with pure electric vehicles. Meanwhile, PHEVs provide the flexibility of both electric and conventional powertrains, making them particularly attractive for consumers seeking to balance environmental consciousness with practical driving needs. These segments continue to evolve with advancing technology and expanding model offerings from various manufacturers.
Competitive Landscape
Top Companies in Brazil Alternative Fuel Vehicles Market
The Brazilian alternative fuel vehicles market is characterized by intense innovation and strategic expansion activities among key players. Companies are focusing on developing advanced electric vehicles and hybrid vehicles powertrains while simultaneously expanding their local manufacturing capabilities to reduce costs and improve market accessibility. Product portfolios are being diversified with new electric and hybrid models across various vehicle segments, from compact cars to SUVs and commercial vehicles. Operational agility is demonstrated through flexible production systems and rapid response to market demands, with manufacturers increasingly localizing their supply chains. Strategic partnerships with local entities, particularly in charging infrastructure development and battery technology, are becoming increasingly common. Companies are also investing heavily in research and development facilities within Brazil, emphasizing the importance of developing market-specific solutions while expanding their dealer networks to enhance market presence and customer service capabilities.
Market Dominated by Global Automotive Giants
The Brazilian alternative fuel vehicles market exhibits a relatively concentrated structure dominated by established global automotive manufacturers who have successfully leveraged their technological expertise and brand recognition. These multinational players, particularly from Europe and Asia, have established strong local manufacturing bases while maintaining their global supply chain advantages. The market shows a clear distinction between premium and mass-market segments, with different players focusing on their respective niches while gradually expanding their electric vehicle offerings. Local partnerships and joint ventures are becoming increasingly important for market entry and expansion, particularly in developing charging infrastructure and localizing production.
The market is witnessing increased consolidation through strategic partnerships and collaborations, particularly in technology sharing and infrastructure development. While mergers and acquisitions are not as prevalent, companies are forming strategic alliances to share development costs and reduce market entry barriers. The presence of state-owned enterprises from China is growing, bringing new dynamics to market competition through aggressive pricing strategies and advanced technology offerings. Traditional automotive conglomerates are responding by leveraging their established dealer networks and brand loyalty while investing in local production capabilities.
Innovation and Localization Drive Future Success
For incumbent players to maintain and expand their market share, a multi-faceted approach combining technological innovation with local market adaptation is crucial. Companies need to focus on developing products specifically tailored to Brazilian conditions and consumer preferences while maintaining competitive pricing through local manufacturing and sourcing. Building strong relationships with government entities and local partners for infrastructure development is becoming increasingly important. The ability to offer comprehensive after-sales service networks and maintain strong brand presence through digital channels will be critical for success. Companies must also demonstrate commitment to sustainability and align with Brazil's environmental policies while developing flexible production systems that can adapt to changing market demands.
Emerging players looking to gain ground must focus on identifying and exploiting specific market niches while building strong local partnerships. Success will depend on their ability to offer innovative financing solutions and develop cost-effective products that meet local requirements. The regulatory environment is expected to become more supportive of sustainable vehicles and clean mobility, creating opportunities for new entrants with advanced technology solutions. Companies must also consider the growing importance of fleet sales and shared mobility services while developing strategies to address potential supply chain challenges. Building strong relationships with local stakeholders and investing in local talent development will be crucial for long-term success in the market.
Brazil Alternative Fuel Vehicles Industry Leaders
Anhui Jianghuai Automobile (JAC)
Bayerische Motoren Werke AG
BYD Auto Co. Ltd.
Nissan Motor Co. Ltd.
Renault do Brasil S/A
- *Disclaimer: Major Players sorted in no particular order


Recent Industry Developments
- August 2023: BYD introduced the new all-electric BYD SEAL D-segment sedan to European consumers. Deliveries of the BYD SEAL commenced in Q4 2023, and the prices were announced.
- August 2023: Toyota Argentina announced that as it begins production of the Hiace in 2024 at its plant in Zárate, it will continue to expand the mission of the Conversions area, dedicated to designing and producing vehicles adapted to the specific needs of multiple customers.
- August 2023: BYD presented six electric vehicles alongside a display of new technologies at the IAA Mobility 2023. Its luxury sub-brand, DENZA, was presented to the European audiences for the first time.


Brazil Alternative Fuel Vehicles Market Report Scope
Commercial Vehicles, Passenger Vehicles, Two-Wheelers are covered as segments by Vehicle Type. BEV, FCEV, HEV, PHEV are covered as segments by Fuel Category.| Commercial Vehicles | Buses |
| Heavy-duty Commercial Trucks | |
| Light Commercial Pick-up Trucks | |
| Light Commercial Vans | |
| Medium-duty Commercial Trucks | |
| Passenger Vehicles | |
| Two-Wheelers |
| BEV |
| FCEV |
| HEV |
| PHEV |
| Vehicle Type | Commercial Vehicles | Buses |
| Heavy-duty Commercial Trucks | ||
| Light Commercial Pick-up Trucks | ||
| Light Commercial Vans | ||
| Medium-duty Commercial Trucks | ||
| Passenger Vehicles | ||
| Two-Wheelers | ||
| Fuel Category | BEV | |
| FCEV | ||
| HEV | ||
| PHEV |


Market Definition
- Vehicle Type - The category includes passenger cars, commercial vehicles, and two-wheelers.
- Vehicle Body Type - TUnder Passenger Cars, the category includes Hatchbacks, Sedans, Sports Utility Vehicles, and Multi-purpose Vehicles; for Commercial Vehicles, it covers Light Commercial Pick-up Trucks, Light Commercial Vans, Medium-duty Commercial Trucks, Heavy-duty Commercial Trucks, and Medium and Heavy Duty Buses; and for Two-Wheelers, it encompasses Scooters and Motorcycles.
- Fuel Category - The category exclusively covers electric propulsion systems, including various types such as HEV (Hybrid Electric Vehicles), PHEV (Plug-in Hybrid Electric Vehicles), BEV (Battery Electric Vehicles), and FCEV (Fuel Cell Electric Vehicles).
| Keyword | Definition |
|---|---|
| Electric Vehicle (EV) | A vehicle which uses one or more electric motors for propulsion. Includes cars, buses, and trucks. This term includes all-electric vehicles or battery electric vehicles and plug-in hybrid electric vehicles. |
| BEV | A BEV relies completely on a battery and a motor for propulsion. The battery in the vehicle must be charged by plugging it into an outlet or public charging station. BEVs do not have an ICE and hence are pollution-free. They have a low cost of operation and reduced engine noise as compared to conventional fuel engines. However, they have a shorter range and higher prices than their equivalent gasoline models. |
| PEV | A plug-in electric vehicle is an electric vehicle that can be externally charged and generally includes all-electric vehicles as well as plug-in hybrids. |
| Plug-in Hybrid EV | A vehicle that can be powered either by an ICE or an electric motor. In contrast to normal hybrid EVs, they can be charged externally. |
| Internal combustion engine | An engine in which the burning of fuels occurs in a confined space called a combustion chamber. Usually run with gasoline/petrol or diesel. |
| Hybrid EV | A vehicle powered by an ICE in combination with one or more electric motors that use energy stored in batteries. These are continually recharged with power from the ICE and regenerative braking. |
| Commercial Vehicles | Commercial vehicles are motorized road vehicles designed for transporting people or goods. The category includes light commercial vehicles (LCVs) and medium and heavy-duty vehicles (M&HCV). |
| Passenger Vehicles | Passenger cars are electric motor– or engine-driven vehicles with at least four wheels. These vehicles are used for the transport of passengers and comprise no more than eight seats in addition to the driver’s seat. |
| Light Commercial Vehicles | Commercial vehicles that weigh less than 6,000 lb (Class 1) and in the range of 6,001–10,000 lb (Class 2) are covered under this category. |
| M&HDT | Commercial vehicles that weigh in the range of 10,001–14,000 lb (Class 3), 14,001–16,000 lb (Class 4), 16,001–19,500 lb (Class 5), 19,501–26,000 lb (Class 6), 26,001–33,000 lb (Class 7) and above 33,001 lb (Class 8) are covered under this category. |
| Bus | A mode of transportation that typically refers to a large vehicle designed to carry passengers over long distances. This includes transit bus, school bus, shuttle bus, and trolleybuses. |
| Diesel | It includes vehicles that use diesel as their primary fuel. A diesel engine vehicle have a compression-ignited injection system rather than the spark-ignited system used by most gasoline vehicles. In such vehicles, fuel is injected into the combustion chamber and ignited by the high temperature achieved when gas is greatly compressed. |
| Gasoline | It includes vehicles that use gas/petrol as their primary fuel. A gasoline car typically uses a spark-ignited internal combustion engine. In such vehicles, fuel is injected into either the intake manifold or the combustion chamber, where it is combined with air, and the air/fuel mixture is ignited by the spark from a spark plug. |
| LPG | It includes vehicles that use LPG as their primary fuel. Both dedicated and bi-fuel LPG vehicles are considered under the scope of the study. |
| CNG | It includes vehicles that use CNG as their primary fuel. These are vehicles that operate like gasoline-powered vehicles with spark-ignited internal combustion engines. |
| HEV | All the electric vehicles that use batteries and an internal combustion engine (ICE) as their primary source for propulsion are considered under this category. HEVs generally use a diesel-electric powertrain and are also known as hybrid diesel-electric vehicles. An HEV converts the vehicle momentum (kinetic energy) into electricity that recharges the battery when the vehicle slows down or stops. The battery of HEV cannot be charged using plug-in devices. |
| PHEV | PHEVs are powered by a battery as well as an ICE. The battery can be charged through either regenerative breaking using the ICE or by plugging into some external charging source. PHEVs have a better range than BEVs but are comparatively less eco-friendly. |
| Hatchback | These are compact-sized cars with a hatch-type door provided at the rear end. |
| Sedan | These are usually two- or four-door passenger cars, with a separate area provided at the rear end for luggage. |
| SUV | Popularly known as SUVs, these cars come with four-wheel drive, and usually have high ground clearance. These cars can also be used as off-road vehicles. |
| MPV | These are multi-purpose vehicles (also called minivans) designed to carry a larger number of passengers. They carry between five and seven people and have room for luggage too. They are usually taller than the average family saloon car, to provide greater headroom and ease of access, and they are usually front-wheel drive. |


Research Methodology
Mordor Intelligence follows a four-step methodology in all its reports.
- Step-1: Identify Key Variables: To build a robust forecasting methodology, the variables and factors identified in Step-1 are tested against available historical market numbers. Through an iterative process, the variables required for market forecast are set and the model is built based on these variables.
- Step-2: Build a Market Model: Market-size estimations for the historical and forecast years have been provided in revenue and volume terms. Market revenue is calculated by multiplying the sales volume with their respective average selling price (ASP). While estimating ASP factors like average inflation, market demand shift, manufacturing cost, technological advancement, and varying consumer preference, among others have been taken into account.
- Step-3: Validate and Finalize: In this important step, all market numbers, variables, and analyst calls are validated through an extensive network of primary research experts from the market studied. The respondents are selected across levels and functions to generate a holistic picture of the market studied.
- Step-4: Research Outputs: Syndicated Reports, Custom Consulting Assignments, Databases & Subscription Platforms.


