
Friction Material Market Size and Share
Market Overview
| Study Period | 2021 - 2031 |
|---|---|
| Market Volume (2026) | 0.86 Billion units |
| Market Volume (2031) | 1.07 Billion units |
| Growth Rate (2026 - 2031) | 4.36 % |
| Fastest Growing Market | Middle East and Africa |
| Largest Market | Asia Pacific |
| Market Concentration | Medium |
Major Players *Disclaimer: Major Players sorted in no particular order Image © Mordor Intelligence. Reuse requires attribution under CC BY 4.0. | |
Friction Material Market Analysis by Mordor Intelligence
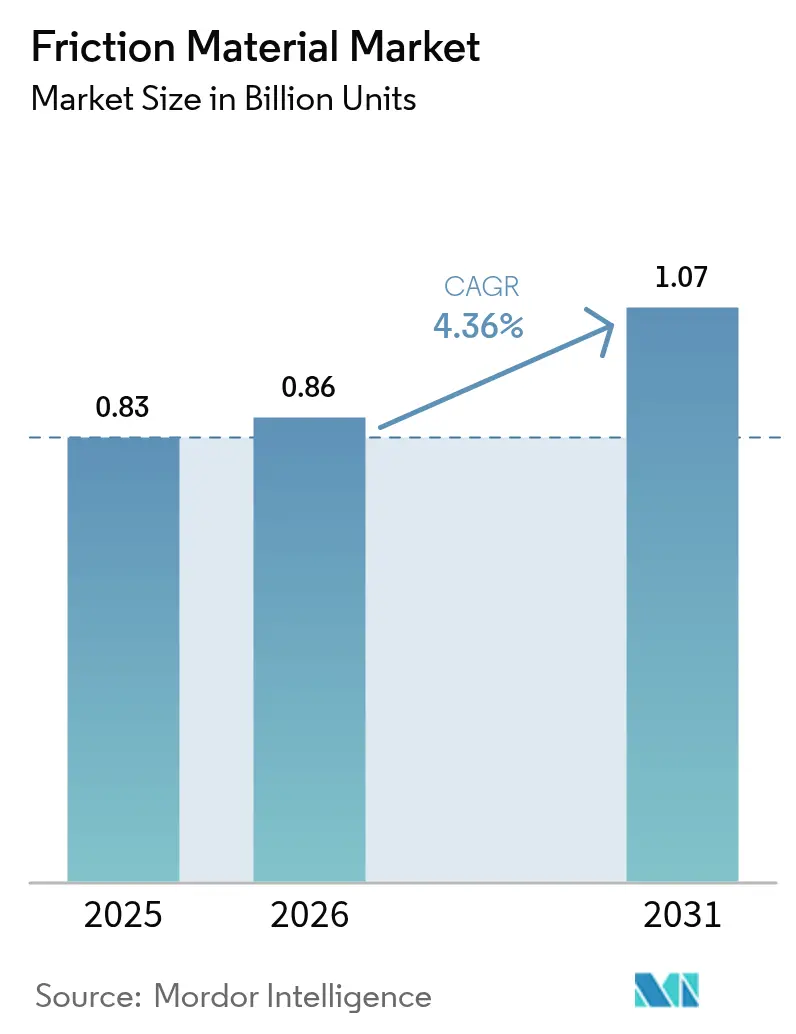
The Friction Material Market size is projected to expand from 0.83 Billion units in 2025 and 0.86 Billion units in 2026 to 1.07 Billion units by 2031, registering a CAGR of 4.36% between 2026 to 2031. Regulatory caps on copper, brake-dust, and noise emissions are rewriting product specifications, which steers demand toward ceramic and aramid-rich compounds even as cost-sensitive fleets in Asia-Pacific still favor legacy semi-metallic pads. High-temperature discs for wind-turbine yaw systems and mining haul trucks are creating a profitable micro-niche that outpaces the broader friction material market. Electrification introduces regenerative braking that lengthens service intervals, trimming unit volume growth but lifting value per set because OEMs specify premium, thermally stable materials. Meanwhile, autonomous warehouse robots, although small in absolute numbers, consume friction modules that sell at three to four times automotive pad prices thanks to tight durability and response-time tolerances.
Key Report Takeaways
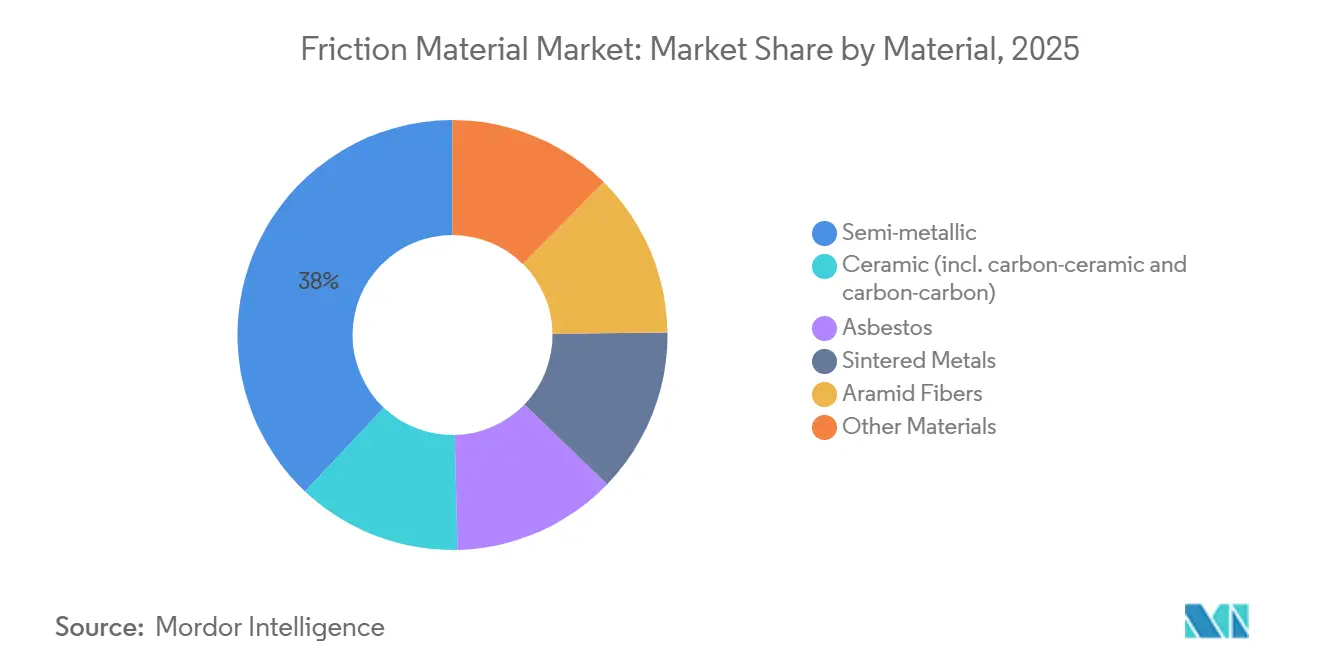
- By material, semi-metallic compounds held 37.97% of the friction material market share in 2025, while ceramic is projected to expand at a 6.02% CAGR through 2031.
- By product type, pads dominated with 40.88% of the friction material market share in 2025, whereas discs are set to grow at a 5.63% CAGR through 2031.
- By application, clutch and brake systems accounted for 72.13% of the friction material market share in 2025, yet gear tooth systems are forecast to advance at a 5.12% CAGR through 2031.
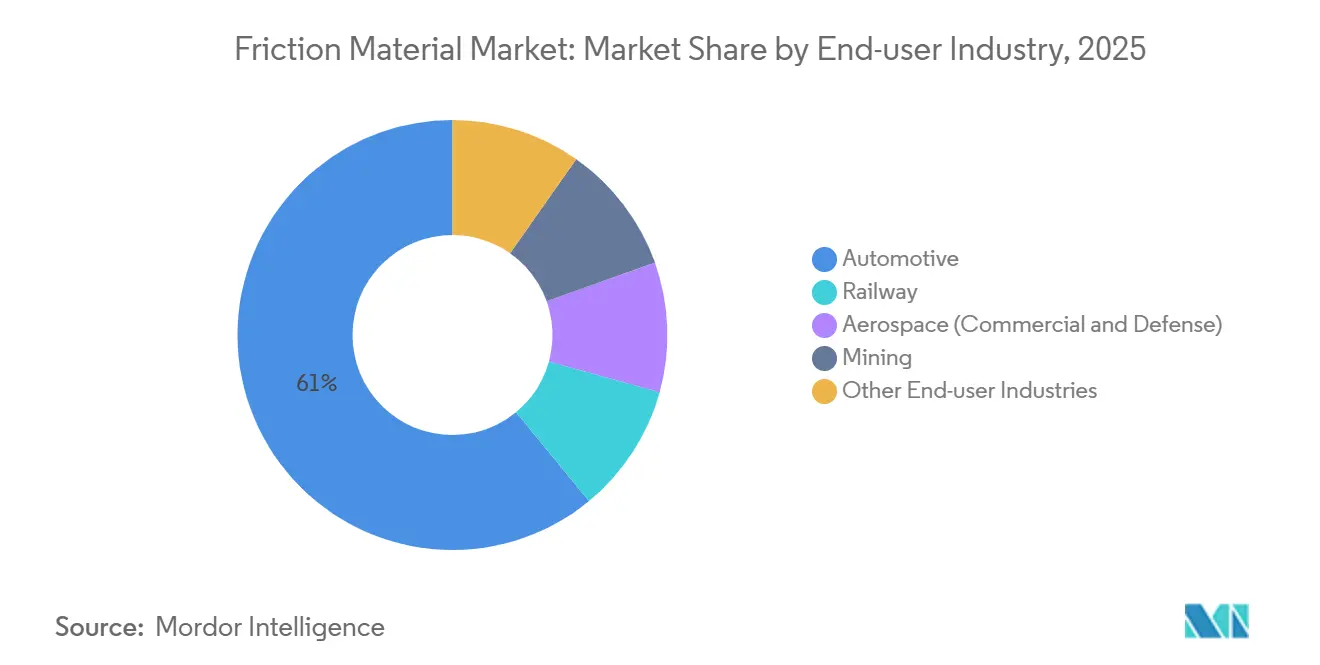
- By end-user industry, automotive captured 60.95% of the friction material market share in 2025, while aerospace leads growth at a 5.99% CAGR through 2031.
- By geography, Asia-Pacific commanded 45.97% of the friction material market share in 2025; the Middle-East and Africa post the fastest 4.68% CAGR through 2031.
Note: Market size and forecast figures in this report are generated using Mordor Intelligence’s proprietary estimation framework, updated with the latest available data and insights as of 2026.
Global Friction Material Market Trends and Insights
Drivers Impact Analysis*
| Driver | (~) % Impact on CAGR Forecast | Geographic Relevance | Impact Timeline |
|---|---|---|---|
| Surging global vehicle parc and brake-pad replacement cycles | +0.9% | Global, with concentration in Asia-Pacific (China, India, ASEAN) | Long term (≥ 4 years) |
| Stricter copper-free and low-noise norms accelerating material reformulation | +0.7% | North America (California, Washington) and Europe | Medium term (2-4 years) |
| Rapid electrification of two-wheelers and micro-mobility fleets in Asia | +0.5% | Asia-Pacific core (India, China, ASEAN), spill-over to Southeast Asia | Medium term (2-4 years) |
| Rise of autonomous warehouse robots needing micro-brake modules | +0.3% | North America, Europe, Japan | Short term (≤ 2 years) |
| Demand surge for high-temp friction materials in wind-turbine yaw and pitch systems | +0.4% | Global, led by Europe, North America, China | Long term (≥ 4 years) |
| Source: Mordor Intelligence | |||


Surging Global Vehicle Parc and Brake-Pad Replacement Cycles
Asia-Pacific’s on-road fleet exceeded 850 million vehicles in 2025, each requiring pad changes every 30,000–70,000 km depending on duty cycle. Older vehicles, now 35% of India’s parc, double their aftermarket consumption rate as deferred maintenance accelerates wear. These conditions enlarge the friction material market by sustaining brisk volumes of cost-optimized semi-metallic pads even while OEMs adopt ceramics at factory install. Commercial operators still tolerate copper content until enforcement tightens, permitting traditional suppliers a window to exhaust existing inventories. This demographic bulge therefore underpins baseline market growth despite imminent material resets.
Stricter Copper-Free and Low-Noise Norms Accelerating Material Reformulation
California SB 346 and Washington’s Better Brakes Law limited copper to 0.5 wt% from 2025, forcing pad makers to pivot to aramid, ceramic, and sintered-bronze blends that carry LeafMark certification[1]California Environmental Protection Agency, “Safer Consumer Products Brake Pads,” dtsc.ca.gov . Reformulation lifts raw-material cost by USD 2–4 per set, which tier-one suppliers try to offset through annual price-down talks. Aramid supply is oligopolistic, so any outage quickly strains compounding plants within 60 days. European 74 dB road-noise caps reinforce the same direction by promoting low-metallic and ceramic recipes, multiplying formulation complexity but opening premium niches for firms with in-house materials labs.
Rapid Electrification of Two-Wheelers and Micro-Mobility Fleets in Asia
India registered over 1.2 million electric two-wheelers in 2025 and China’s new-energy penetration hit 35.7% of two-wheeler sales. Regenerative braking recovers up to 20% of kinetic energy, lowering mechanical actuation and stretching pad life by up to 60%. Unit volumes dip, yet per-unit value rises because OEMs insist on sintered or ceramic pads resilient to intermittent high-power stops. Shared-fleet operators rely on telematics to schedule predictive maintenance, spurring demand for sensor-embedded friction modules. The outcome is a bifurcated friction material market that balances high-volume, low-margin semi-metallic products with lower-volume, higher-margin ceramic sets.
Rise of Autonomous Warehouse Robots Needing Micro-Brake Modules
Fulfillment centers worldwide deploy roughly 750,000 autonomous mobile robots that each uses four compact brake modules rated for sub-50 ms response. Sintered-metal or aramid-composite linings withstand more than 10 million cycles without fade, a threshold ordinary pads cannot reach. As e-commerce volumes climb, robot fleets double every 18 months, and the friction material market gains a high-value pocket even though volumes remain modest. Predictive maintenance sensors further bind customers to suppliers that can guarantee tight tolerance on every batch.
Restraints Impact Analysis*
| Restraint | (~) % Impact on CAGR Forecast | Geographic Relevance | Impact Timeline |
|---|---|---|---|
| Volatile prices of copper, aramid and ceramic fibers | -0.6% | Global, acute in Asia-Pacific and Europe | Short term (≤ 2 years) |
| OEM shift to sealed, maintenance-free transmissions cutting clutch demand | -0.4% | North America, Europe, China | Medium term (2-4 years) |
| EU brake-particulate limits favouring ultra-low-wear solutions | -0.3% | Europe, spill-over to UK and EFTA states | Medium term (2-4 years) |
| Source: Mordor Intelligence | |||
Volatile Prices of Copper, Aramid and Ceramic Fibers
Copper traded between USD 9,250 and USD 9,800 per metric ton during 2025, swinging gross margins by up to 300 basis points for suppliers that hedge only 60-70% of needs[2]World Bank, “Commodity Markets Outlook 2025,” worldbank.org . Aramid fiber at USD 25–35 kg is sourced mainly from two producers, so outages ripple across the friction material market within weeks. Similar concentration affects alumina-silica ceramic fibers, while logistical shocks such as the 2024 Red Sea blockage added six-week delays. Smaller firms pass surcharges to customers, eroding their edge over integrated OEMs that internalize materials labs and purchasing power.
OEM Shift to Sealed, Maintenance-Free Transmissions Cutting Clutch Demand
Wet dual-clutch and automated manual transmissions last beyond 200,000 km without friction-disc replacement, trimming clutch material needs by up to 20%. Heavy truck OEMs such as Daimler Truck already default to AMT units that essentially nullify aftermarket clutch demand. Suppliers are pivoting toward brake pads and industrial discs, but replication of lost volume is slow and margin dilution is likely until new verticals mature.
*Our forecasts treat driver/restraint impacts as directional, not additive. The impact forecasts reflect baseline growth, mix effects, and variable interactions.
Segment Analysis
By Material: Copper-Free Mandates Reshape Compound Economics
The semi-metallic retained 37.97% of the friction material market share in 2025, anchored by cost advantages in independent aftermarket channels. Ceramic formulations, spanning carbon-ceramic and carbon-carbon hybrids, are expanding at 6.02% annually and pull the highest price per kilogram, particularly in aerospace and premium automotive programs.
Demand divergence widens as North America enforces copper caps and Europe tightens dust limits; compounders scramble to qualify aramid-rich mixes, yet supply concentration among two fiber producers sends occasional price spikes that squeeze margins. The friction material industry therefore invests in in-house labs to prototype copper-free blends rapidly, while smaller firms ally with raw-material providers to secure feedstock continuity.


By Product Type: Discs Gain Share in High-Duty-Cycle Applications
Pads still generated 40.88% of 2025 shipments, reflecting their ubiquity in passenger cars, but discs are forecast to grow 5.63% through 2031 as wind-turbine, mining, and off-highway equipment adopt larger surface areas to dissipate 600 °C heat loads. Blocks and linings, mainly used in rail and heavy-duty drums, inch forward on replacement cycles but lose share as trucks convert to discs.
The friction material market size for discs is projected to expand faster because operators value lower fade and easier modular servicing, especially in mines where runtime losses are costly. Carlisle’s EL121 wet and dry disc compound already penetrates coal and copper pits, illustrating how safety regulations and uptime economics reinforce disc uptake.
By Application: Gear Tooth Systems Emerge as Niche Growth Vector
Clutch and brake systems absorbed 72.13% of 2025 volume, yet gear tooth friction applications enjoy a 5.12% CAGR as robotics makers embed micro-brake modules into every autonomous guided vehicle. These tiny units use sintered powders to survive 10 million actuations that warehouse robots accumulate in two years.
The friction material market size for gear tooth components is profitable because each robot carries four modules and buyers pay premiums to avoid unplanned shutdowns. Synchronizer rings in emerging-market trucks add incremental volume, and marine gearboxes demand corrosion-resistant binders, further diversifying end-use revenue.
By End-user Industry: Aerospace Leads Growth on Carbon-Composite Retrofits
Automotive commanded 60.95% of 2025 consumption, but its trajectory moderates as regenerative braking halves pad wear on battery-electric cars. Aerospace outpaces every segment at 5.99% CAGR, driven by lightweight carbon-carbon discs that trim aircraft wheel-assembly mass by 30%.
Rail, mining, and construction collectively consume the remainder, each guided by industry-specific safety codes that specify friction windows and temperature thresholds. The friction material industry, therefore, tailors recipes to varied requirements, from AS9100-certified carbon composites to MSHA-approved compounds for haul trucks.
Geography Analysis
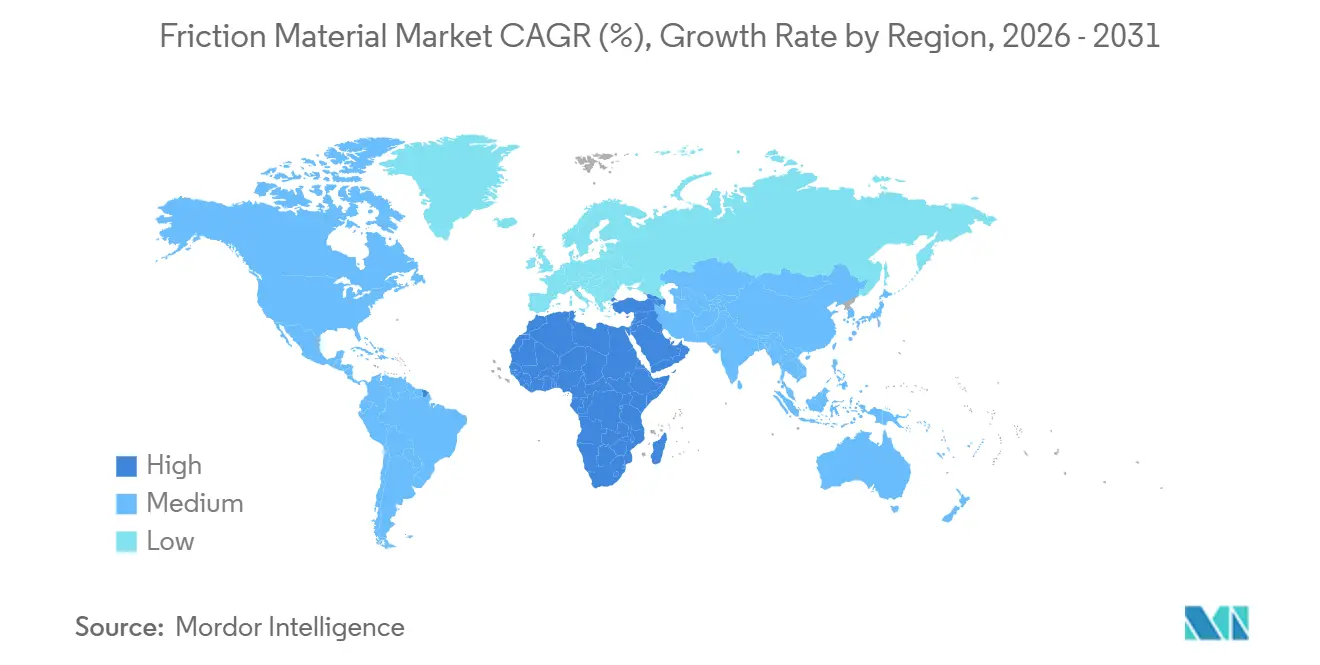
Asia-Pacific held 45.97% of global volume in 2025 and remains the anchor of the friction material market. Massive internal-combustion motorcycle fleets in ASEAN keep semi-metallic pad demand buoyant while China and India’s EV surge sparks a shift toward copper-free ceramics. Japan and South Korea export compliant pads to the United States and Europe, using advanced materials know-how as a competitive wedge.
In North America, copper-content laws in California and Washington lifted raw-material costs by USD 2–4 per set and forced rapid reformulation. Mexico’s low-cost production bases funnel compliant products northward under USMCA rules, while Canada’s mining trucks require high-temperature linings that withstand sub-zero ambient conditions. The sealed-transmission trend trims clutch demand but simultaneously raises expectations for lifetime disc reliability.
Europe incubates the strictest brake-dust limits under Euro 7, which compel OEMs to adopt ultra-low-wear ceramics. Germany’s R&D ecosystem co-develops carbon-ceramic solutions, and Brembo is erecting a EUR 700 million plant in Poland to near-source discs for regional OEMs. The Middle-East and Africa region is growing at 4.68% CAGR Saudi Arabia and the UAE localize assembly, while South America rides on commercial-vehicle output and Fras-le’s regional plant network.

Value Chain Analysis
The friction material value chain starts with feedstocks and functional additives, led by binders (phenolic resins), reinforcements (steel fibers and, increasingly, aramid and ceramic fibers), friction modifiers (graphite and other mineral fillers), and steel backing plates with shims or insulators. These inputs flow to compounders and component manufacturers, where mixing, preforming, hot pressing, curing or heat treatment, and finishing operations (slotting, grinding, coating or painting) precede supply into OEM and aftermarket channels. Copper caps and brake-dust requirements are shifting bill-of-materials toward aramid- and ceramic-rich formulations. At the same time, competing demand for graphite from EV batteries has been cited as an availability constraint, tightening procurement planning for pad makers.
Midstream, scale and qualification capacity shape competitiveness. Integrated suppliers and tier-one groups that combine materials labs, compounding, and automated finishing can industrialize copper-free recipes faster and hold the tighter tolerances required for commercial vehicles, aerospace, and robotics micro-brake modules. Downstream distribution splits between OE fitment (direct supply to vehicle and equipment OEMs) and fragmented aftermarket networks (distributors, workshops, fleet service providers), where price and compliance labeling influence purchasing. Reported 2026 constraints, including long ECE R90 testing backlogs in parts of Europe and concentrated aramid supply, notably among Teijin and DuPont, create lead-time risk. That dynamic encourages higher safety stocks and multi-sourcing across regions, including Mexico and Eastern Europe for nearshored supply into North America and Europe.
Competitive Landscape
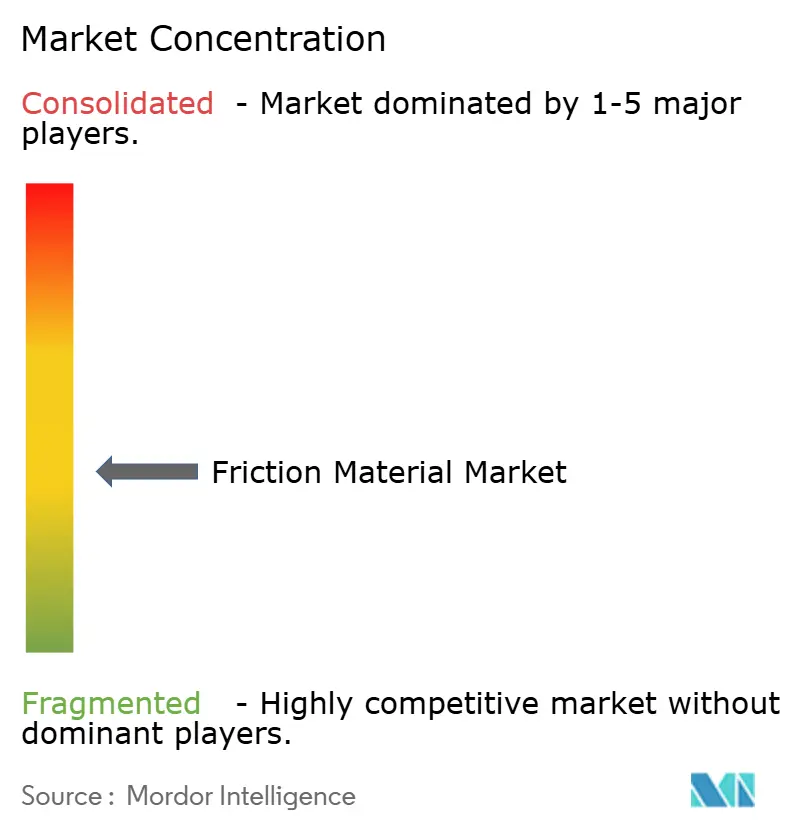
The friction material market remains fragmented, leaving ample space for regional challengers. Brembo’s Poland complex, opening in 2028, anchors a Euro-centric strategy that pairs casting and compounding under one roof for particulate-compliant discs. ITT invested EUR 50 million in Termoli to launch copper-free Geo-Pad lines that cut raw-material intensity 30% using recycled ceramic fibers.
Nisshinbo sold TMD Friction in 2024 to refocus on electronics, underlining how conglomerates redeploy capital away from lower-margin pads. Emerging contenders in China and India undercut OEM brands by 40% in the aftermarket; their price edge lasts until stricter noise and copper rules necessitate ceramic upgrades that erode the discount. Technology is a telling differentiator: additive manufacturing speeds pad-backing prototyping, and telematics-ready pads lock in fleet contracts by enabling predictive maintenance.
Aerospace remains a moat for certified incumbents like Safran and Honeywell, which possess AS9100 traceability systems that newcomers cannot replicate quickly. White-space pockets in autonomous mobile robots and wind-turbine brakes tempt entrants, but qualification hurdles, from million-cycle durability to salt-fog resistance, thin the field. Raw-material volatility finally favors vertically integrated OEMs that hedge copper and aramid internally, leaving smaller firms to absorb margin shocks or exit niche segments.
Friction Material Industry Leaders
Nisshinbo Holdings Inc.
Tenneco Inc.
Carlisle Brake & Friction (CentroMotion)
AKEBONO BRAKE INDUSTRY CO., LTD.
Brembo N.V.
- *Disclaimer: Major Players sorted in no particular order

Market Opportunities and Future Outlook
Copper-free and low-emission braking requirements are creating upgrade cycles in both OE and replacement channels, leaving room for suppliers that can deliver compliant friction formulations and coated components at scale. In the U.S., the Copper-Free Brake Initiative (supported by the EPA and MEMA) and state-level restrictions in California and Washington that limit copper to 0.5 wt% from 2025 are pushing reformulation toward ceramic and aramid-rich mixes. They also reinforce demand for validated, labeled product lines. On the technology side, low-emission brake solutions aimed at Euro 7 and China 7 particulate constraints are moving friction materials closer to systems engineering, linking pad chemistry with disc coatings and wear-reduction designs.
Capacity additions and consolidation activity also point to where suppliers are placing bets across geographies and end markets. In January 2026, ASK Automotive approved INR 350 million to add two manufacturing plants in Rajasthan, targeting a 60 million pieces per year capacity increase in brake shoes and disc brake pads, which highlights incremental, volume-led expansion in Asia. In June 2026, Rane (Madras) signed a business transfer agreement to acquire Hindustan Composites Ltd's friction materials business (enterprise value INR 370 crore), signaling inorganic moves to add scale and R&D depth. In North America, manufacturing whitespace is supported by new capacity in Mexico, with Friction One inaugurating a brake pad and disc production plant in Ciudad Juarez to serve regional demand under USMCA-aligned supply chains.
Recent Industry Developments
- April 2026: Tenneco announced a plan to cease production at its Smithville, Tennessee braking facility by mid-2027 as it aligns its manufacturing footprint with changing automotive demand and cost structures. The decision concentrates production into fewer sites and can reshape supply allocation for friction products serving North American OEM and aftermarket customers.
- February 2026: DRiV Incorporated expanded its Ferodo Premier copper-free brake pad range for commercial vehicles, adding a high-performance red coating aimed at improving initial friction and speeding the bedding-in process. The update supports fleets and workshops transitioning to copper-compliant formulations while maintaining stopping performance requirements.
- April 2025: Tenneco introduced a low-emission brake technology positioned for Euro 7 and China 7 requirements, using new friction formulations and brake disc coatings to reduce particulate emissions (PM10/PM2.5). It elevates product differentiation beyond friction blends alone and pushes suppliers toward combined pad-and-disc solutions to meet tightening brake-dust limits.


Research Methodology Framework and Report Scope
Market Definition and Coverage
This market covers friction materials used to create controlled friction in braking, clutching, and other motion-control applications, counted as the manufactured and sold material built into parts like pads, linings, discs, and blocks across key end-user industries.
Scope exclusions: It excludes the broader brake-system and drivetrain assemblies, and it does not count unrelated wear parts that do not rely on engineered friction compounds.
Segmentation Overview
- By Material
- Semi-metallic
- Ceramic (incl. carbon-ceramic and carbon-carbon)
- Asbestos
- Sintered Metals
- Aramid Fibers
- Other Materials
- By Product Type
- Pads
- Discs
- Blocks
- Linings
- Other Product Types
- By Application
- Clutch and Brake Systems
- Gear Tooth Systems
- Other Applications
- By End-user Industry
- Automotive
- Railway
- Aerospace (Commercial and Defense)
- Mining
- Other End-user Industries
- By Geography
- Asia-Pacific
- China
- India
- Japan
- South Korea
- ASEAN Countries
- Rest of Asia-Pacific
- North America
- United States
- Canada
- Mexico
- Europe
- Germany
- United Kingdom
- France
- Italy
- Spain
- Russia
- NORDIC Countries
- Rest of Europe
- South America
- Brazil
- Argentina
- Rest of South America
- Middle-East and Africa
- Saudi Arabia
- United Arab Emirates
- South Africa
- Rest of Middle-East and Africa
- Asia-Pacific
Data Sources, Market Sizing, and Validation
Desk Research
To set the foundation, we review public sources that help us understand where friction material demand comes from and how it is shifting by region. This includes vehicle production and parc indicators from sources such as the International Organization of Motor Vehicle Manufacturers, along with safety and environmental rules from agencies such as the US EPA and the European Commission.
We also use trade and manufacturing signals that can be tracked year to year, including customs and import-export releases from sources such as UN Comtrade, and industry context from trade associations such as SAE International and similar bodies across transport and industrial sectors. Company filings, investor presentations, and reputable press are then used to validate product-mix moves (for example, ceramic and low-copper trends) and to sanity-check capacity additions. Where needed, paid subscriptions for company financials and for patent databases are used to confirm timelines and technology direction. These desk sources are illustrative and not exhaustive, and many other public references are also used for cross-checking and clarification.
Primary Interviews and Surveys
Primary discussions are used to pressure-test the model assumptions that are hard to observe in public data, especially replacement rates, product-mix shifts, and how pricing differs between OE and aftermarket channels. We speak with a mix of material suppliers, component manufacturers, distributors, and end users across APAC, EMEA, and the Americas so regional vehicle fleets, rail activity, and industrial usage patterns are reflected in the final assumptions.
Distribution of primary research fieldwork respondents
| Company type | Respondent position | Region |
|---|---|---|
| Top tier: 32% | CXOs: 20% | APAC: 37% |
| Mid tier: 48% | Functional/Unit leaders: 28% | EMEA: 36% |
| Smaller Players: 20% | Managers: 52% | Americas: 27% |
Market-Sizing & Forecasting
Sizing starts with a top-down build where production, installed base, and service replacement cycles are used to reconstruct the demand pool for friction material units across core applications. We then corroborate totals with selective bottom-up approximations, such as sampling average units per vehicle or equipment class and applying indicative price bands to check whether the implied revenue and volume levels stay realistic.
Key inputs used in the model include vehicle production and fleet age mix, brake and clutch replacement frequency by use intensity, the share shift between disc and drum related consumables, the adoption rate of low-copper and low-emission formulations, and regional differences in aftermarket penetration. When gaps show up for smaller end-user industries, proxy indicators are used (for example, equipment population and duty-cycle assumptions) and are subsequently adjusted after channel feedback.
For forecasting, we rely mainly on scenario analysis supported by a light multivariate regression where the strongest explanatory variables are production outlook, fleet growth, and replacement activity, with primary expert views used to set realistic ranges for material-mix and pricing progression.
Data Validation & Update Cycle
Outputs are checked against independent signals, including regional vehicle activity indicators, trade flows for relevant friction-material categories, and the direction of price movement implied by raw-material and formulation shifts. If any region or application moves outside expected bounds, the assumptions are reopened, and interview follow-ups are triggered to confirm whether a real market shift occurred or whether an input series needs correction.
Before sign-off, the workbook goes through multi-step analyst review where calculations, unit conversions, and year-on-year growth logic are rechecked, and then the narrative is aligned to what the model is actually showing. Reports are refreshed annually, and interim updates are made when material events occur, such as regulation changes, sharp production swings, or notable formulation transitions. Right before delivery, a final pass is completed so clients receive the latest updated view.
Mordor Intelligence's Friction Material Market Sizing Compared With Other Published Estimates
Published market numbers for friction materials can vary widely, and the gap usually comes from what is being counted and how the output is expressed. Some sources size the market in USD revenue, while others track unit demand, which changes the picture when product mix and pricing are moving.
The table shows a spread mainly because this study is unit-based, and in Mordor Intelligence's model the count is tied to friction material units used across brakes, clutches, and related applications, rather than converting everything into revenue through broad ASP assumptions that may blend OE and aftermarket pricing.
Benchmark comparison
| Source | Market Size | Gaps in Research Methodology |
|---|---|---|
| Mordor Intelligence | USD 0.83 B (2025) | |
| Industry Publisher A | USD 14.48 B (2025) | Reported as revenue in USD and typically combines product categories with OE and aftermarket pricing, so the total is sensitive to ASP assumptions and mix shifts rather than unit demand alone. |
| Research House B | USD 18.20 B (2024) | Uses a broader friction products materials revenue lens across braking, clutching, and power transmission, and it can overweight automotive share and price-based expansion versus unit growth. |
Looking across the three figures, the biggest takeaway is that scope and measurement choice drive most of the difference, not a simple disagreement on growth direction. By keeping the variables traceable to production, installed base, and replacement behavior, the estimate stays easier to reproduce and simpler to validate through expert checks and year-to-year market signals.


Key Questions Answered in the Report
What is the forecast unit demand for global friction materials by 2031?
Demand is projected to reach 1.07 billion units by 2031, implying a 4.36% CAGR from 2026.
Which material type is growing fastest within friction applications?
Ceramic formulations, including carbon-ceramic and carbon-carbon hybrids, are advancing at 6.02% annually through 2031.
How do Euro 7 rules influence product specifications?
Euro 7 caps brake-dust emissions at 7 mg km-1, pressuring European OEMs to adopt ultra-low-wear ceramic pads and regenerative-braking strategies.
Why are autonomous robots a new opportunity for pad makers?
Each robot carries four high-cycle micro-brake modules that sell at three to four times the per-kilogram price of automotive pads, providing a premium niche despite low volumes.
Page last updated on:


 Your data is secure and never sold or shared.


