
Fresh Apricots Market Size and Share
Fresh Apricots Market Analysis by Mordor Intelligence
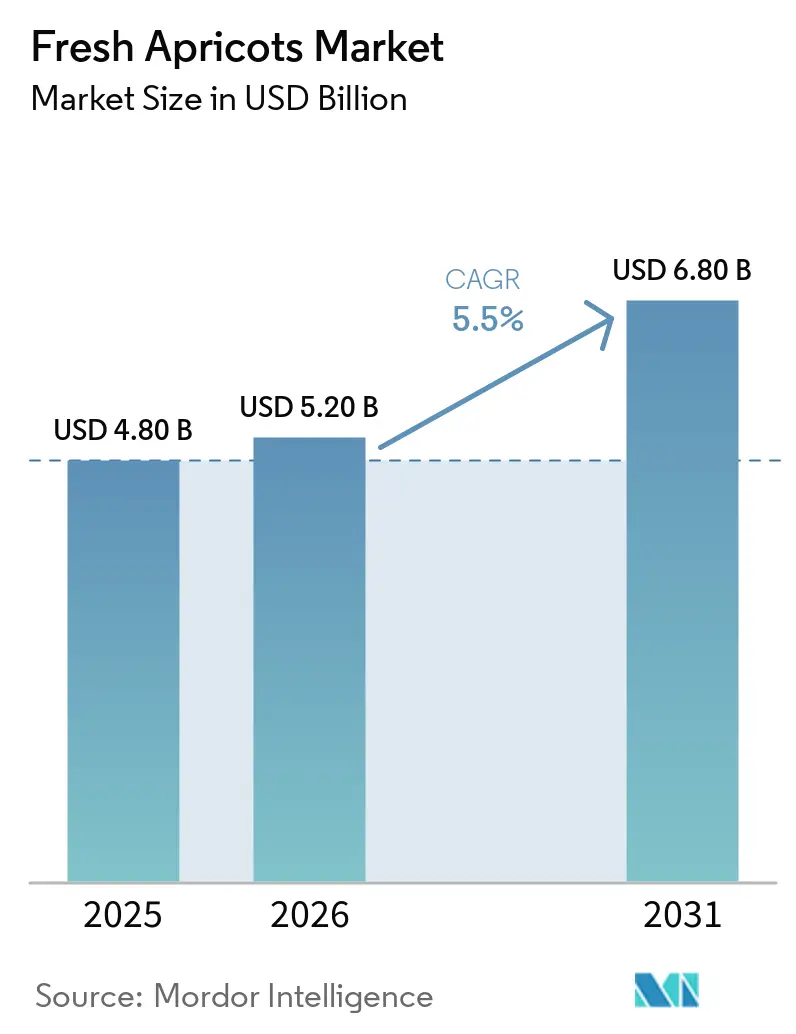
The fresh apricots market size is projected to expand from USD 4.8 billion in 2025 and USD 5.2 billion in 2026 to USD 6.8 billion by 2031, registering a 5.5% CAGR between 2026 and 2031. Robust Asian demand, new controlled-atmosphere logistics, and rising organic premiums are steering the fresh apricots commodity market toward higher-margin trade lanes. European exporters are capturing premiums in Gulf retail channels through traceable, pesticide-compliant shipments, while sea-freight technology is cutting delivery costs to China by up to 70%. Climate volatility and seasonal labor shortages continue to suppress Mediterranean output, yet technology-driven yield gains from high-density orchards are partly offsetting production risk. Competitive intensity is low, with the five largest suppliers accounting for only a small share of the global value in 2025. This has enabled agile regional specialists to grow by focusing on functional food and baby food channels.
Key Report Takeaways
- By geography, Europe accounted for 41% of the fresh apricots market share in 2025, while Asia-Pacific is advancing at an 8.5% CAGR through 2031.
Note: Market size and forecast figures in this report are generated using Mordor Intelligence’s proprietary estimation framework, updated with the latest available data and insights as of January 2026.
Global Fresh Apricots Market Trends and Insights
Drivers Impact Analysis*
| Driver | (~) % Impact on CAGR Forecast | Geographic Relevance | Impact Timeline |
|---|---|---|---|
| Rising exports from European producers to premium Asian and Gulf buyers | +1.2% | Europe, the Middle East, and the Asia-Pacific | Medium term (2-4 years) |
| Value-addition through drying, purees and baby-food use | +0.9% | Global, led by Turkey and Europe | Long term (≥ 4 years) |
| Health-driven demand for natural carotenoids and fiber | +0.8% | Global urban centers | Medium term (2-4 years) |
| High-density orchards on dwarf rootstocks boosting yields | +1.1% | Europe and North America | Long term (≥ 4 years) |
| Moldovan cost-competitive fruit displacing European Union suppliers | +0.7% | Central and Eastern Europe | Short term (≤ 2 years) |
| Wider use of controlled-atmosphere sea-freight to China | +0.6% | Asia-Pacific, Europe | Medium term (2-4 years) |
| Source: Mordor Intelligence | |||
Rising Exports from European producers to Premium Asian and Gulf buyers
Spain shipped 12,400 metric tons to the United Arab Emirates in 2025, 22% more than in 2024, at USD 3.80 per kilogram versus USD 2.10 in intra-European Union trade [1]Source: Spanish Ministry of Agriculture, Fisheries and Food, “Agricultural Statistics and Trade Data,” mapa.gob.es. Italy and France employ Protected Designation of Origin labels to command retail premiums of 40–50% in Singapore and Hong Kong. Gulf buyers source premium fruit for hospitality chains, accepting air freight costs to keep transit within 36 hours. This premiumization strategy shields margins from low-cost Turkish and Moldovan competition. European exporters now add carbon-footprint data to shipment documents, a transparency measure that resonates with health-conscious Asian consumers and reinforces price premiums in strict food-safety markets.
Value-Addition Through Drying, Purees and Baby-Food Use
Turkey converted 320,000 metric tons of fresh fruit into dried apricots in 2025, generating a double farm-gate fresh value of USD 1.2 billion. European infant-food companies purchased 45,000 metric tons of organic puree at USD 1,800 per metric ton, channeling cosmetically imperfect fruit into premium contracts [2]Source: European Environment Agency, “Climate Change Impacts on Agriculture,” eea.europa.eu. California’s Sun Valley Packing invested USD 8 million in puree capacity in 2025 to monetize culls and hedge fresh-price volatility. Year-round puree supply stabilizes processor margins and supports producer cash flow. Brand owners are also blending apricot puree with plant-based protein drinks, opening a wellness beverage segment that can absorb off-grade fruit year-round.
Health-Driven Demand for Natural Carotenoids and Fiber
Fresh apricots supply 1,094 micrograms of beta-carotene and 2 grams of fiber per 100 grams, aligning with clean-label preferences [3]Source: United States Department of Agriculture, “FoodData Central – Apricots, Raw,” United States Department of Agriculture, fdc.nal.usda.gov. North American organic apricot sales grew 19% in 2025 as millennials paid 25–30% premiums. European retailers expanded organic stone-fruit shelf space by 15% during 2025. Functional snacking brands such as Kind and Larabar launched apricot-based products that reinforce the fruit’s antioxidant halo. A 2025 Nielsen survey found that 47% of Chinese urban shoppers ranked “natural color antioxidants” among the top three attributes influencing specialty-fruit purchases, directly supporting the momentum in apricot demand.
High-Density Orchards on Dwarf Rootstocks Boosting Yieldsx
Trials conducted in 2025 in Turkey and Spain increased yields by 25–35% per hectare and reduced bearing age to 3 years. Mechanized pruning platforms reduced labor needs by up to 40%, a crucial advantage given that harvest labor fell 30% in 2025. California growers planted 1,200 hectares of high-density orchards targeting 22 metric tons per hectare, reallocating capital from water-intensive almonds. Dwarf systems also enable hail netting that reduces crop loss by 15–20%. Adoption of drip-fertigation systems on dwarf rootstocks is improving water-use efficiency by 25%, helping producers meet tightening irrigation quotas without sacrificing yield potential.
Restraints Impact Analysis*
| Restraint | (~) % Impact on CAGR Forecast | Geographic Relevance | Impact Timeline |
|---|---|---|---|
| Climate extremes (late frost, hail, drought) damaging crops | −0.9% | Mediterranean, Middle East, Central Asia | Short term (≤ 2 years) |
| Persistent farm-gate price volatility eroding margins | −0.6% | Turkey, Mediterranean Europe | Short term (≤ 2 years) |
| Seasonal labor shortages in Mediterranean orchards | −0.7% | Spain, Italy, California | Medium term (2-4 years) |
| Stricter European Union Maximum Residue Limits (MRL) limiting pesticide options | −0.5% | Europe and export-dependent suppliers | Long term (≥ 4 years) |
| Source: Mordor Intelligence | |||
Climate Extremes (Late Frost, Hail, Drought) Damaging Crops
According to the Turkish Statistical Institute (TurkStat), Late frost destroyed 70% of Turkey’s Malatya crop in 2025, removing 560,000 metric tons and spiking wholesale prices by 300%. Spain lost 35% to hail in the same season, while Italy endured drought-induced sunburn losses near 28%. European Environment Agency data show a 40% rise in extreme events affecting stone fruit between 2020 and 2025. Mitigation tools such as wind machines add USD 3,000–5,000 per hectare and are workable only for export-oriented producers. Index-based crop-insurance pilots launched in Turkey and Spain in late 2025 aim to transfer part of the climate risk to insurers, but premiums of USD 120–150 per hectare remain a barrier for smallholders.
Persistent Farm-Gate Price Volatility Eroding Margins
Turkish farm-gate prices swung from USD 0.80 in 2024 to USD 3.20 per kilogram in 2025 after frost shortages. Spanish wholesale values fluctuated between USD 1.60–2.80 during 2025 as Morocco and Greece adjusted harvest timing. Without cold storage, smallholders must liquidate fruit at harvest-week lows, shrinking margins. Cooperative price-floor pilots in California cover only 20% of growers because of contract complexity. Blockchain-enabled spot-auction platforms launched in 2026 promise faster grower access to diversified buyers, yet adoption is still below 10% of Mediterranean producers who cite technology costs and limited rural connectivity as hurdles.
*Our forecasts treat driver/restraint impacts as directional, not additive. The impact forecasts reflect baseline growth, mix effects, and variable interactions.
Geography Analysis
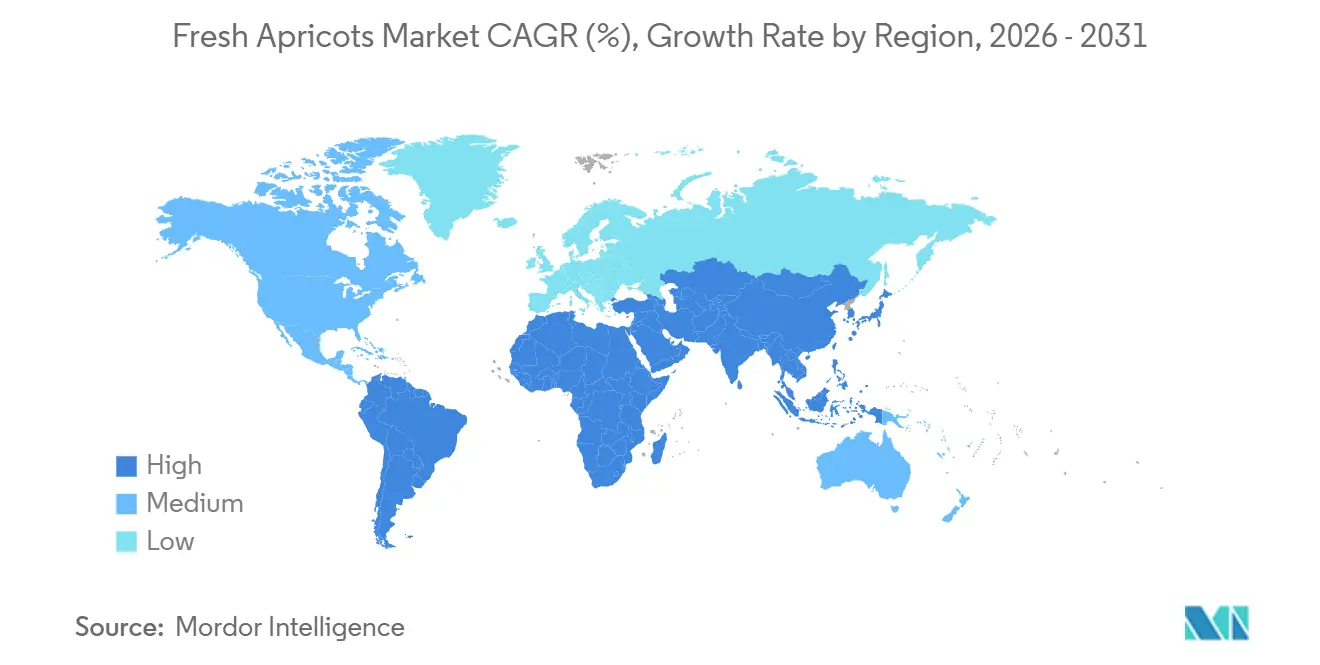
Europe accounted for 41% of fresh apricot consumption value in 2025, reflecting robust intra-European demand that absorbs much of the region’s own harvest. Shoppers in France, Spain, and Italy favor locally grown fruit with Protected Designation of Origin status, helping retailers command premiums that lift overall consumption value. Asia-Pacific is the fastest-growing consumption region, advancing at an 8.5% CAGR through 2031 as rising disposable incomes and expanding cold-chain networks bring imported apricots to a wider urban base. Controlled-atmosphere sea freight has cut landed costs in China significantly, accelerating the pull of Asian demand on European surplus volumes.
The Middle East and Africa together generate meaningful consumption value, driven by Iran’s large domestic market and Gulf countries that import premium European fruit for high-end retail and hospitality channels. North America’s consumption value remains modest. California meets local demand yet faces competition from Chilean off-season imports that sustain year-round supply. South America’s Chile and Argentina supply regional neighbors but also ship to North America during December–March, capturing premiums when Northern Hemisphere fruit is scarce. These regions collectively cushion seasonal gaps and help stabilize global availability.
Looking ahead, Europe’s consumption value is projected to edge higher as retailers expand organic assortments and leverage traceability to justify premium pricing. Asia-Pacific demand will keep climbing as controlled-atmosphere logistics unlock Tier 2 and Tier 3 Chinese cities and Uzbekistan scales low-cost supply via rail corridors. Gulf importers are set to maintain premium purchases, while South Africa and Chile are growing counter-seasonal shipments to satisfy Northern Hemisphere retailers during winter windows. Together, these regional consumption dynamics underpin the market’s projected significant growth by 2031, widening its geographic reach and smoothing seasonal volatility.


Regulatory Landscape
Fresh apricot trade is shaped by phytosanitary entry rules and destination-market quality requirements. In the United States, USDA APHIS regulates fresh fruit imports under 7 CFR 319.56 (Fruits and Vegetables), using commodity approval, pest risk analysis pathways for non-authorized commodities, and permit-based phytosanitary measures (including orchard registration and specified post-harvest treatments). These import protocols act as practical market-access gates for exporters, particularly when shipments are redirected during short Mediterranean seasons.
In the European Union, imported fresh fruits must arrive with phytosanitary certificates and comply with EU marketing standards covering quality, labeling, and conformity checks at import. Residue compliance is a key commercial constraint for suppliers serving EU and EU-aligned retail channels, which keeps documented spray programs and traceability at the center of cross-border shipments.
Value Chain Analysis
The fresh apricots value chain starts with nursery material and orchard inputs (rootstocks, fertilizers, crop protection), then moves through on-farm production and harvest where seasonality and labor availability drive costs and losses. Packhouses handle grading and quality sorting, increasingly relying on automated and AI-enabled lines to improve pack-out and reduce manual labor, followed by rapid precooling, cold storage, and controlled-atmosphere logistics that extend shelf life and support longer trade lanes, including ocean freight.
Downstream, wholesalers, importers, modern retail, and foodservice compete with processors (puree and drying) for volumes, with processing serving as an outlet for cosmetically imperfect fruit and as a hedge against fresh price volatility. Climate shocks create the largest upstream bottleneck, illustrated by Turkey, where late-frost damage in 2025 removed a large share of the Malatya crop, tightening supply across both fresh and processed channels and increasing the need for diversified sourcing and risk-mitigation tools such as protective netting and insurance pilots.
Competitive Landscape
In 2025, the five largest suppliers collectively held a minimal share of the global fresh apricot market, highlighting its fragmented nature. Pagysa Pamuk Gida Sanayi ve Ticaret and Suer Gida Sanayi ve Ticaret set the competitive tone by integrating orchards, pack-houses, and drying facilities that keep unit costs low while maximizing fruit utilization. Both Turkish operators leverage proximity to Malatya’s concentrated supply and contract farming to secure year-round throughput for their 15,000-metric-ton controlled-atmosphere stores. Artificial-intelligence sorting lines running at more than 10 metric tons per hour allow these leaders to cut labor outlays by 40% and lift export pack-out rates.
Kirlioglu Gida expands its Turkish contingent with Global Good Agricultural Practices (GlobalG.A.P) certified orchards, opening doors to premium European and Gulf retail chains. Dole Food Company balances the Northern Hemisphere season by sourcing from California and Chile, using its multichannel distribution network to smooth seasonal gaps for the United States grocers. South Africa’s Capespan reinforces counter-seasonal supply to Europe and the Middle East during December through February windows when Northern Hemisphere crops are absent. All three firms invest in controlled-atmosphere or fast-cooling technologies that extend shelf life to 28 days, enabling ocean freight to Asia at far lower costs than air options.
Looking ahead, the leading companies are scaling up technology and certification to deepen penetration in Asia and the Gulf, where import demand is growing rapidly. Pagysa is targeting 8,000 metric tons of sea-freight shipments to China in 2026 after doubling storage capacity, while Kirlioglu plans to extend Global Good Agricultural Practices (GlobalG.A.P) coverage across all contract orchards to secure higher retail shelf prices. Dole and Capespan intend to expand their hemispheric sourcing portfolios, helping cushion climate shocks and ensuring retailers have uninterrupted supply. Collectively, these moves position the top players to expand the premium end of the fresh apricots market and boost overall value growth through 2031.
Market Opportunities and Future Outlook
Premium export programs and improved price discovery are creating room for differentiated, traceable fresh apricots in Gulf and Asian retail channels. Spain increased shipments to the United Arab Emirates to 12,400 metric tons in 2025, and European suppliers pair residue-compliant production with documented processes, including carbon-footprint data in shipment paperwork, to defend higher realized prices in strict food-safety markets. Controlled-atmosphere sea freight that extends shelf life to about 28 days and reduces delivery costs versus air freight supports wider import penetration, particularly in China.
New origin development and digitization efforts also expand tradable supply while reducing post-harvest losses. In April 2026, the Administration of Ladakh signed an MoU with Lulu Group to export 1,000 tonnes of local apricot varieties starting in July 2026, underscoring an active effort to formalize export logistics from high-altitude regions where cold storage and packing infrastructure have been constraints. In parallel, in April 2026 Malatya introduced an electronic auction platform tied to a licensed 5,000-ton capacity warehouse, helping standardize grading, improve price transparency, and accelerate buyer access in an origin that already sits at the center of global apricot trade flows.
Recent Industry Developments
- July 2026: The Administration of Ladakh flagged off the first 5 metric tonne consignment of fresh apricots to the United Arab Emirates (July 14, 2026) under the broader 1,000 metric tonne export initiative with Lulu Group. The shipment formalized an end-to-end export chain with coordinated harvesting, packing, and international logistics, signaling a new origin-to-Gulf lane for premium fresh fruit.
- May 2025: The International Nut and Dried Fruit Council highlighted that the India-United Kingdom free trade agreement removes United Kingdom import duties on edible fruit and nuts, including dried apricots, from the day the accord enters into force. Duty removal improves landed-price competitiveness for suppliers serving UK retail and ingredient channels and can reshape procurement toward tariff-advantaged origins.
- September 2024: The International Nut and Dried Fruit Council reported that a new United States executive order allows zero-tariff entry for dried apricots and other specialty nuts sourced from trade-agreement partners. This policy change lowers border costs for eligible exporters and supports counter-seasonal supply strategies into the US market.


Research Methodology Framework and Report Scope
Market Definition and Coverage
This market covers the value of apricots sold in fresh form for human consumption across producing and importing countries, counted at the first commercial sale point when fruit enters wholesale or organized trade. Prices and volumes are tracked using harvest data, trade flows, and seasonality.
Scope exclusions: It does not include dried apricots, canned or frozen apricot products, juices, jams, or other processed ingredients, and it also excludes on-farm household consumption that never enters commercial channels.
Segmentation Overview
- By Geography
- North America
- United States
- Production Analysis (Area Harvested, Yield, and Production Volume)
- Consumption Analysis (Consumption Value and Volume)
- Import Market Analysis (Import Value, Volume, and Key Supplying Markets)
- Export Market Analysis (Export Value, Volume, and Key Destination Markets)
- Wholesale Price Trend Analysis and Forecast
- Regulatory Framework
- List of Key Players
- Logistics and Infrastructure
- Seasonality Analysis
- Canada
- Production Analysis (Area Harvested, Yield, and Production Volume)
- Consumption Analysis (Consumption Value and Volume)
- Import Market Analysis (Import Value, Volume, and Key Supplying Markets)
- Export Market Analysis (Export Value, Volume, and Key Destination Markets)
- Wholesale Price Trend Analysis and Forecast
- Regulatory Framework
- List of Key Players
- Logistics and Infrastructure
- Seasonality Analysis
- United States
- South America
- Chile
- Production Analysis (Area Harvested, Yield, and Production Volume)
- Consumption Analysis (Consumption Value and Volume)
- Import Market Analysis (Import Value, Volume, and Key Supplying Markets)
- Export Market Analysis (Export Value, Volume, and Key Destination Markets)
- Wholesale Price Trend Analysis and Forecast
- Regulatory Framework
- List of Key Players
- Logistics and Infrastructure
- Seasonality Analysis
- Argentina
- Production Analysis (Area Harvested, Yield, and Production Volume)
- Consumption Analysis (Consumption Value and Volume)
- Import Market Analysis (Import Value, Volume, and Key Supplying Markets)
- Export Market Analysis (Export Value, Volume, and Key Destination Markets)
- Wholesale Price Trend Analysis and Forecast
- Regulatory Framework
- List of Key Players
- Logistics and Infrastructure
- Seasonality Analysis
- Peru
- Production Analysis (Area Harvested, Yield, and Production Volume)
- Consumption Analysis (Consumption Value and Volume)
- Import Market Analysis (Import Value, Volume, and Key Supplying Markets)
- Export Market Analysis (Export Value, Volume, and Key Destination Markets)
- Wholesale Price Trend Analysis and Forecast
- Regulatory Framework
- List of Key Players
- Logistics and Infrastructure
- Seasonality Analysis
- Ecuador
- Production Analysis (Area Harvested, Yield, and Production Volume)
- Consumption Analysis (Consumption Value and Volume)
- Import Market Analysis (Import Value, Volume, and Key Supplying Markets)
- Export Market Analysis (Export Value, Volume, and Key Destination Markets)
- Wholesale Price Trend Analysis and Forecast
- Regulatory Framework
- List of Key Players
- Logistics and Infrastructure
- Seasonality Analysis
- Brazil
- Production Analysis (Area Harvested, Yield, and Production Volume)
- Consumption Analysis (Consumption Value and Volume)
- Import Market Analysis (Import Value, Volume, and Key Supplying Markets)
- Export Market Analysis (Export Value, Volume, and Key Destination Markets)
- Wholesale Price Trend Analysis and Forecast
- Regulatory Framework
- List of Key Players
- Logistics and Infrastructure
- Seasonality Analysis
- Chile
- Europe
- Spain
- Production Analysis (Area Harvested, Yield, and Production Volume)
- Consumption Analysis (Consumption Value and Volume)
- Import Market Analysis (Import Value, Volume, and Key Supplying Markets)
- Export Market Analysis (Export Value, Volume, and Key Destination Markets)
- Wholesale Price Trend Analysis and Forecast
- Regulatory Framework
- List of Key Players
- Logistics and Infrastructure
- Seasonality Analysis
- Italy
- Production Analysis (Area Harvested, Yield, and Production Volume)
- Consumption Analysis (Consumption Value and Volume)
- Import Market Analysis (Import Value, Volume, and Key Supplying Markets)
- Export Market Analysis (Export Value, Volume, and Key Destination Markets)
- Wholesale Price Trend Analysis and Forecast
- Regulatory Framework
- List of Key Players
- Logistics and Infrastructure
- Seasonality Analysis
- France
- Production Analysis (Area Harvested, Yield, and Production Volume)
- Consumption Analysis (Consumption Value and Volume)
- Import Market Analysis (Import Value, Volume, and Key Supplying Markets)
- Export Market Analysis (Export Value, Volume, and Key Destination Markets)
- Wholesale Price Trend Analysis and Forecast
- Regulatory Framework
- List of Key Players
- Logistics and Infrastructure
- Seasonality Analysis
- Germany
- Production Analysis (Area Harvested, Yield, and Production Volume)
- Consumption Analysis (Consumption Value and Volume)
- Import Market Analysis (Import Value, Volume, and Key Supplying Markets)
- Export Market Analysis (Export Value, Volume, and Key Destination Markets)
- Wholesale Price Trend Analysis and Forecast
- Regulatory Framework
- List of Key Players
- Logistics and Infrastructure
- Seasonality Analysis
- Russia
- Production Analysis (Area Harvested, Yield, and Production Volume)
- Consumption Analysis (Consumption Value and Volume)
- Import Market Analysis (Import Value, Volume, and Key Supplying Markets)
- Export Market Analysis (Export Value, Volume, and Key Destination Markets)
- Wholesale Price Trend Analysis and Forecast
- Regulatory Framework
- List of Key Players
- Logistics and Infrastructure
- Seasonality Analysis
- Ukraine
- Production Analysis (Area Harvested, Yield, and Production Volume)
- Consumption Analysis (Consumption Value and Volume)
- Import Market Analysis (Import Value, Volume, and Key Supplying Markets)
- Export Market Analysis (Export Value, Volume, and Key Destination Markets)
- Wholesale Price Trend Analysis and Forecast
- Regulatory Framework
- List of Key Players
- Logistics and Infrastructure
- Seasonality Analysis
- Romania
- Production Analysis (Area Harvested, Yield, and Production Volume)
- Consumption Analysis (Consumption Value and Volume)
- Import Market Analysis (Import Value, Volume, and Key Supplying Markets)
- Export Market Analysis (Export Value, Volume, and Key Destination Markets)
- Wholesale Price Trend Analysis and Forecast
- Regulatory Framework
- List of Key Players
- Logistics and Infrastructure
- Seasonality Analysis
- Spain
- Asia-Pacific
- China
- Production Analysis (Area Harvested, Yield, and Production Volume)
- Consumption Analysis (Consumption Value and Volume)
- Import Market Analysis (Import Value, Volume, and Key Supplying Markets)
- Export Market Analysis (Export Value, Volume, and Key Destination Markets)
- Wholesale Price Trend Analysis and Forecast
- Regulatory Framework
- List of Key Players
- Logistics and Infrastructure
- Seasonality Analysis
- India
- Production Analysis (Area Harvested, Yield, and Production Volume)
- Consumption Analysis (Consumption Value and Volume)
- Import Market Analysis (Import Value, Volume, and Key Supplying Markets)
- Export Market Analysis (Export Value, Volume, and Key Destination Markets)
- Wholesale Price Trend Analysis and Forecast
- Regulatory Framework
- List of Key Players
- Logistics and Infrastructure
- Seasonality Analysis
- Pakistan
- Production Analysis (Area Harvested, Yield, and Production Volume)
- Consumption Analysis (Consumption Value and Volume)
- Import Market Analysis (Import Value, Volume, and Key Supplying Markets)
- Export Market Analysis (Export Value, Volume, and Key Destination Markets)
- Wholesale Price Trend Analysis and Forecast
- Regulatory Framework
- List of Key Players
- Logistics and Infrastructure
- Seasonality Analysis
- Japan
- Production Analysis (Area Harvested, Yield, and Production Volume)
- Consumption Analysis (Consumption Value and Volume)
- Import Market Analysis (Import Value, Volume, and Key Supplying Markets)
- Export Market Analysis (Export Value, Volume, and Key Destination Markets)
- Wholesale Price Trend Analysis and Forecast
- Regulatory Framework
- List of Key Players
- Logistics and Infrastructure
- Seasonality Analysis
- Uzbekistan
- Production Analysis (Area Harvested, Yield, and Production Volume)
- Consumption Analysis (Consumption Value and Volume)
- Import Market Analysis (Import Value, Volume, and Key Supplying Markets)
- Export Market Analysis (Export Value, Volume, and Key Destination Markets)
- Wholesale Price Trend Analysis and Forecast
- Regulatory Framework
- List of Key Players
- Logistics and Infrastructure
- Seasonality Analysis
- China
- Middle East
- Turkey
- Production Analysis (Area Harvested, Yield, and Production Volume)
- Consumption Analysis (Consumption Value and Volume)
- Import Market Analysis (Import Value, Volume, and Key Supplying Markets)
- Export Market Analysis (Export Value, Volume, and Key Destination Markets)
- Wholesale Price Trend Analysis and Forecast
- Regulatory Framework
- List of Key Players
- Logistics and Infrastructure
- Seasonality Analysis
- Iran
- Production Analysis (Area Harvested, Yield, and Production Volume)
- Consumption Analysis (Consumption Value and Volume)
- Import Market Analysis (Import Value, Volume, and Key Supplying Markets)
- Export Market Analysis (Export Value, Volume, and Key Destination Markets)
- Wholesale Price Trend Analysis and Forecast
- Regulatory Framework
- List of Key Players
- Logistics and Infrastructure
- Seasonality Analysis
- Turkey
- Africa
- Egypt
- Production Analysis (Area Harvested, Yield, and Production Volume)
- Consumption Analysis (Consumption Value and Volume)
- Import Market Analysis (Import Value, Volume, and Key Supplying Markets)
- Export Market Analysis (Export Value, Volume, and Key Destination Markets)
- Wholesale Price Trend Analysis and Forecast
- Regulatory Framework
- List of Key Players
- Logistics and Infrastructure
- Seasonality Analysis
- Algeria
- Production Analysis (Area Harvested, Yield, and Production Volume)
- Consumption Analysis (Consumption Value and Volume)
- Import Market Analysis (Import Value, Volume, and Key Supplying Markets)
- Export Market Analysis (Export Value, Volume, and Key Destination Markets)
- Wholesale Price Trend Analysis and Forecast
- Regulatory Framework
- List of Key Players
- Logistics and Infrastructure
- Seasonality Analysis
- Morocco
- Production Analysis (Area Harvested, Yield, and Production Volume)
- Consumption Analysis (Consumption Value and Volume)
- Import Market Analysis (Import Value, Volume, and Key Supplying Markets)
- Export Market Analysis (Export Value, Volume, and Key Destination Markets)
- Wholesale Price Trend Analysis and Forecast
- Regulatory Framework
- List of Key Players
- Logistics and Infrastructure
- Seasonality Analysis
- South Africa
- Production Analysis (Area Harvested, Yield, and Production Volume)
- Consumption Analysis (Consumption Value and Volume)
- Import Market Analysis (Import Value, Volume, and Key Supplying Markets)
- Export Market Analysis (Export Value, Volume, and Key Destination Markets)
- Wholesale Price Trend Analysis and Forecast
- Regulatory Framework
- List of Key Players
- Logistics and Infrastructure
- Seasonality Analysis
- Egypt
- North America
Data Sources, Market Sizing, and Validation
Desk Research
Desk research starts by building the supply and trade view using public datasets that stay consistent year to year, then layering pricing context so the value series remains realistic. For production and harvested area, we typically refer to sources such as FAOSTAT, and for import and export values and volumes we use UN Comtrade. For global horticulture indicators, we also use USDA datasets, and for EU trade and agricultural statistics we rely on Eurostat. For price signals, we review country agriculture ministry releases and market information portals, and where relevant we incorporate customs and port updates.
Company filings, investor presentations, and reputable press coverage help us understand handling infrastructure, cold chain constraints, and shifts in export corridors that can change realized prices. We also use paid subscriptions for company financials and intelligence, patent databases when post-harvest technology changes matter, and shipment-level import and export databases to cross-check trade direction and unit values in key routes. The sources listed here are illustrative, and we review additional public references to collect, validate, and clarify the final assumptions.
Primary Interviews and Surveys
Primary work is used to pressure test the desk-based supply and trade view, with a focus on pack-out rates, grade mix, and how much fruit moves through organized wholesale versus informal channels. We speak with growers, exporters, importers, wholesalers, and retail procurement teams across major producing and consuming regions. When harvest shocks or freight changes create unusual price movements, we revisit a subset of respondents to check whether our assumptions on marketed volumes and channel mix still hold.
Distribution of primary research fieldwork respondents
| Company type | Respondent position | Region |
|---|---|---|
| Top tier: 38% | CXOs: 13% | APAC: 53% |
| Mid tier: 45% | Functional/Unit leaders: 42% | EMEA: 29% |
| Smaller Players: 17% | Managers: 45% | Americas: 18% |
Market-Sizing & Forecasting
Sizing begins with a top-down reconstruction where production and trade data are used to derive the commercially marketed fresh apricot pool by region, then value is built by applying representative wholesale price series and trade unit values. Because fresh fruit pricing can swing within a season, we convert prices using annual averages and align them with the same marketing-year logic used for volumes where possible. Key inputs include harvested area and yield trends, exportable surplus versus domestic absorption, import dependency in deficit regions, wholesale price indices, and observed trade unit values from customs data. Together, these inputs keep the value estimate tied to real movement of fruit.
After that, selective bottom-up checks are run using sampled volume handled by large exporters and importers, channel checks on wholesale market throughput, and simple ASP times volume calculations for a few priority corridors. We use these results to adjust any large gaps that arise from the top-down reconstruction. Where data is thin, we bridge using nearby-country yield and price proxies, then validate directionally with interview feedback on grade mix and pack sizes. Forecasts are built using scenario analysis supported by short-cycle drivers such as weather-driven yield risk, orchard replacement cycles, logistics costs, and expected demand for seasonal fresh fruit in retail and foodservice, and then the final path is reviewed with experts so the assumptions remain practical.
Data Validation & Update Cycle
Validation is done through checks that compare model outputs with independent signals, such as whether implied per capita availability is reasonable, whether export shares match known trade patterns, and whether price moves align with reported harvest outcomes. When a country shows an unusual jump, we re-check the underlying production or trade series, review currency conversion timing, and then confirm the direction with at least one fresh set of primary inputs before sign-off.
Each report is refreshed annually, and interim updates are applied when material events occur, such as major crop failures, policy changes affecting trade, or sharp freight disruptions. Before delivery, a final analyst pass captures the latest public data releases and ensures earlier assumptions still hold.
Mordor Intelligence's Fresh Apricots Market Size Measured Against Other Published Estimates
Published market sizes for fresh apricots often disagree because different studies count different transaction points, and they also treat trade and farm-gate values in different ways. The benchmark table below puts the main published numbers side by side so the spread is easier to interpret.
The table shows a wider range mainly because some estimates blend fresh apricots with adjacent fruit baskets, or they mix retail value with wholesale value without clearly stating it. Totals also shift when spot prices from peak weeks are used instead of annual averages, or when informal local sales are assumed as fully monetized at commercial prices even in high-producing regions.
Benchmark comparison
| Source | Market Size | Gaps in Research Methodology |
|---|---|---|
| Mordor Intelligence | USD 5.20 B (2026) | |
| Global Research House A | USD 1.89 B (2025) | Uses a smaller value base that appears closer to farm-gate revenue and applies lighter trade and wholesale price normalization, which can understate markets where imports and organized wholesale trade dominate pricing. |
| Agriculture Media Desk B | USD 1.25 B (2030) | Anchors to a single cited historical value point and projects forward with a generalized CAGR, with limited visibility on how production, export flows, and annual average pricing are reconciled year to year. |
The table indicates that the biggest driver is what is being priced and at which point. In Mordor Intelligence's model, the value is tied to commercially marketed fresh volumes validated using trade unit values and wholesale annual averages. Once the scope and price basis are stated clearly, the remaining differences are easier to understand and adjust in planning models.


Key Questions Answered in the Report
How large is the fresh apricots commodity market in 2026?
The fresh apricots market size is USD 5.2 billion in 2026 and is on track to reach USD 6.8 billion by 2031.
Which region grows fastest through 2031?
Asia-Pacific leads with an 8.5% CAGR, driven by China's import surge and expanding cold-chain reach.
What share do exports hold in global trade value?
Exports accounted for 34% of trade value in 2025 and remain the dominant flow amid widening Asian demand.
Why are European suppliers shifting to Gulf markets?
Premium retail pricing, stringent residue standards, and fast air-freight lanes allow European fruit to secure higher margins in Gulf channels.
How does controlled-atmosphere shipping benefit suppliers?
It doubles shelf life to 28 days and cuts logistics costs by up to 70%, enabling cost-effective sea freight to China and other distant markets.
Page last updated on:


 Your data is secure and never sold or shared.


