Market Overview
| Study Period | 2021 - 2031 |
|---|---|
| Forecast Data Period | 2026 - 2031 |
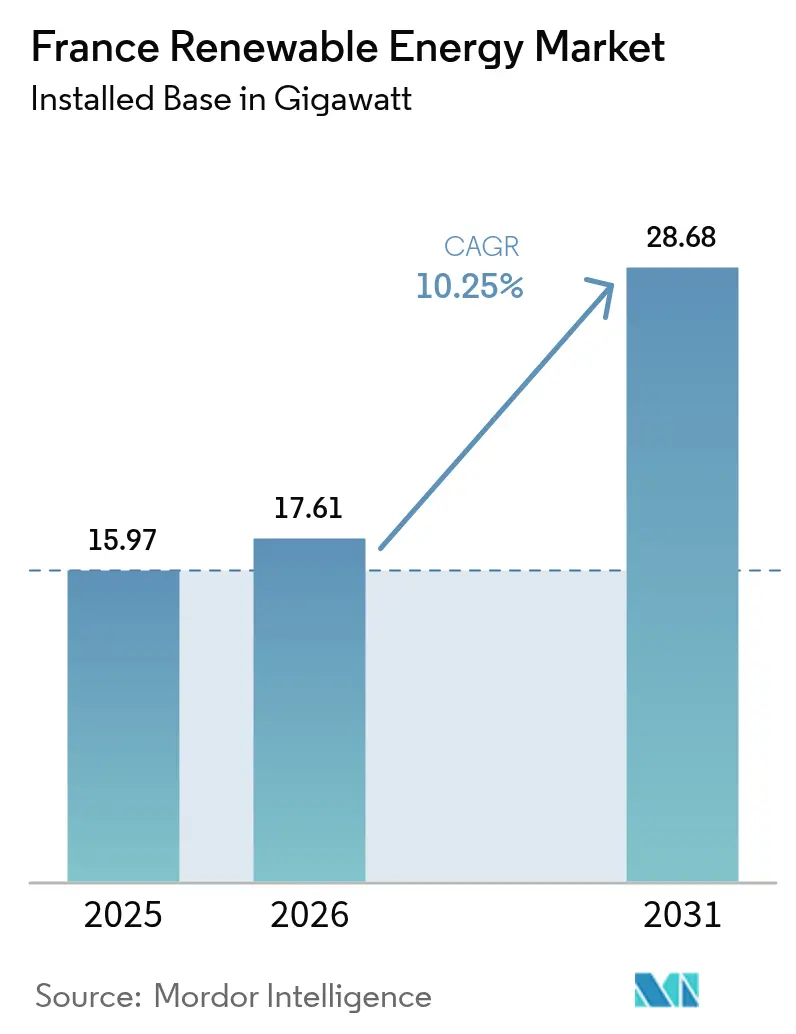
| Base Year Market Size (2025) | 15.97 gigawatt |
| Market Volume (2026) | 17.61 gigawatt |
| Market Volume (2031) | 28.68 gigawatt |
| Growth Rate (2026 - 2031) | 10.25% CAGR |
| Market Concentration | Medium |
Major Players *Disclaimer: Major Players sorted in no particular order Image © Mordor Intelligence. Reuse requires attribution under CC BY 4.0. | |
France Renewable Energy Market Analysis by Mordor Intelligence
The France Renewable Energy Market size is expected to grow from 15.97 gigawatt in 2025 to 17.61 gigawatt in 2026 and is forecast to reach 28.68 gigawatt by 2031 at 10.25% CAGR over 2026-2031.
Steady momentum reflects binding REPowerEU mandates, a 20% fall in solar-PV installed costs reported by IRENA in 2024, and a corporate PPA pipeline that surpassed 1,842 GWh during 2024. Falling levelized costs have lifted project returns above the 8% hurdle preferred by French pension funds, helping utilities and independent power producers accelerate the conversion of their pipelines. Offshore wind auctions under the revised Multi-year Energy Programme (PPE2) are broadening the diversity of technology and crowding in long-term project finance from domestic banks. At the same time, agrivoltaics legislation enacted in 2024 is unlocking dual land use across 500,000 hectares of viticulture and cereal zones, laying the groundwork for the next growth leg of commercial-scale solar. Competitive intensity is rising as integrated utilities, such as EDF Renewables, TotalEnergies, and Engie Green, vie with Neoen, Voltalia, and Akuo Energy for feed-in tariff contracts and corporate off-take agreements. Meanwhile, grid bottlenecks in Brittany and Provence-Alpes-Côte d’Azur are expected to require EUR 100 billion of transmission upgrades through 2040.
Key Report Takeaways
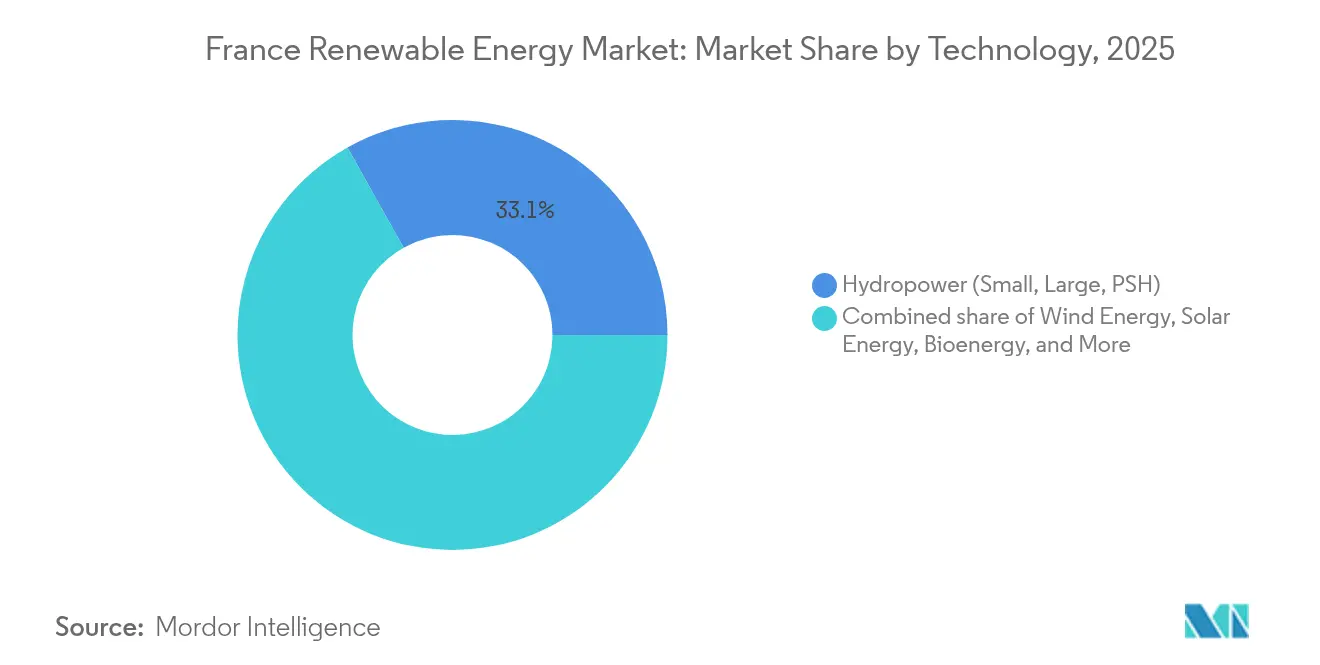
- By technology, hydropower held 33.12% of France's renewable energy market share in 2025; solar energy is forecast to climb at a 18.55% CAGR through 2031.
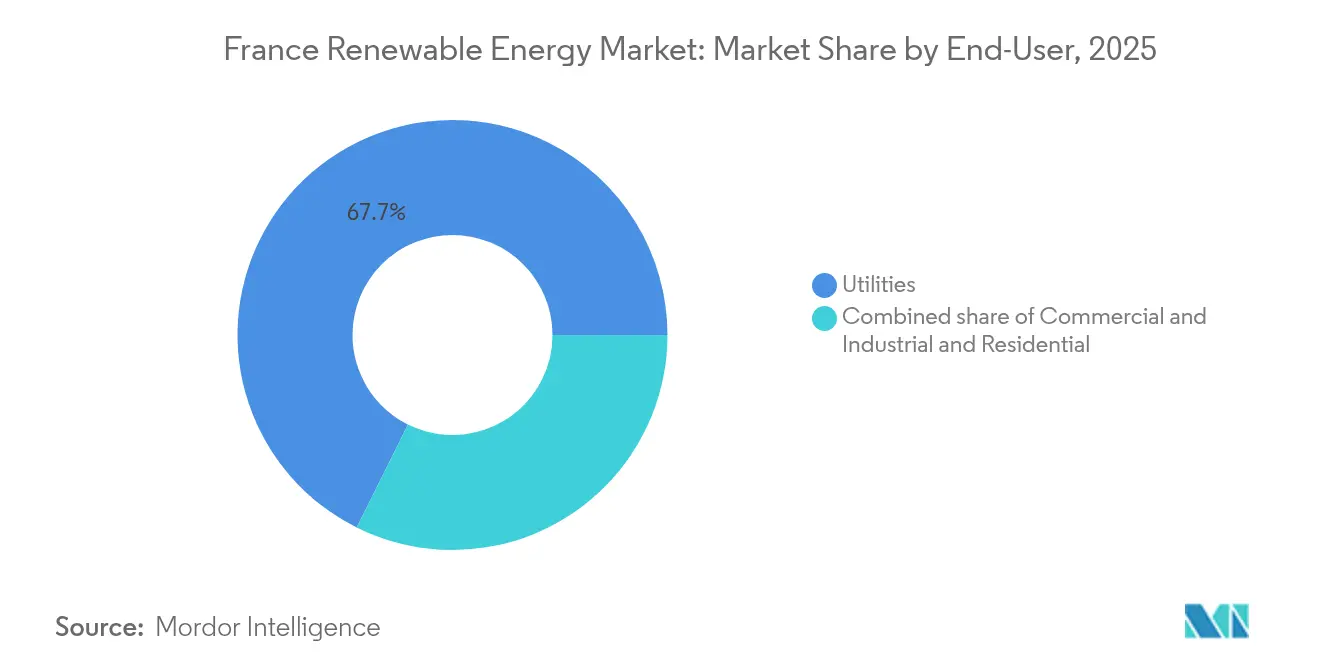
- By end-user, utilities accounted for 67.65% of the France renewable energy market size in 2025, whereas the commercial and industrial segment is advancing at a 15.25% CAGR between 2026 and 2031.
- EDF Renewables, TotalEnergies, Engie Green, Neoen, and Voltalia collectively controlled approximately 55% of the installed capacity in 2024.
Note: Market size and forecast figures in this report are generated using Mordor Intelligence’s proprietary estimation framework, updated with the latest available data and insights as of 2026.
France Renewable Energy Market Trends and Insights
Drivers Impact Analysis*
| Driver | (~) % Impact on CAGR Forecast | Geographic Relevance | Impact Timeline |
|---|---|---|---|
| EU Fit-for-55 & REPowerEU targets accelerate French RES uptake | 2.5% | National, with spillover to cross-border interconnectors | Long term (≥ 4 years) |
| Multi-year Energy Programme (PPE2) raises offshore wind auction pipeline | 1.8% | Atlantic coast (Brittany, Normandy), Mediterranean (Gulf of Lion) | Medium term (2-4 years) |
| Falling LCOE of solar-PV & onshore wind improves project IRR | 1.5% | National, concentrated in southern solar belt and northern wind corridor | Short term (≤ 2 years) |
| Corporate PPAs surge as CAC-40 firms decarbonize scopes 1-2 | 1.2% | National, with early gains in industrial clusters (Lyon, Lille, Marseille) | Short term (≤ 2 years) |
| Repowering ageing wind farms doubles yield without extra land | 0.8% | Northern and eastern regions with legacy turbine stock | Medium term (2-4 years) |
| Agrivoltaics law unlocks dual-land use in agri-regions | 0.6% | Southern viticulture zones, cereal plains in Centre-Val de Loire | Medium term (2-4 years) |
| Source: Mordor Intelligence | |||
EU Fit-for-55 And REPowerEU Targets Accelerate French RES Uptake
Brussels requires France to lift the renewable share of final energy consumption to 42.5% by 2030, up from 20.7% in 2024.[1]European Commission, “Fit for 55 Package,” europa.eu Recovery and Resilience Facility grants of EUR 5.4 billion support grid reinforcement, permitting digitalization, and storage pilots that ease integration. France’s updated National Energy and Climate Plan commits to 54-60 GW of solar and 33-35 GW of onshore wind by 2030, requiring a threefold increase in annual installation rates. Allowance prices above EUR 80 per ton under the EU ETS shift marginal economics decisively in favor of wind and solar, while renewable heat and transport mandates accelerate the injection of biomethane. Compliance checkpoints every two years create a hard back-stop that keeps policy pressure high and maintains investor confidence in the France renewable energy market.
Multi-year Energy Programme (PPE2) Raises Offshore Wind Auction Pipeline
The revised PPE2 schedules 17.2 GW of offshore wind capacity across four auction rounds, with strike prices in the 2024 AO7 round clearing at EUR 69 /MWh, 30% below earlier ceilings.[2]Commission de Régulation de l'Énergie, “AO7 Offshore Wind Tender Results,” cre.fr Atlantic fixed-bottom projects boast capacity factors exceeding 50%, while Mediterranean floating auctions are driving the development of local manufacturing hubs in Saint-Nazaire and Cherbourg. Local-content rules that require 40% nacelle value and 60% foundation fabrication within the EU are fostering supply-chain localization and job creation. Capital intensity of EUR 3 million per MW concentrates financing in syndicates led by BNP Paribas and Société Générale; however, the low merchant exposure after COD makes the assets attractive to pension funds seeking duration.
Falling LCOE of Solar-PV & Onshore Wind Improves Project IRR
Utility-scale solar LCOE slipped to EUR 40 /MWh in 2024 as bifacial efficiencies hit 22% and single-axis trackers lifted yields by 15%.[3]International Renewable Energy Agency, “Solar PV Cost Reductions,” irena.org Onshore wind costs declined to EUR 50/MWh as hub heights increased to 120 m. Inflation-indexed tariff clauses adopted in 2024 shield developers from cost spikes and enable 15-year debt at sub-4% interest rates, pushing project IRRs above 8%. The cost advantage over combined-cycle gas units, which face EUR 90/MWh marginal costs, has accelerated fuel switching, with EDF retiring the 600 MW Cordemais coal plant for a 1 GW solar-plus-storage replacement.
Corporate PPAs Surge As CAC-40 Firms Decarbonize Scopes 1-2
Corporate PPAs hit 1,842 GWh in 2024, a 50% YoY rise, as industrials hedge power prices and meet SBTi targets. TotalEnergies’ 1.5 TWh deal with STMicroelectronics was the largest on record, and Saint-Gobain secured 875 GWh from Engie wind farms. The Carbon Border Adjustment Mechanism will levy a phase-in from 2026, making renewable electricity a defensive cost play for exporters of steel, cement, and aluminum. Sleeved PPA structures enable corporates with distributed sites to purchase renewable attributes without direct connections, thereby broadening the addressable demand.
Restraints Impact Analysis*
| Restraint | (~) % Impact on CAGR Forecast | Geographic Relevance | Impact Timeline |
|---|---|---|---|
| Lengthy permitting & court appeals delay grid-connected RES | -1.5% | National, acute in rural communes with organized opposition | Long term (≥ 4 years) |
| Grid congestion in Brittany & PACA limits additional capacity | -1.2% | Brittany peninsula, Provence-Alpes-Côte d'Azur, isolated from backbone | Medium term (2-4 years) |
| Nuclear life-extension works squeeze skilled labour pool | -0.8% | National, concentrated near EDF nuclear sites (Flamanville, Gravelines) | Medium term (2-4 years) |
| Li-ion cell shortages constrain co-located storage roll-outs | -0.5% | National, affecting utility-scale solar and wind projects | Short term (≤ 2 years) |
| Source: Mordor Intelligence | |||
Lengthy Permitting & Court Appeals Delay Grid-Connected RES
Onshore wind projects average 7-9 years from feasibility to COD, with administrative steps consuming four years and court appeals adding up to three more. Setback distances of 500 m from residences curtail 60% of otherwise viable parcels, while radar rules near military airbases eliminate an additional 10%. Appeals overturned 15% of prefectural approvals in 2024, forcing developers to restart studies and eroding net present value. The burden falls hardest on small developers lacking in-house legal teams, tilting market power toward large utilities.
Grid Congestion In Brittany & PACA Limits Additional Capacity
RTE curtailed 8% of Brittany’s wind output in 2024 to prevent voltage instability as 225 kV lines hit 95% utilization.[4]RTE, “Brittany Grid Congestion Report,” rte-france.com PACA’s 4 GW solar fleet also suffers from negative pricing as export capacity to Lyon and Marseille reaches its maximum. A EUR 100 billion plan through 2040 involves adding 2,000 km of 400 kV lines and 15 GW of HVDC interconnectors to Spain and Italy. However, permitting delays stretch each new corridor to a decade, pushing developers toward lower-resource areas that still have grid headroom.
*Our forecasts treat driver/restraint impacts as directional, not additive. The impact forecasts reflect baseline growth, mix effects, and variable interactions.
Segment Analysis
By Technology: Solar Surges While Hydro Anchors Base
Solar added 2.8 GW in 2024 and is forecast to expand at a 18.55% CAGR through 2031, the strongest uplift in the France renewable energy market. Two drivers dominate: agrivoltaics, which open up dual land use on 500,000 hectares, and rooftop mandates on new commercial buildings exceeding 1,000 m². Hydropower retained 33.12% of installed capacity in 2025, providing indispensable pumped-storage flexibility even as environmental constraints cap greenfield development. Wind energy follows, buoyed by 3 GW of repowering and 17.2 GW of offshore auctions, while bioenergy pursues France’s 44 TWh biomethane target for 2030. Ocean and geothermal energy remain at the demonstration stage, adding, accounting for less than 1% combined capacity.
Solar’s momentum accelerates the France renewable energy market as bifacial modules reach 22% efficiency and tracker penetration deepens across Occitanie and Nouvelle-Aquitaine. Offshore wind contributes scale and diversity, with fixed-bottom Atlantic projects and floating Mediterranean farms capturing deep-water potential. Hydropower’s aging fleet receives targeted upgrades that add 2 GW of pumped storage by 2030 to integrate solar oversupply. Bioenergy growth hinges on digestate disposal regulations, and geothermal pilots in Alsace aim to achieve cost breakthroughs before scaling up.


By End-User: Utilities Dominate, Yet C&I Accelerates
Utilities controlled 67.65% of installed capacity in 2025, reflecting multi-gigawatt auction awards and their balance-sheet financing capability for high-capex offshore wind projects. The commercial and industrial segment registers the fastest growth, rising at a 15.25% CAGR as CAC-40 firms lock in PPAs to secure renewable supply and pre-empt carbon border levies. Residential rooftop PV grows steadily under net-metering, which pays EUR 100/MWh for surplus exports, although split-incentive issues in multi-family housing temper penetration.
Corporate PPAs, which surged 50% YoY in 2024, illustrate how industrial off-takers are reshaping power contracting. Utilities continue to dominate grid-connected assets, but independent producers such as Voltalia and Akuo Energy are carving out a share by aggregating sub-50 MW solar projects tailored to corporate tenants. Residential uptake benefits from collective self-consumption schemes introduced in 2024, yet remains constrained by upfront capital expenditures and roof size limitations.
Geography Analysis
Southern France, specifically Occitanie, PACA, and Nouvelle-Aquitaine, houses 64.45% of the country's solar capacity, thanks to its 1,800 sunshine hours annually and the 2024 agrivoltaics framework. Brittany and Normandy dominate fixed-bottom offshore wind, while the Gulf of Lion advances floating variants. Hauts-de-France and Grand Est lead onshore wind repowering, leveraging 120 m hub heights to tap 7 m/s winds. Île-de-France trails due to density and radar restrictions.
Grid congestion is acute along the Brittany peninsula, where 225 kV lines now curtail 8% of wind output. RTE's EUR 100 billion plan includes 2,000 km of 400 kV backbone and 15 GW of HVDC links to Spain and Italy, yet each corridor faces a decade-long permitting process. Offshore wind will depend on subsea cables routed to Normandy landing points before power heads go inland.
Local-content policies concentrate manufacturing in coastal hubs. Saint-Nazaire and Cherbourg are emerging turbine clusters employing 3,500 workers by 2027. However, these yards compete with EDF nuclear refits for welders and quality inspectors, prolonging installation schedules on Atlantic and Mediterranean projects.
Competitive Landscape
Market concentration is moderate. EDF Renewables, TotalEnergies, Engie Green, Neoen, and Voltalia together command 55% of capacity, while another 200 players share the remainder. Integrated utilities finance multi-gigawatt offshore projects with ten-year build cycles. Pure-play developers focus on 50-200 MW assets and often flip portfolios to infrastructure funds once operational.
Strategic differentiation appears in technology bets. EDF filed 12 patents in 2024 for floating wind substructures, while Sun'Agri advances agrivoltaic IP that elevates grape yields by 15%. Chinese inverter makers are winning the rooftop share by undercutting European rivals by 20% in price. Acquisition appetite is rising: RWE bought a 60 MW solar portfolio in 2024 to fast-track entry, and more cross-border deals are likely for assets with grid queues in place.
Equipment suppliers localize to meet EU content thresholds. Siemens Gamesa opened a Saint-Nazaire nacelle plant capable of 100 turbines per year, and GE Vernova is building a blade facility in Cherbourg. Such moves anchor supply chains and enhance bid competitiveness under PPE2 auctions.
France Renewable Energy Industry Leaders
EDF Renewables
TotalEnergies Renewables
Engie Green
Neoen SA
Voltalia SA
- *Disclaimer: Major Players sorted in no particular order

Recent Industry Developments
- June 2025: EDF Renewables fully commissioned the Provence Grand Large floating wind farm, proving commercial viability for floating foundations in Mediterranean conditions.
- June 2025: RWE inaugurated its first wind farm in Brittany, strengthening the company’s French portfolio. The wind farm boasts four turbines, collectively generating 14.7 megawatts. The Lannion-Trégor semi-public company played a pivotal role in co-developing the project.
- April 2025: Amarenco, an independent solar energy producer, clinched a EUR 188 million credit facility to bolster the construction of 500 new solar sites across France, encompassing both rooftop and ground-mounted systems. Caisse d'Epargne CEPAC, BPCE Lease, and Bpifrance jointly orchestrated the financing.
- November 2024: ENGIE announced 2.3 GW of new renewable energy capacity additions in the first nine months of 2024 and reaffirmed its full-year target of 4 GW. The company's strong performance in the first three quarters of 2024 positions it well to meet this goal.


France Renewable Energy Market Report Scope
Renewable energy is energy derived from natural sources that are replenished at a faster rate than they are consumed. Sunlight and wind, for example, are such sources that are constantly replenished.
The France Renewable Energy Market is segmented by Technology (Solar Energy (PV and CSP), Wind Energy (Onshore and Offshore), Hydropower (Small, Large, PSH), Bioenergy, Geothermal, Ocean Energy (Tidal and Wave)), By End-User (Utilities, Commercial and Industrial, Residential). For each segment, the market sizing and forecasts have been done based on installed capacity in gigawatts (GW).
By Technology
| Solar Energy (PV and CSP) |
| Wind Energy (Onshore and Offshore) |
| Hydropower (Small, Large, PSH) |
| Bioenergy |
| Geothermal |
| Ocean Energy (Tidal and Wave) |
By End-User
| Utilities |
| Commercial and Industrial |
| Residential |
| By Technology | Solar Energy (PV and CSP) |
| Wind Energy (Onshore and Offshore) | |
| Hydropower (Small, Large, PSH) | |
| Bioenergy | |
| Geothermal | |
| Ocean Energy (Tidal and Wave) | |
| By End-User | Utilities |
| Commercial and Industrial | |
| Residential |


Key Questions Answered in the Report
How large is the France renewable energy market in 2026?
The market totals 17.61 GW in 2026 and is forecast to reach 28.68 GW by 2031, reflecting a 10.25% CAGR.
Which technology is growing the fastest in France’s renewables mix?
Solar energy leads with a projected 18.55% CAGR between 2026 and 2031, supported by agrivoltaics and falling LCOE.
Why are corporate PPAs expanding rapidly in France?
Industrial buyers use PPAs to secure fixed power prices and meet decarbonization obligations ahead of the Carbon Border Adjustment Mechanism.
What is the main bottleneck to new onshore wind projects?
Lengthy permitting and legal appeals extend development cycles to 7-9 years, slowing capacity additions.
Which regions dominate offshore wind development?
Brittany and Normandy host most fixed-bottom projects, while the Gulf of Lion focuses on floating turbines.
How concentrated is the competitive landscape?
The top five players control about 55% of installed capacity, indicating a moderately concentrated market.
Page last updated on:


