Market Overview
| Study Period | 2021 - 2031 |
|---|---|
| Forecast Data Period | 2026 - 2031 |
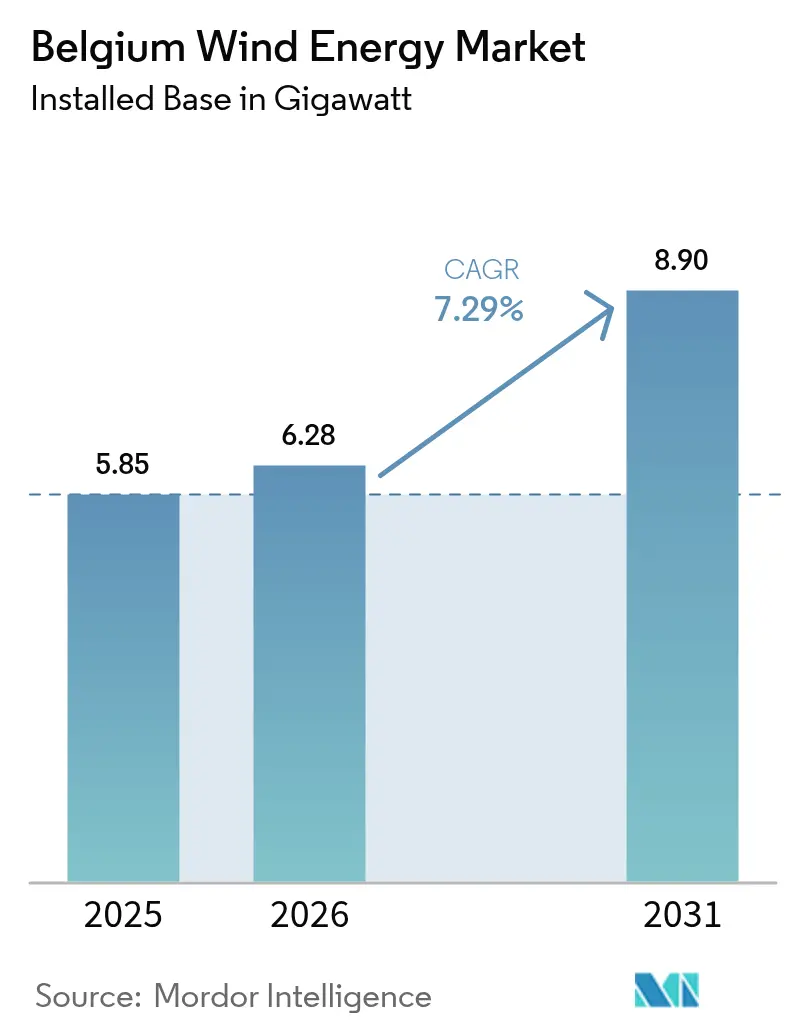
| Base Year Market Size (2025) | 5.85 gigawatt |
| Market Volume (2026) | 6.28 gigawatt |
| Market Volume (2031) | 8.9 gigawatt |
| Growth Rate (2026 - 2031) | 7.29% CAGR |
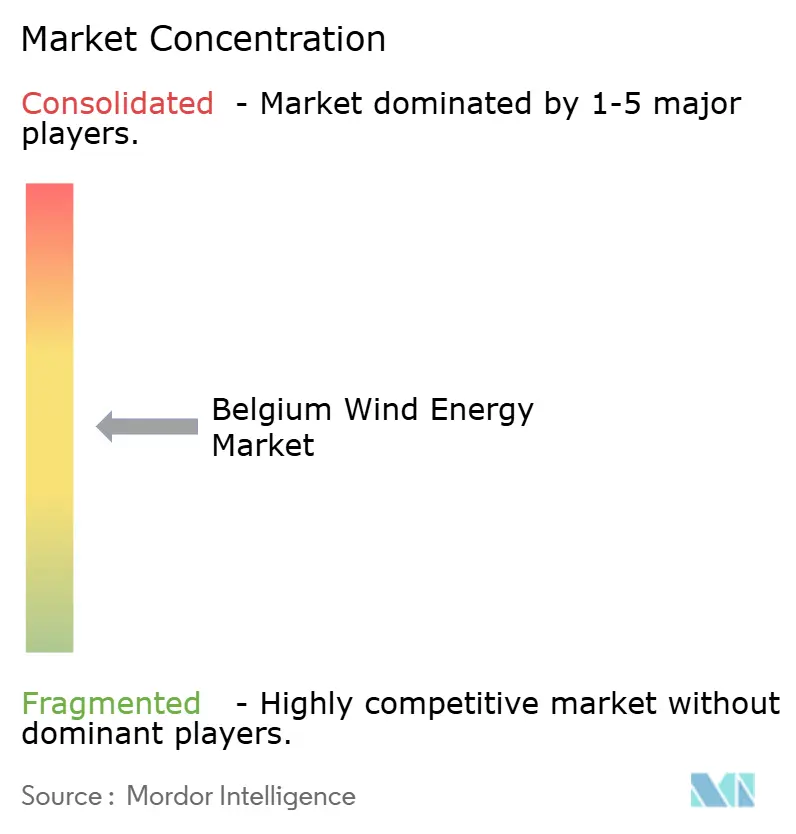
| Market Concentration | Medium |
Major Players *Disclaimer: Major Players sorted in no particular order Image © Mordor Intelligence. Reuse requires attribution under CC BY 4.0. | |
Belgium Wind Energy Market Analysis by Mordor Intelligence
The Belgium Wind Energy Market size is expected to grow from 5.85 gigawatt in 2025 to 6.28 gigawatt in 2026 and is forecast to reach 8.9 gigawatt by 2031 at 7.29% CAGR over 2026-2031.
Offshore build-out in the Princess Elisabeth Zone is the centerpiece of this expansion, supported by two-sided contracts-for-difference, EUR 682 million in approved state aid, and a forthcoming artificial energy island that consolidates grid connections.[1]European Commission, “State Aid: Commission Approves €682 Million Belgian Scheme to Support Offshore Wind Energy,” ec.europa.eu Cross-border interconnectors such as Nautilus and the planned LionLink allow surplus generation to reach premium U.K. and Dutch power markets, lifting project revenues during wind-abundant periods.[2]Ofgem, “Nautilus Interconnector Project Approval,” ofgem.gov.uk Industrial buyers in the Antwerp-Ghent petrochemical corridor are locking in multi-gigawatt-hour corporate PPAs that underpin investment decisions and reduce exposure to merchant price swings.[3]Borealis, “Corporate Power Purchase Agreements and Sustainability Initiatives,” borealisgroup.com Meanwhile, onshore repowering with 6 + MW turbines is doubling output at legacy sites and helping Belgium overcome land-use constraints in densely populated Flanders.
Key Report Takeaways
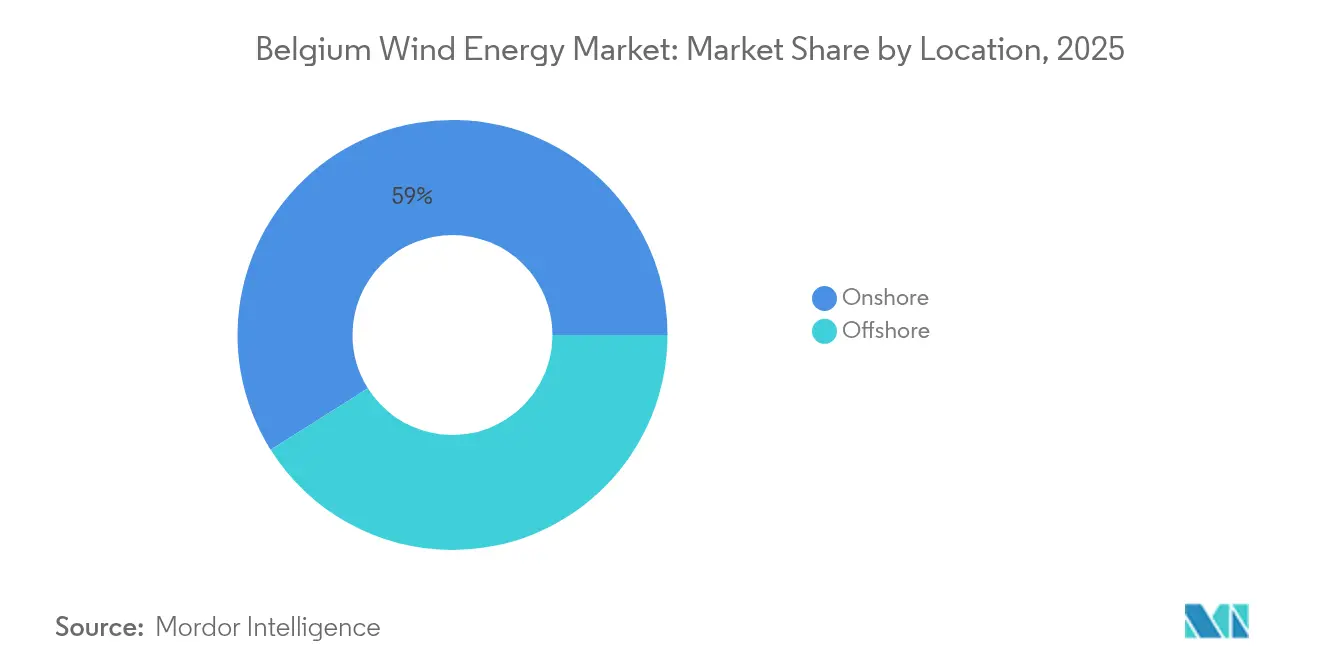
- By location, onshore installations held 58.95% of capacity in 2025, while offshore additions are forecast to post a 9.05% CAGR to 2031, reshaping the Belgium wind energy market.
- By turbine capacity, the 3 to 6 MW range led with 43.55% of the Belgium wind energy market share in 2025, whereas turbines above 6 MW are on track for a 15.17% CAGR through 2031.
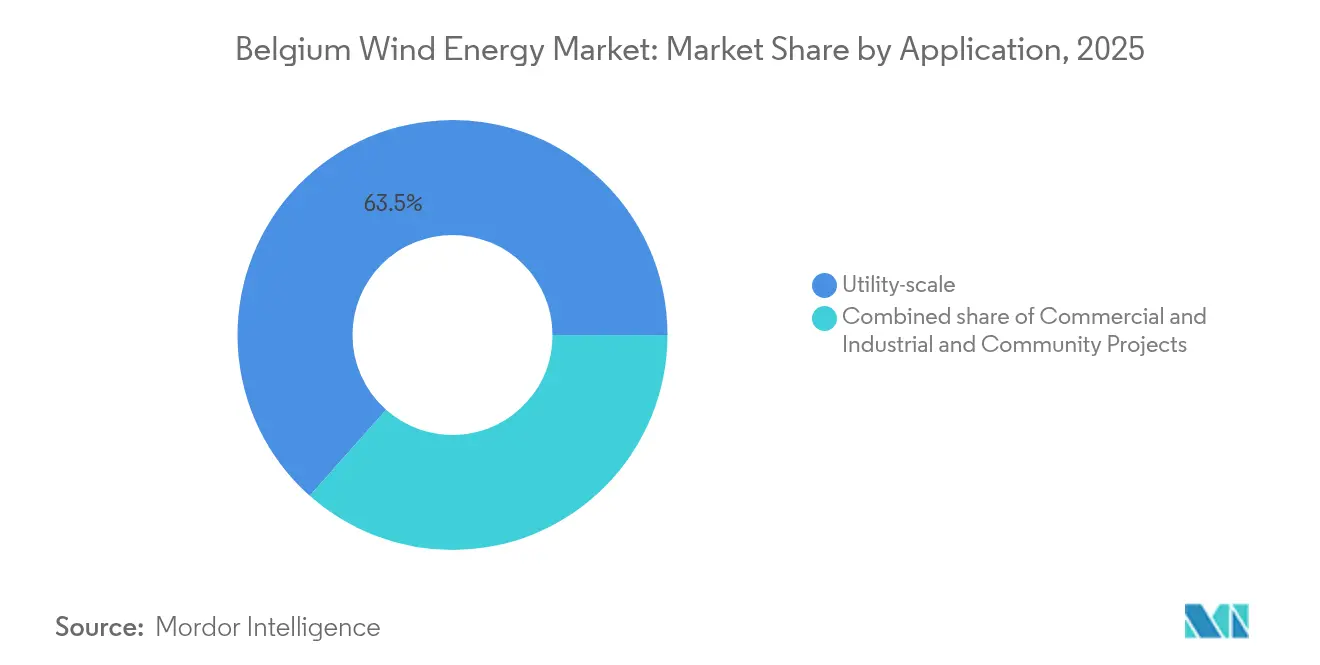
- By application, utility-scale assets represented 63.45% of the Belgium wind energy market size in 2025 and are slated to expand at a 9.55% CAGR over the outlook period.
Note: Market size and forecast figures in this report are generated using Mordor Intelligence’s proprietary estimation framework, updated with the latest available data and insights as of 2026.
Belgium Wind Energy Market Trends and Insights
Drivers Impact Analysis*
| Driver | (~) % Impact on CAGR Forecast | Geographic Relevance | Impact Timeline |
|---|---|---|---|
| EU 2030 & 2040 renewable-energy targets accelerate offshore build-out | 1.8% | National, with concentration in Belgian North Sea offshore zones | Medium term (2-4 years) |
| Belgium-UK Nautilus & LionLink interconnectors open new export revenue pools | 1.2% | National, with primary impact on Princess Elisabeth Zone offshore projects | Medium term (2-4 years) |
| Corporate PPAs from petro-chemical clusters in Flanders de-risk projects | 0.9% | Flanders, with concentration in Antwerp and Ghent industrial corridors | Short term (≤ 2 years) |
| Repowering of >20-yr onshore farms boosts MW additions | 0.8% | National, with acute concentration in Flanders and Wallonia legacy wind zones | Short term (≤ 2 years) |
| Green hydrogen demand at Port of Antwerp-Bruges creates extra offtake certainty | 1.1% | Flanders, with spillover to offshore wind developers supplying electrolysers | Medium term (2-4 years) |
| EU-funded North Sea Energy Island hubs lower LCOE post-2027 | 0.7% | Belgian North Sea, with benefits extending to all Princess Elisabeth Zone developers | Long term (≥ 4 years) |
| Source: Mordor Intelligence | |||
EU 2030 & 2040 Renewable-Energy Targets Accelerate Offshore Build-Out
Belgium must contribute to the EU mandate of sourcing 42.5% of final energy from renewables by 2030, positioning offshore wind as the fastest-scalable option in a country with limited land availability.[4]European Investment Bank, “Princess Elisabeth Island Financing and Offshore Wind Support,” eib.org The 3.5 GW Princess Elisabeth Zone secured environmental clearance in 2024 and will rely on an artificial energy island that aggregates substations, cutting per-megawatt transmission expense below EUR 50 per MWh after 2027, according to federal feasibility studies. A Constitutional Court ruling in October 2024 now allows turbines in agricultural areas if spatial criteria are met, unblocking stalled onshore repowering requests. New “go-to areas” legislation, currently under regional debate, promises 12-month permitting for pre-designated zones, though timelines vary between Flanders and Wallonia. Collectively, these policy tools compress development cycles and expand the addressable capacity pool of the Belgian wind energy market.
Belgium-UK Nautilus & LionLink Interconnectors Open New Export Revenue Pools
The 1.4 GW Nautilus high-voltage direct-current link will connect Princess Elisabeth Island to Suffolk, supplementing the 1.0 GW Nemo Link to create a 2.4 GW export corridor to the United Kingdom. Ofgem’s November 2024 approval shifted the landing point to minimize network constraint costs by over 50%. LionLink, a separate 1.8 GW route to the Netherlands, is in planning. These conduits let Belgian generators arbitrage day-ahead price spreads, improving project internal rates of return by up to two percentage points. Enhanced export optionality also eases local curtailment during windy, low-demand hours, reinforcing the economic case for larger offshore arrays in the Belgian wind energy market.
Corporate PPAs from Petro-Chemical Clusters in Flanders De-Risk Projects
Industrial decarbonization targets are spawning long-term PPAs that shield wind assets from merchant volatility. Borealis alone is committed to 900 GWh annually from the Vleemo farm starting 2026, abating 155,000 tCO₂e per year. INEOS and Aspiravi added layered contracts covering another 150 GWh. Fixed-price or floor-price structures align with lender requirements for predictable cash flow and enable balance-sheet financing over project-finance models. The Antwerp-Ghent corridor can absorb up to 2 GW of incremental capacity without stressing export links, smoothing revenue for near-shore onshore and offshore developers within the Belgian wind energy market.
Green Hydrogen Demand at Port of Antwerp-Bruges Creates Extra Offtake Certainty
Ørsted’s 1 GW SeaH2Land electrolyser links directly to 2 GW of offshore turbines, channeling hydrogen through a dedicated 45 km pipeline into Belgium and the Netherlands. Hyoffwind’s 25 MW unit will be Flanders’ first commercial electrolyser by 2026. Air Liquide’s ENHANCE plant gained a EUR 110 million EU grant to crack imported ammonia for hydrogen, lowering emissions by 300,000 t annually. A port-wide hydrogen backbone due in 2026 allows shared infrastructure and export flexibility. Co-location with wind landing points raises turbine capacity factors and diversifies revenue, undergirding the growth trajectory of the Belgian wind energy market.
Restraints Impact Analysis*
| Restraint | (~) % Impact on CAGR Forecast | Geographic Relevance | Impact Timeline |
|---|---|---|---|
| Grid congestion & curtailment risk in Flanders | -0.7% | Flanders, with acute pressure in West Flanders and Antwerp transmission corridors | Short term (≤ 2 years) |
| Protracted spatial-planning & permitting timelines | -0.5% | National, with longer delays in Flanders (2-3 years) versus Wallonia (1-2 years) | Medium term (2-4 years) |
| Limited Belgian monopile / cable-lay vessel capacity | -0.4% | Belgian North Sea, with supply-chain constraints affecting Princess Elisabeth Zone construction schedule | Medium term (2-4 years) |
| Escalating seabed-lease auction prices compress developer IRRs | -0.3% | Belgian North Sea, with primary impact on Princess Elisabeth Zone bidders | Medium term (2-4 years) |
| Source: Mordor Intelligence | |||
Grid Congestion & Curtailment Risk in Flanders
Elia’s network is nearing saturation as new solar and wind resources outpace grid upgrades, prompting curtailment warnings during windy spring and autumn shoulder seasons. The EUR 2.2 billion Ventilus corridor, delayed to 2028-2029, will eventually move 3.5 GW of offshore power inland but offers no near-term relief. Battery awards totaling 357 MW in 2024, including TotalEnergies’ 25 MW/75 MWh Antwerp system, are too small to absorb multigigawatt peaks. Until backbone reinforcements arrive, developers face lost revenue and lenders apply higher risk premiums, dampening growth prospects for the Belgian wind energy market.
Protracted Spatial-Planning & Permitting Timelines
Belgium’s split federal-regional regime prolongs approvals: Flanders averages 2-3 years for onshore files versus 1-2 years in Wallonia. Fragmented rules on noise, setback, and shadow flicker complicate repowering even at existing sites. Offshore projects must navigate military zones and conservation areas; a 2024 WWF study warned that Belgium may fall short of its 2040 wind goals without encroaching on protected waters. Delays inflate financing costs and postpone revenue streams, pressuring developer returns in the Belgian wind energy market.
*Our forecasts treat driver/restraint impacts as directional, not additive. The impact forecasts reflect baseline growth, mix effects, and variable interactions.
Segment Analysis
By Location: Offshore Surge Rebalances Legacy Onshore Dominance
The Belgian wind energy market size for offshore projects will reach 4.04 GW by 2031, narrowing the onshore share that stood at 58.95% in 2025. Higher 45-50% offshore capacity factors outperform the 25-30% typical onshore range, while the artificial energy island cuts grid-tie costs and supports 15+MW turbines such as the Siemens Gamesa SG 14-236 DD. Repowering remains the dominant onshore lever, as farms built before 2005 swap sub-2 MW machines for Vestas V172-7.2 MW units that triple output on existing pads. Offshore reliance also mitigates land-use conflicts in populous Flanders, though it introduces vessel and subsea-cable bottlenecks addressed by DEME and Jan De Nul fleet additions.
Rapid offshore growth alters revenue mix. Interconnectors route surplus energy to higher-priced U.K. and Dutch grids, moderating Belgian price cannibalization. Insurance costs for offshore assets remain higher, yet two-sided CFDs de-risk downside exposure. Onshore repowering enjoys shorter construction windows and leverages existing grid nodes, reducing capex per MW. Collectively, the dual-track expansion underpins national compliance with EU targets and solidifies long-term investor confidence in the Belgian wind energy market.


By Turbine Capacity: Above 6 MW Segment Captures Offshore and Repowering Growth
Turbines above 6 MW captured 15.17% CAGR in 2026-2031 forecasts as developers deploy Vestas V236-15.0 MW and Siemens Gamesa SG 14-236 DD platforms, each capable of 80 GWh annual output. The legacy 3-6 MW class still owned 43.55% of installed capacity in 2025, reflecting earlier offshore farms like Northwind and onshore arrays commissioned after 2012. Larger rotors lower the levelized cost of energy by up to 15% and cut foundation counts per GW, yielding lower maintenance overheads. On land, 6-8 MW machines such as Nordex N163/6.X maximize yield without triggering aviation restrictions.
The up-to-3 MW fleet is shrinking as owners dismantle aging machines nearing end-of-life. Scrap value of rare-earth magnets and tower steel offsets decommissioning costs, spurring faster replacement cycles. OEM competition intensifies: GE’s Haliade-X 14 MW platform vies in neighboring Dutch waters, pressuring price points for Belgian bids. Coupled with supportive CFDs, capacity-class migration accelerates cost parity with gas-fired generation, reinforcing the upgrade wave inside the Belgian wind energy market.
By Application: Utility-Scale Dominance Reflects Offshore and Repowering Pipeline
Utility-scale arrays accounted for 63.45% of capacity in 2025 and will advance at 9.55% CAGR through 2031, mirroring offshore pipeline momentum and large onshore repowering clusters exceeding 20 MW. The Lot 1 tender alone adds 700 MW under fixed-strike CFDs plus EUR 1 billion in European Investment Bank financing, highlighting the scale effect that drives low cost of capital. Commercial and industrial buyers increasingly pre-contract portions of these parks under sleeved PPAs, blending wholesale and bilateral revenue.
Community projects, mainly in Wallonia, occupy a 1-5 MW niche supported by municipal co-investment and regional feed-in tariffs but face financing ceilings due to limited balance-sheet strength. Elia’s capacity remuneration mechanism now permits wind-plus-storage hybrids, exemplified by TotalEnergies’ 25 MW/75 MWh battery colocated with Antwerp wind farms. As the EU’s Carbon Border Adjustment Mechanism bites after 2026, local manufacturers are expected to boost renewable sourcing, propelling industrial demand curves within the Belgian wind energy market.
Geography Analysis
Belgium’s North Sea shelf hosts all existing offshore arrays and will absorb the 3.5 GW Princess Elisabeth Zone, enabled by an EU-backed artificial island that slashes collector cabling costs and hosts converter stations for the Nautilus link. Capacity factors above 45% underpin competitive levelized costs and create surplus export headroom. Supply-chain tightness persists, yet domestic contractors DEME and Jan De Nul are expanding cable-laying fleets, with the 28,000-tonne payload Fleeming Jenkin vessel arriving in 2026.
Flanders remains Belgium’s onshore workhorse but confronts land scarcity and strict siting rules. Repowering older farms with 6+MW machines offers a growth vector without new footprints, helping the Belgian wind energy market maintain momentum despite spatial limits. The Antwerp-Ghent petrochemical belt anchors corporate PPAs exceeding 1,100 GWh per year since 2024, providing hedge revenue against volatile power prices. Grid bottlenecks, however, risk curtailment until the Ventilus high-voltage corridor comes online late-decade.
Wallonia, with more permissive setback and noise standards, processes onshore permits within 12-24 months and benefits from the EUR 1.3 billion Boucle du Hainaut reinforcement that connects southern renewables to the national backbone by 2030. Community cooperatives leverage regional feed-in tariffs to build small clusters, enriching local ownership while contributing incremental volume to the Belgian wind energy market. Though wind speeds are lower than coastal zones, more abundant land and faster approvals partially offset the resource gap, maintaining a balanced national rollout.
Competitive Landscape
Market concentration is moderate, led by a cohort of international developers and domestic consortia that dominate offshore concessions while onshore assets remain more fragmented. JERA-backed Parkwind controls stakes in legacy farms and is now eyeing French tenders, indicating diversification beyond its home base. Engie pledged EUR 4 billion for Belgian infrastructure by 2030 and is bidding in Princess Elisabeth Zone auctions, integrating renewable portfolios with its grid and hydrogen initiatives. Ørsted’s SeaH2Land project illustrates vertical integration, pairing 2 GW of wind with a 1 GW electrolyser to secure demand and enhance bankability.
Installation capacity is another arena of competition. DEME posted EUR 2 billion in 2024 offshore turnover after purchasing Havfram to lift heavy-lift capability, while Jan De Nul ordered two XL cable layers and booked contracts on Hornsea 3, Nordlicht, and Fengmiao projects, broadening revenue beyond Belgium. OEM rivalry centers on 15+MW machines: Vestas locked a conditional 1 GW framework in Northern Europe, and Siemens Gamesa is testing a 21 MW direct-drive prototype, each vying for Princess Elisabeth allocations.
Emerging niches include floating wind-solar hybrids under the SWiM pilot, backed by Energy Transition Fund grants, and green-ammonia cracking led by Air Liquide. Smaller domestic players such as Aspiravi expanded holdings by acquiring a 30% Northwind stake, signaling ongoing asset consolidation. Belgium’s two-sided CFD regime caps upside but guarantees floor prices, favoring balance-sheet-strong utilities and infrastructure funds and shaping cautious bidding behavior in the Belgian wind energy market.
Belgium Wind Energy Industry Leaders
Parkwind NV
Engie Electrabel SA
Otary RS NV
Eneco Wind Belgium / Northwind
Storm Management NV
- *Disclaimer: Major Players sorted in no particular order

Recent Industry Developments
- June 2025: Vestas secured multiple Belgian repowering orders for its V172-7.2 MW platform.
- January 2025: Jan De Nul won the cable scope for Germany’s Nordlicht 1 & 2 projects, extending its European pipeline.
- December 2024: Jan De Nul clinched France’s first floating wind cable contract, expanding into emerging segments.
- November 2024: Belgium opened the 700 MW Princess Elisabeth Zone Lot 1 tender with EUR 682 million state aid approval.
- November 2024: Ofgem cleared the 1.4 GW Nautilus interconnector linking Belgium and the U.K.
- October 2024: DEME won a EUR 150–300 million cable contract for OranjeWind in the Netherlands.


Belgium Wind Energy Market Report Scope
The wind energy market refers to using wind energy resources for electricity generation. Wind energy is harnessed by wind turbines that channel the power of the wind to produce electricity. A wind turbine consists of three blades: a rotor and a generator. The electricity generated by a wind turbine is fed into the grid for its consumption by an end-user.
The Belgian wind energy market is segmented by location of deployment, consisting of onshore and offshore deployment, Turbine Capacity covering up to 3 MW, 3 to 6 MW, and above 6 MW, application by Utility-scale, Commercial and Industrial, and Community Projects, and Component (Qualitative Analysis only).
By Location
| Onshore |
| Offshore |
By Turbine Capacity
| Up to 3 MW |
| 3 to 6 MW |
| Above 6 MW |
By Application
| Utility-scale |
| Commercial and Industrial |
| Community Projects |
By Component (Qualitative Analysis)
| Nacelle/Turbine |
| Blade |
| Tower |
| Generator and Gearbox |
| Balance-of-System |
| By Location | Onshore |
| Offshore | |
| By Turbine Capacity | Up to 3 MW |
| 3 to 6 MW | |
| Above 6 MW | |
| By Application | Utility-scale |
| Commercial and Industrial | |
| Community Projects | |
| By Component (Qualitative Analysis) | Nacelle/Turbine |
| Blade | |
| Tower | |
| Generator and Gearbox | |
| Balance-of-System |


Key Questions Answered in the Report
What is Belgium's installed wind capacity today and how large will it be by 2031?
Capacity reached 6.28 GW in 2026 and is forecast to rise to 8.9 GW by 2031, implying a 7.29% CAGR.
Which single initiative contributes most to future offshore build-out?
The 3.5 GW Princess Elisabeth Zone, supported by two-sided CFDs and an artificial energy island, drives the bulk of new offshore additions.
How are corporate power purchase agreements influencing new projects?
Petro-chemical buyers in the Antwerp-Ghent corridor have locked in more than 1,100 GWh of annual PPAs since 2024, giving developers bankable long-term revenue.
What grid upgrade is critical to avoiding curtailment of new wind farms?
Elia's EUR 2.2 billion Ventilus high-voltage corridor, scheduled for 2028-2029, will move 3.5 GW of offshore power inland and ease congestion in Flanders.
Which turbine size class is gaining the fastest share in Belgium?
Machines rated above 6 MW, led by Vestas V236-15 MW and Siemens Gamesa SG 14-236 DD, are growing at a 15.17% CAGR through 2031.
Who are the key players shaping competitive dynamics?
International developers such as Ørsted, Engie, Parkwind-JERA, and contractors DEME and Jan De Nul dominate current and upcoming offshore concessions.
Page last updated on:


