
Fog Networking Market Size and Share
Market Overview
| Study Period | 2020 - 2031 |
|---|---|
| Market Size (2026) | USD 1.08 Billion |
| Market Size (2031) | USD 2.77 Billion |
| Growth Rate (2026 - 2031) | 20.78 % |
| Fastest Growing Market | Middle East |
| Largest Market | North America |
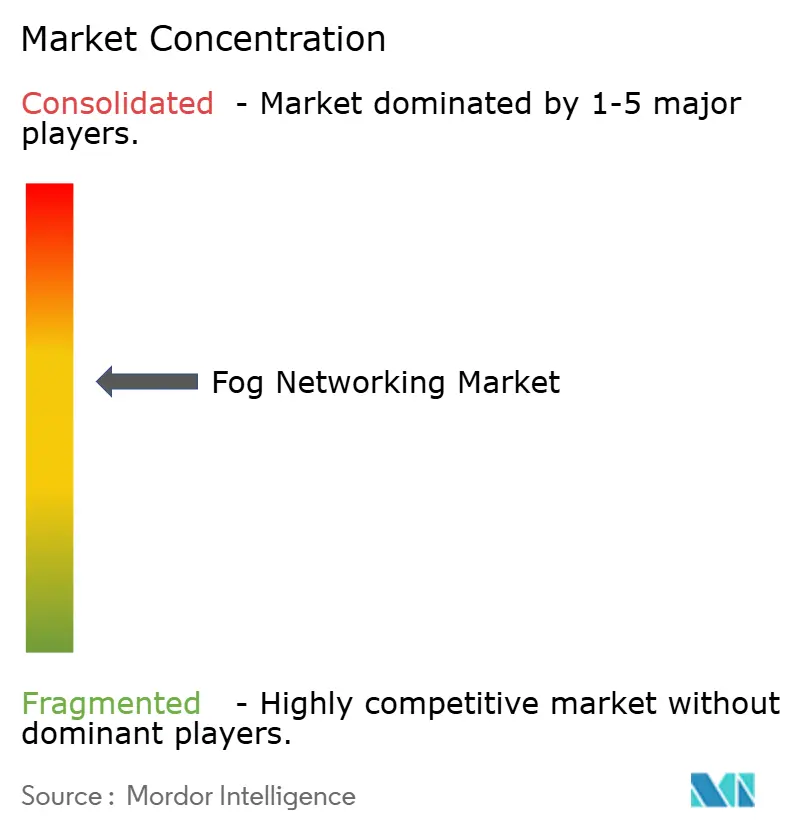
| Market Concentration | Medium |
Major Players *Disclaimer: Major Players sorted in no particular order Image © Mordor Intelligence. Reuse requires attribution under CC BY 4.0. | |
Fog Networking Market Analysis by Mordor Intelligence
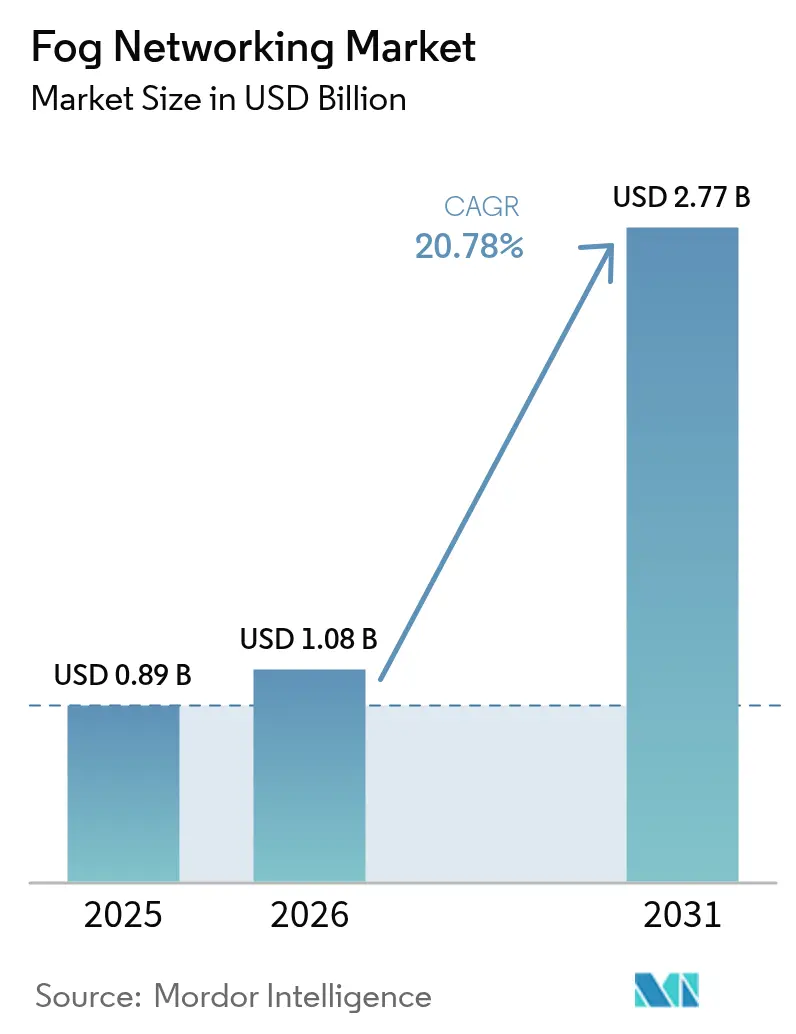
The fog networking market size was valued at USD 0.89 billion in 2025 and estimated to grow from USD 1.08 billion in 2026 to reach USD 2.77 billion by 2031, at a CAGR of 20.78% during the forecast period (2026-2031). Hardware gateways and edge servers currently anchor most deployments, while software-defined orchestration and security layers gain traction as enterprises seek real-time data processing close to devices. Rapid 5G and Wi-Fi 7 rollouts, falling IoT sensor prices, and stricter data-sovereignty mandates reinforce the business case for localized computing. Vendors continue integrating artificial-intelligence accelerators into micro-data-center form factors, enabling low-latency analytics for autonomous vehicles, precision manufacturing, and critical health monitoring. Although security complexity and fragmented orchestration stacks temper near-term uptake, sustained investment in edge connectivity and national digital-transformation programs underpins long-term expansion of the fog networking market
Key Report Takeaways
- By component, hardware held 57.30% of the fog networking market share in 2025, while software and services are set to expand at a 26.1% CAGR through 2031.
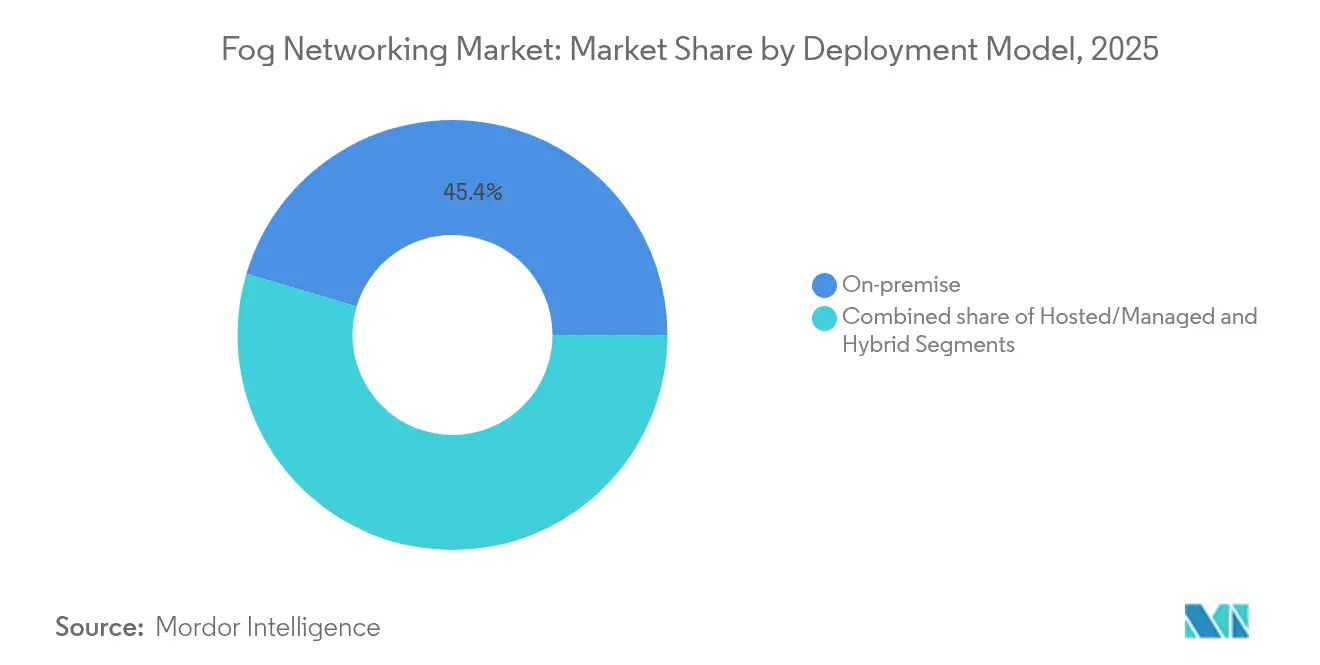
- By deployment model, on-premises implementations led with 45.40% of the fog networking market size in 2025; hosted services exhibit the fastest growth at 25.2% CAGR to 2031.
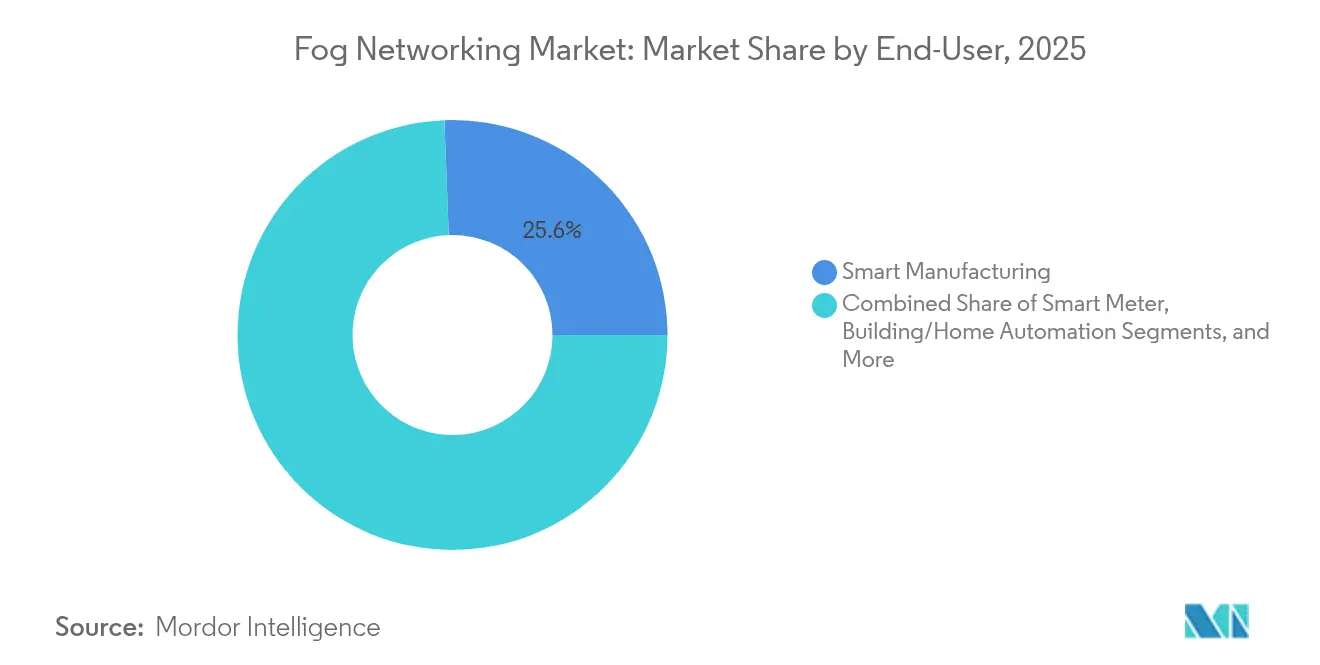
- By end-user application, smart manufacturing captured 25.60% revenue share in 2025, whereas connected-vehicle solutions are poised for a 27.8% CAGR over the same period.
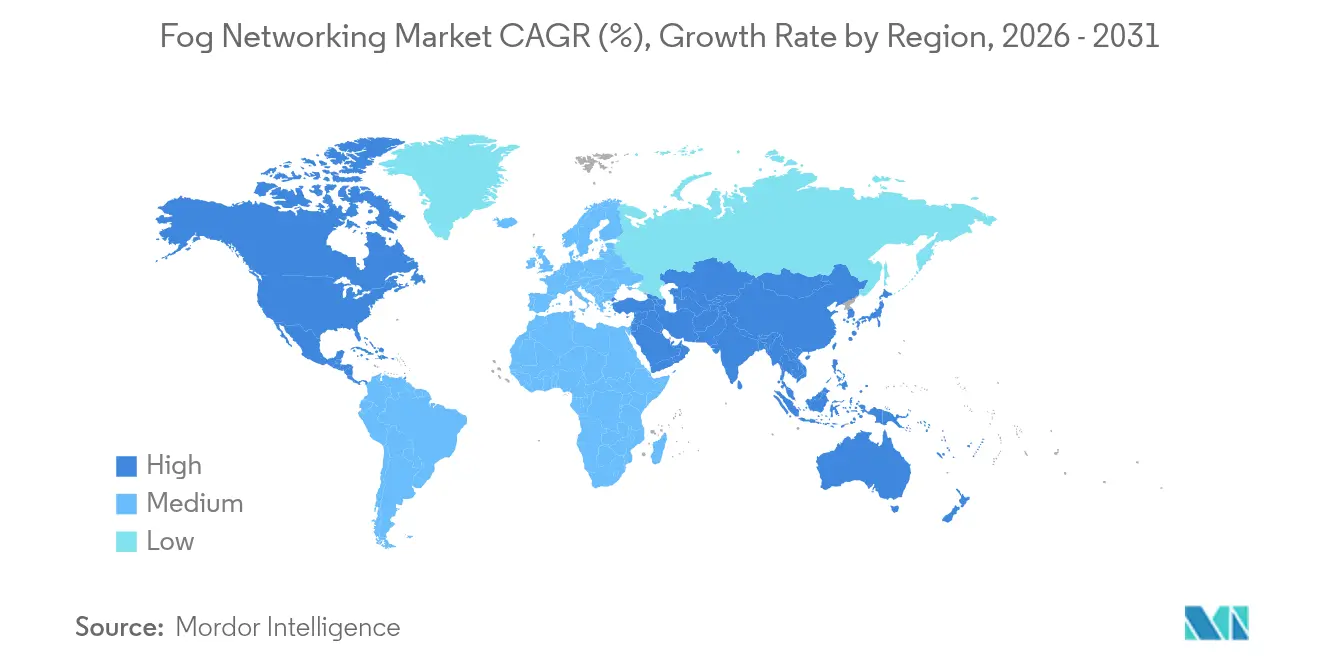
- By geography, North America commanded 36.60% of the fog networking market size in 2025; the Middle East is projected to be the quickest-growing region at 26.3% CAGR.
Note: Market size and forecast figures in this report are generated using Mordor Intelligence’s proprietary estimation framework, updated with the latest available data and insights as of 2026.
Market Trends and Insights
Drivers Impact Analysis of Fog Networking Market*
| Driver | % Impact on CAGR Forecast | Geographic Relevance | Impact Timeline |
|---|---|---|---|
| Expanding real-time analytics demand | 4.2% | Global, with concentration in North America & EU | Medium term (2-4 years) |
| Proliferation of low-cost IoT sensors | 3.8% | APAC core, spill-over to MEA | Short term (≤ 2 years) |
| 5G & Wi-Fi 7 densification | 3.5% | Global, led by developed markets | Medium term (2-4 years) |
| OpenFog/ETSI MEC standard adoption | 2.9% | EU & North America, expanding to APAC | Long term (≥ 4 years) |
| Edge AI accelerator shipments surge | 4.1% | Global, with early adoption in tech hubs | Short term (≤ 2 years) |
| National data-sovereignty mandates | 3.3% | EU, China, India with regulatory spillover | Long term (≥ 4 years) |
| Source: Mordor Intelligence | |||
Expanding Real-Time Analytics Demand
Manufacturing organizations deploy fog gateways to run predictive-maintenance models that must respond in less than 10 milliseconds. A Mercedes-Benz plant recorded 82.88% accuracy in forecasting vehicle-test times by applying embedded machine learning at the production edge. Hospitals that shift telemedicine workloads from cloud to on-site fog nodes have cut latency from 100 milliseconds to 5 milliseconds and reduced the attack surface by 35%. Similar latency gains underpin automated warehouse robotics, traffic-signal optimization, and advanced driver-assistance systems. The economic incentive extends beyond speed: energy-efficiency studies show 25-30% lower power use versus centralized processing, reinforcing capital-spending justification.
Proliferation of Low-Cost IoT Sensors
Industrial-grade sensors priced below USD 5 now enable continuous asset monitoring across shop floors and city infrastructure. The Industrial Internet Consortium stresses cost-effective sensor integration as a primary edge-computing catalyst. NIST’s IoT Advisory Board likewise classifies distributed architectures as essential for national critical-infrastructure resilience NIST. Cheap sensors feed real-time optimization loops for smart grids, building-energy management, and leakage detection, elevating demand for local analytics capacity embedded in fog nodes.
5G & Wi-Fi 7 Densification
Private 5G deployments deliver deterministic latency below 1 millisecond, a prerequisite for time-sensitive industrial control. Ericsson’s collaboration with Bell Canada illustrates AI-native link adaptation that places inference directly in edge hardware. Neutral-host network investment is expected to top USD 8.7 billion by 2028, broadening indoor coverage for factories and hospitals. Wi-Fi 7 upgrades complement 5G, delivering 5 GHz-plus throughputs inside logistics hubs and retail stores where fog servers orchestrate high-fidelity video analytics.
Edge AI Accelerator Shipments Surge
Shipments of on-device AI processors are projected to reach 8.7 billion units by 2030, unlocking USD 102.9 billion in semiconductor revenue. ARM’s AI Readiness Index finds 82% of enterprises already piloting edge inference workloads, chiefly in customer service and document automation. Qualcomm, MediaTek, and STMicroelectronics now integrate transformer-model support within microcontrollers, enabling language translation, anomaly detection, and visual inspection directly on fog gateways.
Restraints Impact Analysis of Fog Networking Market*
| Restraint | % Impact on CAGR Forecast | Geographic Relevance | Impact Timeline |
|---|---|---|---|
| Security attack-surface complexity | -2.8% | Global, particularly in regulated industries | Short term (≤ 2 years) |
| Fragmented orchestration stacks | -2.1% | North America & EU enterprise markets | Medium term (2-4 years) |
| CAPEX burden on brownfield OT sites | -1.9% | Industrial markets globally | Long term (≥ 4 years) |
| Limited fog talent pool | -1.7% | Global, acute in emerging markets | Long term (≥ 4 years) |
| Source: Mordor Intelligence | |||
Security Attack-Surface Complexity
Every distributed node introduces new vulnerabilities that healthcare and manufacturing operators must secure in line with HIPAA and GDPR provisions. The European Defence Agency’s CLAUDIA project addresses tactical-edge security frameworks, yet incident-response remains fragmented. In operational-technology environments, breaches risk physical safety, compelling investment in zero-trust architectures and runtime-integrity monitoring across fog clusters.
Fragmented Orchestration Stacks
Heterogeneous APIs and management tools inflate integration cost and lock enterprises into single-vendor ecosystems. The Alliance for Internet of Things Innovation lists orchestration fragmentation as a top standardization gap. Although ETSI MEC and OpenFog reference designs advance, most multi-supplier deployments still require bespoke connectors, extending roll-out timelines and complicating lifecycle upgrades.
*Our forecasts treat driver/restraint impacts as directional, not additive. The impact forecasts reflect baseline growth, mix effects, and variable interactions.
Fog Networking Market Segment Analysis
By Deployment Model:
On-Premises Dominance Meets Hosted GrowthOn-premisess nodes accounted for 45.40% of the 2025 fog networking market share, mirroring strict data-localization mandates in healthcare, finance, and defense. Industries valuing deterministic latency and regulatory control keep compute assets within secured facilities or even inside production lines. Siemens and Microsoft’s hybrid architecture combineson-premiseses Industrial Edge runtimes with Azure-based analytics, underscoring demand for flexible oversight.
Hosted fog-as-a-service grows fastest at 25.2% CAGR as managed-service providers bundle lifecycle support, threat-monitoring, and capacity right-sizing. Smaller manufacturers and retailers lacking in-house IT benefit most, accessing advanced AI without purchasing or operating specialized hardware. The fog networking market size for hosted services is projected to triple between 2026 and 2031 as telcos and hyperscale clouds extend service catalogues to field-level computing.



By End-User Application:
Manufacturing Leadership with Automotive AccelerationSmart factories retained 25.60% of 2025 revenue, deploying localized analytics for predictive-maintenance alarms, machine-vision-based quality checks, and dynamic scheduling. The fog networking market size for manufacturing is on course to exceed USD 1.03 billion by 2031, stimulated by rising adoption of time-sensitive networking and OPC UA over 5G backbones. Automotive OEMs embrace fog clusters embedded in roadway infrastructure to support vehicle-to-everything interactions. Connected-vehicle workloads now register the highest 27.8% CAGR; fog servers positioned near intersections aggregate camera and lidar feeds to generate real-time safety messages.
Health-care providers deploy bedside fog gateways for medical-device telemetry and AI-supported diagnostics, off-loading noncritical data to cloud archives only after initial triage. Utilities leverage substation-level compute to balance load and detect anomalous consumption in milliseconds, avoiding network congestion during peak periods.
By Component:
Hardware Foundations Drive Initial DeploymentsHardware commanded 57.30% of 2025 revenue within the fog networking market, reflecting heavy spending on gateways, micro-data-center racks, and ruggedized IoT chipsets that anchor first-wave installations. The fog networking market size for hardware equaled USD 0.51 billion that year. Edge servers equipped with GPU or ASIC accelerators execute sub-second video-analytics workloads on factory inspection lines, trimming cloud-egress cost and safeguarding proprietary designs. Advantech’s 2024 catalog highlights integrated AI modules that streamline application rollout across medical imaging, automated warehousing, and renewable-energy control.
Software and services expand at a 26.1% CAGR to 2031 as organizations pivot toward subscription models encompassing orchestration, security, and data-lifecycle management. Fog networking industry vendors increasingly emphasize container-based runtimes and policy-driven automation to minimize on-site maintenance. SaaS-style visibility portals allow plant engineers to update inferencing pipelines remotely, accelerating time-to-value while shifting expenditure from CAPEX to OPEX.
Geography Analysis
North America Fog Networking Market
North America led with 36.60% of 2025 revenue, propelled by enterprise digitization budgets, mature 5G coverage, and supportive regulatory clarity. United States start-up ecosystems host 203 edge-computing firms that raised USD 11.1 billion to date Tracxn. Canada’s smaller yet vibrant cluster recorded USD 214 million in funding despite a 2024 pullback.
Europe Fog Networking Market
Europe follows, shaped by GDPR and the Digital Markets Act that stress data sovereignty. Parliament debates on communications-infrastructure dependence reinforce investment in indigenous fog stacks Europarl. The continent’s industrial pedigree underpins adoption in automotive and heavy machinery; EU-funded pilots show far-edge compute nodes doubling installed-base growth from 2021 to 2027.
Middle East and APAC Fog Networking Market
The Middle East posts a 26.3% CAGR as smart-city megaprojects in Saudi Arabia and the UAE deploy thousands of roadside sensors and surveillance cameras requiring sub-second analytics. National AI strategies privilege sovereign data processing, catalysing regional data-center and fog-gateway rollouts Across APAC, China’s industrial-IoT policy, Japan’s robotics leadership, and India’s 5G expansion foster sizeable demand. Lower installation labour costs further improve return on investment, accelerating adoption across tier-2 manufacturing hubs.

Regulatory Landscape
Fog networking deployments are shaped by cross-border privacy, cybersecurity, and data-residency rules that often push regulated end users, such as healthcare and critical infrastructure, toward localized processing. Compliance obligations typically map to frameworks such as GDPR in Europe and sector rules such as HIPAA in the United States, supporting on-premises and in-country hosted fog patterns when sensitive telemetry and video analytics are processed near connected devices.
Interoperability and network-compute coordination are also influenced by standards and reference architectures used in procurement. IEEE Std 1934-2018 (adoption of the OpenFog Reference Architecture) is a key reference for horizontal, interoperable fog systems. On the telecommunications side, ITU-T advanced convergence-oriented specifications, including Recommendation Y.3225 (December 2025) on coordination of networking and computing and Recommendation Q.3065 (January 2026) on SRv6-based service function chaining signaling and data models, support multi-domain orchestration for distributed fog and edge infrastructure.
Value Chain Analysis
The fog networking value chain starts upstream with silicon and embedded components, including IoT chipsets, accelerators, and NICs, and extends to hardware OEMs producing fog gateways, rugged edge servers, and micro-data-center appliances. Platform and middleware vendors then supply virtualization or container runtimes, orchestration, observability, and security layers that manage fleets of distributed nodes, while hyperscale clouds and network-equipment vendors extend control planes from cloud and WAN domains into customer premises.
Downstream, telecom operators, managed service providers, and system integrators design, deploy, and operate fog stacks for industrial, smart city, healthcare, and connected-vehicle use cases. Application developers and OT/IT teams then maintain models and workflows at the edge. Interoperability and multi-vendor integration remain core execution points across the chain, with IEEE 1934-2018 and OpenFog-derived architectural principles used to reduce lock-in and align fog-to-cloud and fog-to-fog interfaces for low-latency east-west and north-south traffic flows.
Competitive Landscape
Competition spans hyperscale clouds, network-equipment vendors, semiconductor suppliers, and niche software specialists. Microsoft, AWS, and Google natively extend orchestration policies from their clouds to customer premises, offering unified dashboards that streamline DevSecOps management. Cisco, Nokia, and Juniper anchor connectivity layers, bundling secure access-service edge (SASE) functions with fog-optimized switches and routers.
Acquisitions center on AI acceleration and security. Cisco added SnapAttack, Robust Intelligence, and Deeper Insights AI to strengthen threat detection and model assurance across distributed nodes. AMD’s USD 4.9 billion purchase of ZT Systems boosts its end-to-end server platform for data-center and edge AI workloads. Venture capital still fuels innovation: 451 start-ups worldwide have attracted USD 14.2 billion, focusing on ultra-compact servers, zero-trust mesh, and domain-specific silicon. Market success increasingly hinges on delivering vertically integrated stacks that collapse latency, simplify orchestration, and secure heterogeneous assets.
Fog Networking Industry Leaders
Cisco Systems
Amazon Web Services
Dell Technologies
Microsoft
IBM
- *Disclaimer: Major Players sorted in no particular order
Fog Networking Market Companies Covered in this Report
- Amazon Web Services
- Cisco Systems
- Dell Technologies
- IBM
- Intel
- Microsoft
- Nebbiolo Technologies
- Nokia
- Qualcomm
- Tata Consultancy Services
- Advantech
- HPE
- Huawei
- Arm
- Schneider Electric
- Bosch .IO
- GE Digital
- Saguna Networks
- ClearBlade
- FogHorn (Google)
- EdgeIQ
- Vapor IO
- Fastly
- Equinix Metal

Market Opportunities and Future Outlook
Near-device processing for industrial and critical workloads creates whitespace around orchestration, security, and resource efficiency at scale, particularly when enterprises need to keep data local while still operating hybrid cloud control planes. Standards-based interoperability offers a practical route for multi-supplier deployments, with IEEE Std 1934-2018 continuing to function as a horizontal architecture anchor, and ITU-T work on networking-compute coordination (Y.3225, December 2025) aligning with converged fixed-mobile-satellite environments where fog nodes sit inside access networks and enterprise sites.
Technical results also point to operational improvements that translate into product opportunities in fog scheduling and privacy-preserving analytics toolchains for IIoT. In 2026, peer-reviewed research reported energy-efficiency and scheduling gains in fog task placement, including a Frontiers study citing a 7.26% energy-efficiency improvement and a 9.32% reduction in makespan in an IIoT fog setting, and it proposed privacy-aware hierarchical fog frameworks for IIoT communications. These findings support differentiation in fog management platforms, including workload placement, power-aware orchestration for micro-data-centers, and built-in privacy controls for regulated telemetry and machine-vision streams.
Recent Industry Developments in Fog Networking Market
- June 2026: Cisco announced Cisco Multicloud Fabric at Cisco Live 2026, targeting consistent networking and operations across AWS, Microsoft Azure, and Google Cloud. The release supports unified policy and connectivity for hybrid edge and fog-style deployments where applications span cloud control planes and distributed on-premises nodes.
- March 2026: Dell introduced the PowerEdge XR9700 rugged edge server, positioned for harsh environments in industrial sites and telecom networks. The product expansion supports fog networking needs for low-latency compute close to sensors, with hardware designed for remote and space-constrained deployments.
- August 2024: AMD announced its USD 4.9 billion acquisition of ZT Systems to deepen its server platform capabilities for data-center and edge AI systems. The acquisition supports tighter integration across silicon, systems, and deployment-ready infrastructure used in micro-data-center and edge-server footprints that underpin fog architectures.


Fog Networking Market Report Scope and Research Methodology
Market Definition and Coverage
For this study, the fog networking market is defined as revenue earned from products and services that place compute, storage, and analytics closer to connected devices, so latency and bandwidth load can be reduced before data reaches the cloud.
Scope exclusions: Consumer Wi-Fi range extenders and purely cloud-native edge software that does not run on or manage near-device nodes are excluded.
Segments Covered in This Report
- By Component (Value, USD)
- Hardware
- Fog gateways
- Edge servers and micro-DCs
- IoT chipsets and accelerators
- Software and Services
- Fog management platform
- Security and orchestration
- Hardware
- By Deployment Model (Value, USD)
- On-premise
- Hosted/Managed
- Hybrid
- By End-user Application (Value, USD)
- Smart Metering
- Building and Home Automation
- Smart Manufacturing
- Connected Healthcare
- Connected Vehicle
- Others (Oil and Gas, Retail, etc.)
- By Geography (Value, USD)
- North America
- United States
- Canada
- Mexico
- South America
- Brazil
- Argentina
- Rest of South America
- Europe
- United Kingdom
- Germany
- France
- Italy
- Rest of Europe
- Asia-Pacific
- China
- Japan
- India
- South Korea
- Rest of Asia-Pacific
- Middle East
- Israel
- Saudi Arabia
- United Arab Emirates
- Turkey
- Rest of Middle East
- Africa
- South Africa
- Egypt
- Rest of Africa
- North America
Data Sources, Market Sizing, and Validation
Desk Research
Desk research was used to build the basic market map and to anchor adoption signals to sources that can be rechecked. We relied on public and official materials such as NIST publications on edge and IoT concepts, FCC spectrum and connectivity references, OECD digital economy datasets, and ITU indicators on telecom infrastructure, along with IEEE and ACM papers that clarify fog architectures and latency needs.
We also reviewed company filings, product documentation, investor presentations, and reputable press to understand how vendors describe fog gateways, orchestration, and managed services, and how pricing is usually structured (subscription, license, or bundled hardware). Where needed, paid subscriptions for company financials and intelligence, patent databases, and a global contracts and tenders feed were used to confirm who is selling what and where deployments are being announced. The sources listed here are illustrative, since many more were checked to collect data, validate assumptions, and clarify open questions.
Primary Interviews and Surveys
Primary work focused on interviews and short surveys with stakeholders across fog platform development, systems integration, telecom and cloud connectivity, and end users running latency-sensitive IoT workloads. We tested assumptions around deployment pace, typical spending splits between hardware and software, and how managed fog services are being contracted, with coverage across APAC, EMEA, and the Americas.
Distribution of primary research fieldwork respondents
| Company type | Respondent position | Region |
|---|---|---|
| Top tier: 29% | CXOs: 21% | APAC: 44% |
| Mid tier: 50% | Functional/Unit leaders: 34% | EMEA: 34% |
| Smaller Players: 21% | Managers: 45% | Americas: 22% |
Market-Sizing & Forecasting
Sizing starts with a top-down build where the demand pool is reconstructed from edge and IoT deployment intensity, and then filtered into fog-eligible spend based on where low latency processing and local control are required. We then corroborate the totals with selective bottom-up approximations, such as sampled pricing for gateways and orchestration software, channel checks with integrators, and supplier revenue cues that can be tied back to fog workloads.
The model uses a practical set of inputs that can be defended on a client call, including the installed base growth of connected devices, the share of workloads requiring sub-second response, enterprise edge infrastructure spending trends, telecom backhaul capacity constraints, and the mix shift toward managed services in distributed IT. Because some disclosures are limited, gaps are handled by using ranges from interviews and then narrowing them using cross-checks against procurement language and product positioning.
For forecasting, we apply multivariate regression with scenario checks, where the drivers are projected using public connectivity indicators and the adoption curves validated by experts. When the output drifts from real-world signals, the assumptions are adjusted first, and only then are the final totals locked.
Data Validation & Update Cycle
Validation is done through several checks so the numbers do not depend on one single assumption. Our team compares the model outputs against independent signals like edge infrastructure spending direction, IoT endpoint growth, and the pace of new low-latency use cases being rolled out, and then variance checks are run at region level before sign-off.
If a gap shows up, analysts re-check the inputs, revisit the conversion steps, and re-contact a few respondents when a material mismatch cannot be explained from public information. Reports are refreshed annually, and interim updates are triggered when major technology shifts, regulatory changes, or large deployment announcements can meaningfully move near-term demand. Before delivery, a final pass is completed so clients receive the most current view available at that time.
Mordor Intelligence's Fog Networking Market Sizing Compared With Other Published Estimates
Published market sizes for fog networking can vary a lot, even when they use similar words for the topic. The differences usually come from how the scope is drawn, which revenue lines are counted, and how quickly assumptions are refreshed when edge computing adoption moves.
By tracking latency-driven workload eligibility and refreshing the scope boundaries each update, Mordor Intelligence keeps the fog networking total tied to fog node hardware, orchestration software, and managed fog services, instead of blending in adjacent edge categories that inflate totals.
Benchmark comparison
| Source | Market Size | Gaps in Research Methodology |
|---|---|---|
| Mordor Intelligence | USD 0.89 B (2025) | |
| Regional Consultancy A | USD 0.41 B (2025) | This estimate appears to stay closer to a narrower platform view, with less inclusion of managed fog services and fewer cross-checks on enterprise spending splits, which can pull the 2025 total down. |
| Global Consultancy B | USD 1.02 B (2022) | The value is anchored to an earlier year and is often presented with a different forecast window, so currency timing and older adoption assumptions can reduce comparability to a 2025 market model. |
The spread mainly comes from what is counted as fog-specific revenue and how the time base is handled. When scope is consistently limited to near-device fog nodes and the related software layer, and when assumptions are revalidated with fresh deployment and spending signals, the resulting market size stays easier to explain and replicate.


Key Questions Answered in the Report
What is the current valuation of the fog networking market?
The fog networking market is worth USD 1.08 billion in 2026 and is projected to hit USD 2.77 billion by 2031.
Which segment grows fastest in the fog networking market?
Software and services lead growth with a 26.1% CAGR through 2031, reflecting rising demand for orchestration and security platforms.
Why are smart-manufacturing firms' early adopters of fog networking?
Factories depend on sub-millisecond analytics for predictive maintenance and quality inspection that centralized clouds cannot deliver within required latency budgets.
How does 5G advance fog-networking deployments?
Private 5G networks ensure deterministic latency, dedicated bandwidth, and robust security, enabling industrial and automotive edge applications.
What are the chief barriers to wider fog-networking adoption?
Security-attack-surface complexity, fragmented orchestration tools, and capital-spending hurdles at brownfield sites remain the primary obstacles.
Which region is expected to record the highest growth rate?
The Middle East leads with a 26.3% CAGR through 2031 as smart-city initiatives and sovereign-AI strategies accelerate edge-infrastructure roll-out.
Page last updated on:





