Fluoropolymer Market Size and Share
Market Overview
| Study Period | 2020 - 2031 |
|---|---|
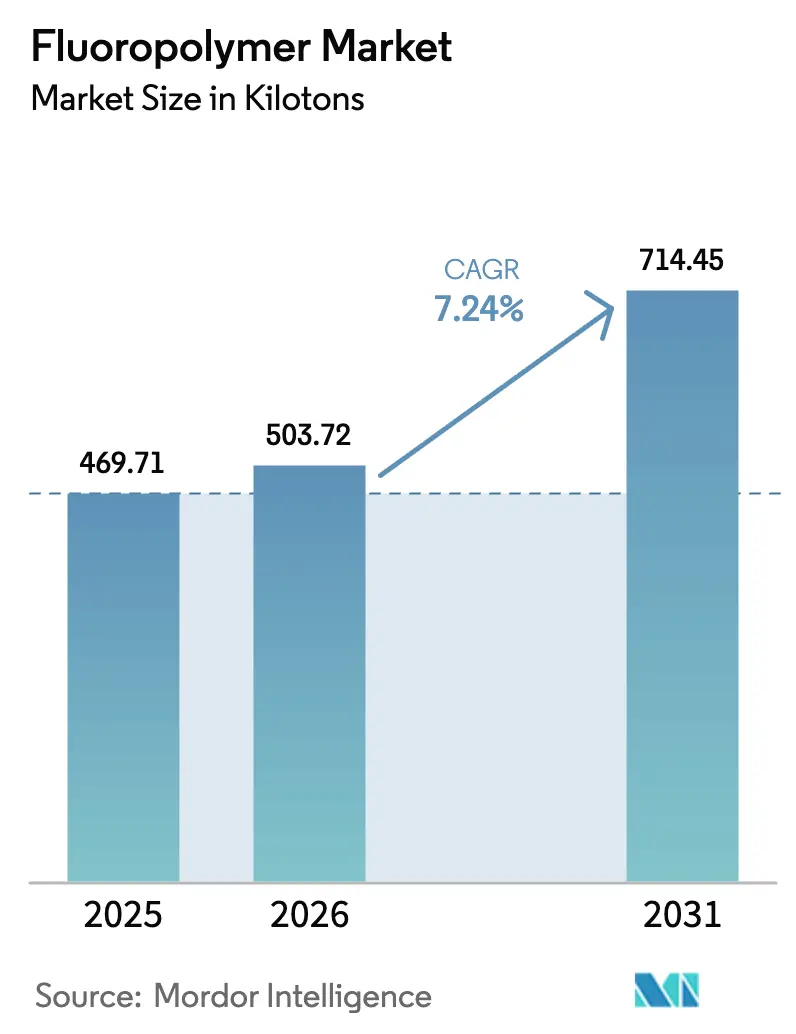
| Market Volume (2026) | 503.72 kilotons |
| Market Volume (2031) | 714.45 kilotons |
| Growth Rate (2026 - 2031) | 7.24% CAGR |
| Fastest Growing Market | Asia Pacific |
| Largest Market | Asia Pacific |
| Market Concentration | Medium |
Major Players *Disclaimer: Major Players sorted in no particular order Image © Mordor Intelligence. Reuse requires attribution under CC BY 4.0. | |
Fluoropolymer Market Analysis by Mordor Intelligence
The Fluoropolymer market size is expected to grow from 469.71 kilotons in 2025 to 503.72 kilotons in 2026 and is forecast to reach 714.45 kilotons by 2031 at 7.24% CAGR over 2026-2031. Sustained gains stem from electric-vehicle wire insulation, Asia-Pacific semiconductor fab expansion, and low-VOC coating mandates that favor fluoropolymer chemistries. Price resilience is linked to unmatched chemical inertness, thermal stability, and dielectric strength that extend service life and reduce maintenance costs for critical assets. Leading suppliers are deepening their vertical integration into fluorspar mining and downstream compounding to mitigate raw-material volatility. Process intensification and advances in membrane durability broaden the adoption of green-hydrogen projects. Collectively, these drivers reinforce multi-industry reliance, shielding the fluoropolymer market from cyclical downturns.
Key Report Takeaways
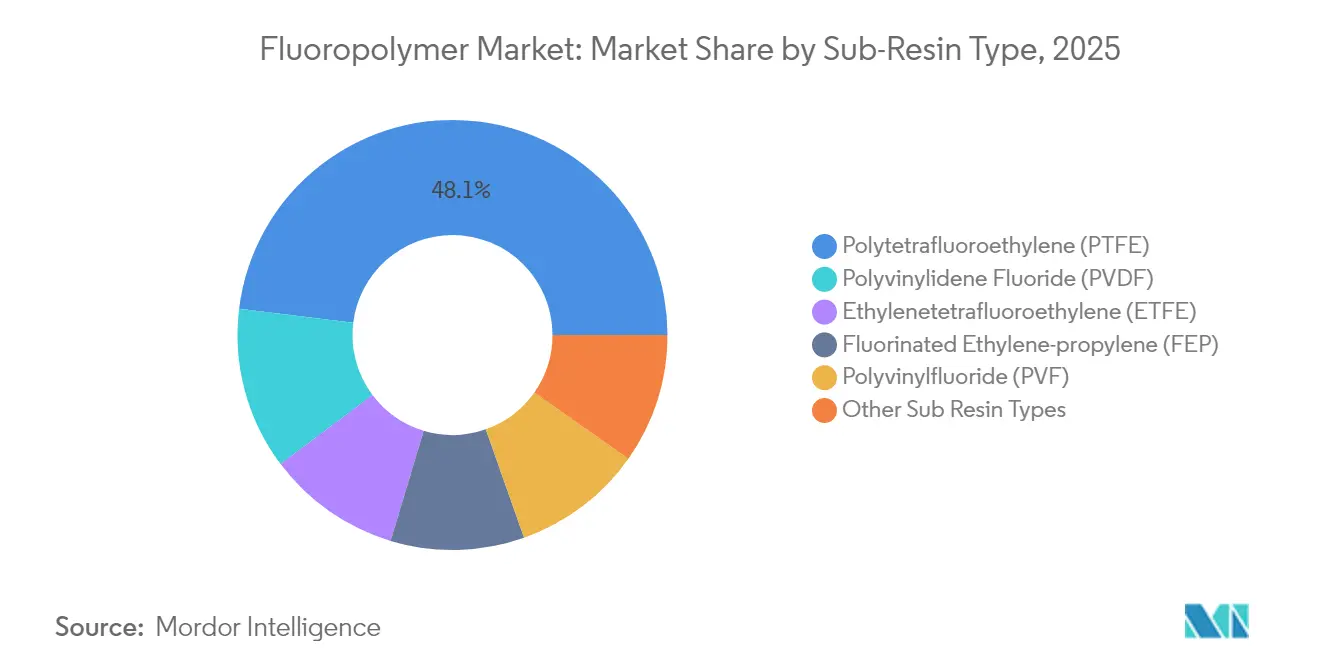
- By sub-resin type, PTFE led with a 48.05% revenue share in 2025; PVDF is expected to expand at an 17.1% CAGR through 2031.
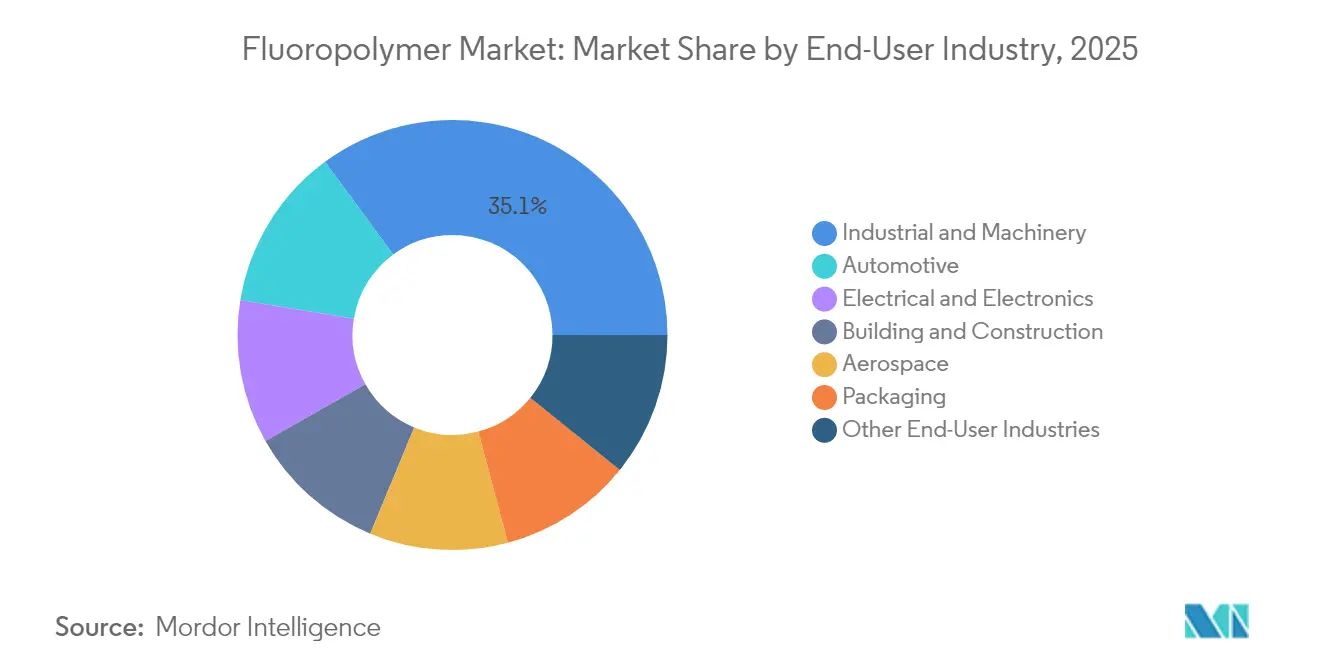
- By end-user industry, industrial and machinery applications held 35.10% of the Fluoropolymer market share in 2025, while automotive applications are projected to advance at a 13.88% CAGR through 2031.
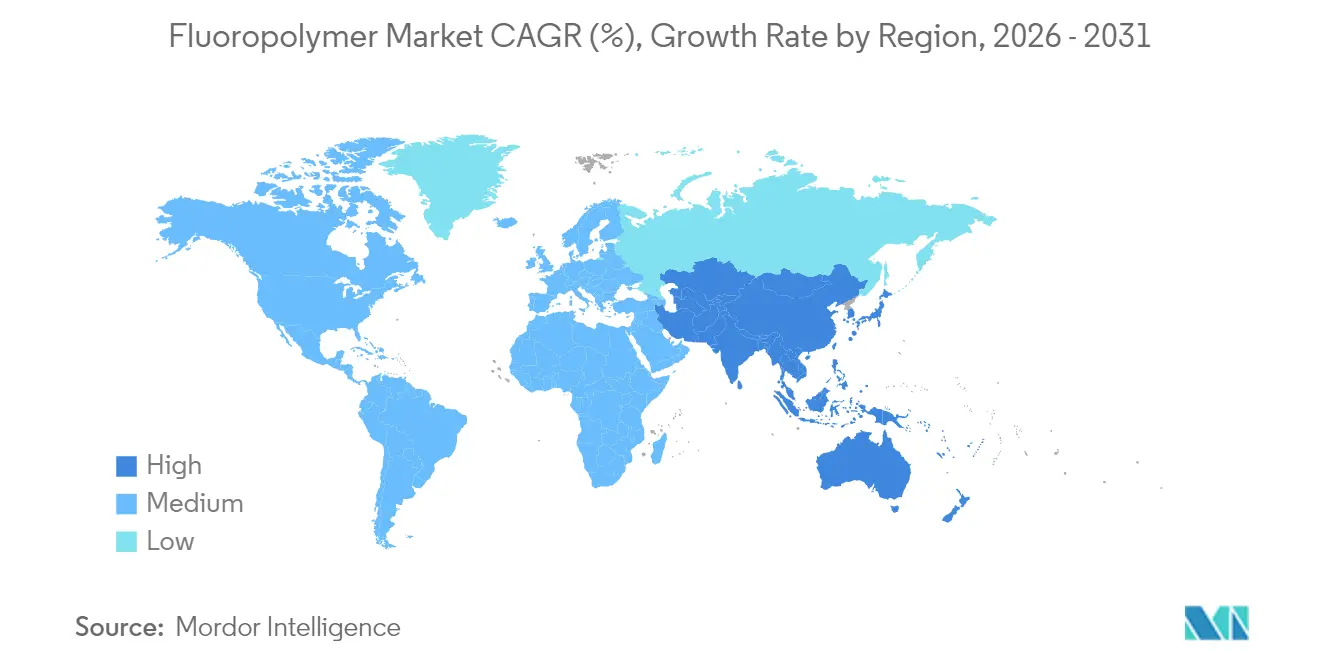
- By geography, the Asia-Pacific region accounted for 53.92% of the Fluoropolymer market size in 2025 and is forecast to post the fastest regional growth at an 8.34% CAGR through 2031.
Note: Market size and forecast figures in this report are generated using Mordor Intelligence’s proprietary estimation framework, updated with the latest available data and insights as of 2026.
Global Fluoropolymer Market Trends and Insights
Drivers Impact Analysis*
| Driver | (~) % Impact on CAGR Forecast | Geographic Relevance | Impact Timeline |
|---|---|---|---|
| Surge in demand for high-performance wiring in EVs | +2.1% | Global, with concentration in China, US, Europe | Medium term (2-4 years) |
| Growing adoption of PVDF as Li-ion battery binder | +1.8% | Asia-Pacific core, spill-over to North America | Short term (≤ 2 years) |
| Expansion of semiconductor fab capacity in Asia | +1.5% | APAC core, particularly Taiwan, South Korea, China | Long term (≥ 4 years) |
| Stringent low-VOC coating regulations | +1.2% | North America & EU, expanding to APAC | Medium term (2-4 years) |
| Green-hydrogen electrolysis membranes (PVDF, FEP) | +1.1% | Europe, Japan, Australia, with early gains in Germany, Netherlands | Long term (≥ 4 years) |
| Source: Mordor Intelligence | |||


Surge in demand for high-performance wiring in EVs
Electric vehicles rely on cable insulation that withstands 800 V architectures, −40°C to 150°C thermal cycles, and electrolyte splash. PVDF and ETFE meet these stress profiles while maintaining flame retardancy that satisfies global OEM safety tests. Premium models such as Tesla Model S Plaid and Lucid Air Dream Edition specify fluoropolymer-insulated harnesses to secure continuous high-power operation under track conditions[1]American Chemistry Council, “PFAS: Critical to America’s Air Travel,” americanchemistry.com. Growth in 48 V mild-hybrid commercial vehicles broadens the addressable volume, and wire-and-cable compounders pre-qualify grades to shorten validation timelines for new EV platforms. Suppliers able to provide color-stable, irradiation-crosslinkable insulation grades gain specification wins as automakers compress development cycles. Continuous copper price pressure also pushes designers toward thinner-wall insulation, favoring high-dielectric-strength fluoropolymers.
Growing adoption of PVDF as Li-ion battery binder
PVDF replaced legacy binders by offering an electrochemical stability window to 4.6 V, enabling higher-nickel cathodes that lift pack energy density. Separator coatings and electrolyte additives extend PVDF’s battery role and multiply revenue per kilowatt-hour. Chinese cell makers pair local PVDF resin with domestic lithium carbonate, minimizing import dependency and shortening lead times. Alternative water-based binders struggle with adhesion at high-temperature curing, keeping PVDF entrenched despite ongoing research and development in polyacrylic and biomaterial systems. As global gigafactory capacity surpasses 3 TWh by 2030, incremental binder demand alone sustains double-digit growth for PVDF suppliers. Producers investing in upstream VDF monomer capacity lock in feedstock and defend margins against raw-material price swings.
Expansion of semiconductor fab capacity in Asia
Semiconductor manufacturing's reliance on ultra-high purity fluoropolymers creates sustained demand growth as the Asia-Pacific region adds fabrication capacity. Any trace metal or organic extractables in chemical-delivery tubing can scrap entire wafer lots valued in millions. Therefore, replacement cycles for acid lines, drain hoses, and vacuum seals become annuity streams for resin producers. EUV lithography intensifies process chemical aggressiveness, requiring seals and o-rings molded from perfluoroelastomers rather than conventional fluoro-rubbers. Localizing component machining within China, Taiwan, and South Korea shortens maintenance downtime and encourages regional compounding hubs. These dynamics reinforce Asia-Pacific dominance in the Fluoropolymer market through the forecast horizon.
Stringent low-VOC coating regulations
The US EPA National Emission Standards cap VOC content, steering architects toward waterborne fluoropolymer topcoats that achieve 25-year façade durability without solvent odor[2]U.S. Environmental Protection Agency, “NESHAP Surface Coating Rules,” epa.gov. California’s South Coast AQMD imposes even tighter limits, causing coating formulators to swap out high-solids acrylics for FEVE and PVDF dispersions. European REACH assessments keep pressure on aromatic solvents, accelerating dispersion adoption in curtain-wall panels and coil coatings across Germany and France. Green-building certification schemes, such as LEED, credit low-emission materials, making fluoropolymer coatings a straightforward pathway for developers to meet indoor-air-quality targets.
Restraints Impact Analysis*
| Restraint | (~) % Impact on CAGR Forecast | Geographic Relevance | Impact Timeline |
|---|---|---|---|
| PFAS regulatory scrutiny in US/EU | -1.4% | North America & EU, with spillover effects globally | Medium term (2-4 years) |
| High fluorspar costs and limited supply | -0.9% | Global, with acute impact in regions distant from China | Short term (≤ 2 years) |
| Raw-material price volatility | -0.8% | Global, with manufacturing concentration in Asia-Pacific | Short term (≤ 2 years) |
| Source: Mordor Intelligence | |||
PFAS regulatory scrutiny in the US/EU
Broad PFAS proposals under EU REACH list more than 10,000 substances, covering fluoropolymers except where critical-use derogations apply. Uncertainty stalls expansion projects as investors weigh compliance costs against future cash flow. California’s phased ban on certain food-contact articles illustrates how localized actions cascade through global supply chains, forcing OEMs to redesign. Semiconductor end-users lobby for exemptions, warning that wafer defect risk rises sharply without ultra-clean fluoropolymer tubing. Companies that proactively certify grades for low-extractable fluorinated additives improve their odds of securing derogations.
High fluorspar costs and limited supply
China controls majority of mined fluorspar and has tightened environmental permits, driving price spikes that ripple through HF and fluoropolymer chains. Mexico and Mongolia represent alternative sources, yet new mines require multi-year development, leaving near-term supply tight. Integrated producers with captive mining assets pass increases downstream with minimal erosion of EBITDA, while merchant compounders experience margin squeeze. Several buyers lock in multi-year offtake agreements at escalator clauses to stabilize the cost of goods.the
*Our forecasts treat driver/restraint impacts as directional, not additive. The impact forecasts reflect baseline growth, mix effects, and variable interactions.
Segment Analysis
By Sub-Resin Type: PTFE maintains leadership while PVDF surges
The PTFE category retained a 48.05% market share in the fluoropolymer market in 2025, driven by applications such as chemical-processing gaskets, aerospace seals, and semiconductor wafer carriers. The fluoropolymer market size for PTFE is expected to reach approximately 333.6 kilotons by 2031, driven by new demand for PFA-lined heat exchangers.
PVDF, by contrast, recorded an 17.1% CAGR and will cross 120 kilotons by 2031, fueled by lithium-ion cathode binders and proton-exchange membranes. China and South Korea account for 70% of incremental PVDF capacity announcements, aligning resin availability with the growth of battery gigafactory clusters. ETFE gains momentum in architectural roof membranes and 200°C EV wire jackets. FEP growth tracks semiconductor wet-bench upgrades given its ultra-low extractables profile. Smaller niches for PFA, ECTFE, and PVF persist where FDA 21 CFR compliance or photovoltaic backsheet durability is non-negotiable.


By End-User Industry: Industrial machinery anchors baseline demand
Industrial and machinery applications accounted for 35.10% of the fluoropolymer market size in 2025, with pump housings, valve seats, and process liners driving repeat demand. Reliability-centric procurements continue to prioritize PTFE-based composites despite higher upfront cost.
Automotive demand rose swiftly, at a 13.88% CAGR, as EV penetration accelerated. High-voltage cable insulation and battery module films are poised to propel the segment to a share of over 20% by 2031. Lightweight PVDF coatings and ETFE wire harnesses replace PVC to shave vehicle mass, supporting range targets. Electronics end-uses absorb growing resin volumes through 5G coax cables and advanced IC packaging. Building and construction uptake strengthens with low-VOC PVDF façades, while aerospace volumes rebound alongside the ramp-up of narrow-body production. Packaging retains niche but essential roles in medical vials and aggressive-chemical containers where barrier integrity is paramount.
Geography Analysis
The Asia-Pacific region owned 53.92% of the Fluoropolymer market in 2025 and is projected to grow at an 8.34% CAGR through 2031. China commands a significant portion of domestic resin capacity and dominates lithium-ion battery production, thereby ensuring a secure PVDF supply for local cathode manufacturers. Taiwan and South Korea invest heavily in sub-7 nm wafer fabrication, consuming ultra-pure PFA tubing and PTFE bellows to guard against contamination. India scales up EV manufacturing and chemical-processing projects that require corrosion-resistant fluoropolymer lining materials. Government incentives in Japan support the deployment of PEM electrolyzers, further boosting demand for PVDF and FEP membranes.
North America exhibits steady consumption in aerospace, defense, and specialty chemicals, where performance outweighs cost. The US also enforces strict VOC caps, prompting substitution toward waterborne PVDF coatings in architectural panels. Mexico’s growing vehicle assembly output increases purchases of fluoropolymer tubing for battery coolant loops, and Canadian mining operations specify PTFE linings for acid-leach circuits. Overall growth is modest compared with Asia but underpinned by higher per-unit value applications that bolster margins.
Europe maintains focus on sustainability and regulatory compliance. The EU Green Deal catalyzes investment in green-hydrogen plants that require fluoropolymer membranes, while German OEMs ramp EV component lines that consume PVDF binder and cable insulation. Yet the proposed PFAS restriction under REACH injects uncertainty, delaying some capacity expansions until derogation clarity emerges. Critical-use exemptions for aerospace, medical, and semiconductor fields sustain premium-grade demand. South America, the Middle-East, and Africa register emerging growth as petrochemical and mining sectors modernize equipment with corrosion-proof linings, albeit from a smaller base, keeping their influence on the total Fluoropolymer market size moderate during the forecast.

Competitive Landscape
The fluoropolymer Market is moderately consolidated. Strategic alliances are common. Producers experiment with pyrolysis-based PTFE recycling and bio-based monomer routes to answer sustainability queries and differentiate in contract negotiations. Disruptive entrants focus on additive-manufacturing powder grades and niche 3D-printing filaments where traditional incumbents possess limited channel reach. Intellectual property around suspension-polymerization and high-purity sintering remains a strong moat, slowing commoditization despite regulatory headwinds. Supply-chain vulnerabilities favor integrated players. Those controlling fluorspar mines and HF capacity hedge against feedstock price spikes, while processors dependent on merchant HF face cost volatility and occasional allocation cuts. Skilled labor capable of handling corrosive intermediates and maintaining sinter-belt furnaces also remains scarce, reinforcing barriers for new entrants. Altogether, technology depth, raw-material security, and regulatory compliance shape a competitive field where scale and specialization outweigh simple price competition.
Fluoropolymer Industry Leaders
The Chemours Company
Daikin Industries Ltd.
3M
Arkema
Solvay
- *Disclaimer: Major Players sorted in no particular order


Recent Industry Developments
- February 2025: Arkema announced a 15% PVDF capacity expansion at its Calvert City plant in Kentucky, investing USD 20 million to meet rising demand from EV batteries, semiconductors, and cable markets, reinforcing its leadership in the global fluoropolymer industry. The startup is planned for mid-2026.
- March 2024: Kureha Corporation announced its decision to discontinue a capacity expansion project for polyvinylidene fluoride (PVDF) at its wholly-owned subsidiary, Kureha Changshu Fluoropolymer Co., Ltd. in China.


Global Fluoropolymer Market Report Scope
Aerospace, Automotive, Building and Construction, Electrical and Electronics, Industrial and Machinery, Packaging are covered as segments by End User Industry. Ethylenetetrafluoroethylene (ETFE), Fluorinated Ethylene-propylene (FEP), Polytetrafluoroethylene (PTFE), Polyvinylfluoride (PVF), Polyvinylidene Fluoride (PVDF) are covered as segments by Sub Resin Type. Africa, Asia-Pacific, Europe, Middle East, North America, South America are covered as segments by Region.| Ethylenetetrafluoroethylene (ETFE) |
| Fluorinated Ethylene-propylene (FEP) |
| Polytetrafluoroethylene (PTFE) |
| Polyvinylfluoride (PVF) |
| Polyvinylidene Fluoride (PVDF) |
| Other Sub Resin Types |
| Aerospace |
| Automotive |
| Building and Construction |
| Electrical and Electronics |
| Industrial and Machinery |
| Packaging |
| Other End-User Industries |
| Asia-Pacific | China |
| Japan | |
| India | |
| South Korea | |
| Australia | |
| Malaysia | |
| Rest of Asia-Pacific | |
| North America | United States |
| Canada | |
| Mexico | |
| Europe | Germany |
| France | |
| Italy | |
| United Kingdom | |
| Russia | |
| Rest of Europe | |
| South America | Brazil |
| Argentina | |
| Rest of South America | |
| Middle-East and Africa | Saudi Arabia |
| United Arab Emirates | |
| Nigeria | |
| South Africa | |
| Rest of Middle-East and Africa |
| By Sub-Resin Type | Ethylenetetrafluoroethylene (ETFE) | |
| Fluorinated Ethylene-propylene (FEP) | ||
| Polytetrafluoroethylene (PTFE) | ||
| Polyvinylfluoride (PVF) | ||
| Polyvinylidene Fluoride (PVDF) | ||
| Other Sub Resin Types | ||
| By End-User Industry | Aerospace | |
| Automotive | ||
| Building and Construction | ||
| Electrical and Electronics | ||
| Industrial and Machinery | ||
| Packaging | ||
| Other End-User Industries | ||
| By Geography | Asia-Pacific | China |
| Japan | ||
| India | ||
| South Korea | ||
| Australia | ||
| Malaysia | ||
| Rest of Asia-Pacific | ||
| North America | United States | |
| Canada | ||
| Mexico | ||
| Europe | Germany | |
| France | ||
| Italy | ||
| United Kingdom | ||
| Russia | ||
| Rest of Europe | ||
| South America | Brazil | |
| Argentina | ||
| Rest of South America | ||
| Middle-East and Africa | Saudi Arabia | |
| United Arab Emirates | ||
| Nigeria | ||
| South Africa | ||
| Rest of Middle-East and Africa | ||


Market Definition
- End-user Industry - Building & Construction, Packaging, Automotive, Aerospace, Industrial Machinery, Electrical & Electronics, and Others are the end-user industries considered under the fluoropolymers market.
- Resin - Under the scope of the study, virgin fluoropolymer resins like Polytetrafluoroethylene, Polyvinylidene Fluoride, Polyvinylfluoride, Fluorinated Ethylene-propylene, Ethylenetetrafluoroethylene, etc. in the primary forms are considered.
| Keyword | Definition |
|---|---|
| Acetal | This is a rigid material that has a slippery surface. It can easily withstand wear and tear in abusive work environments. This polymer is used for building applications such as gears, bearings, valve components, etc. |
| Acrylic | This synthetic resin is a derivative of acrylic acid. It forms a smooth surface and is mainly used for various indoor applications. The material can also be used for outdoor applications with a special formulation. |
| Cast film | A cast film is made by depositing a layer of plastic onto a surface then solidifying and removing the film from that surface. The plastic layer can be in molten form, in a solution, or in dispersion. |
| Colorants & Pigments | Colorants & Pigments are additives used to change the color of the plastic. They can be a powder or a resin/color premix. |
| Composite material | A composite material is a material that is produced from two or more constituent materials. These constituent materials have dissimilar chemical or physical properties and are merged to create a material with properties unlike the individual elements. |
| Degree of Polymerization (DP) | The number of monomeric units in a macromolecule, polymer, or oligomer molecule is referred to as the degree of polymerization or DP. Plastics with useful physical properties often have DPs in the thousands. |
| Dispersion | To create a suspension or solution of material in another substance, fine, agglomerated solid particles of one substance are dispersed in a liquid or another substance to form a dispersion. |
| Fiberglass | Fiberglass-reinforced plastic is a material made up of glass fibers embedded in a resin matrix. These materials have high tensile and impact strength. Handrails and platforms are two examples of lightweight structural applications that use standard fiberglass. |
| Fiber-reinforced polymer (FRP) | Fiber-reinforced polymer is a composite material made of a polymer matrix reinforced with fibers. The fibers are usually glass, carbon, aramid, or basalt. |
| Flake | This is a dry, peeled-off piece, usually with an uneven surface, and is the base of cellulosic plastics. |
| Fluoropolymers | This is a fluorocarbon-based polymer with multiple carbon-fluorine bonds. It is characterized by high resistance to solvents, acids, and bases. These materials are tough yet easy to machine. Some of the popular fluoropolymers are PTFE, ETFE, PVDF, PVF, etc. |
| Kevlar | Kevlar is the commonly referred name for aramid fiber, which was initially a Dupont brand for aramid fiber. Any group of lightweight, heat-resistant, solid, synthetic, aromatic polyamide materials that are fashioned into fibers, filaments, or sheets is called aramid fiber. They are classified into Para-aramid and Meta-aramid. |
| Laminate | A structure or surface composed of sequential layers of material bonded under pressure and heat to build up to the desired shape and width. |
| Nylon | They are synthetic fiber-forming polyamides formed into yarns and monofilaments. These fibers possess excellent tensile strength, durability, and elasticity. They have high melting points and can resist chemicals and various liquids. |
| PET preform | A preform is an intermediate product that is subsequently blown into a polyethylene terephthalate (PET) bottle or a container. |
| Plastic compounding | Compounding consists of preparing plastic formulations by mixing and/or blending polymers and additives in a molten state to achieve the desired characteristics. These blends are automatically dosed with fixed setpoints usually through feeders/hoppers. |
| Plastic pellets | Plastic pellets, also known as pre-production pellets or nurdles, are the building blocks for nearly every product made of plastic. |
| Polymerization | It is a chemical reaction of several monomer molecules to form polymer chains that form stable covalent bonds. |
| Styrene Copolymers | A copolymer is a polymer derived from more than one species of monomer, and a styrene copolymer is a chain of polymers consisting of styrene and acrylate. |
| Thermoplastics | Thermoplastics are defined as polymers that become soft material when it is heated and becomes hard when it is cooled. Thermoplastics have wide-ranging properties and can be remolded and recycled without affecting their physical properties. |
| Virgin Plastic | It is a basic form of plastic that has never been used, processed, or developed. It may be considered more valuable than recycled or already used materials. |


Research Methodology
Mordor Intelligence follows a four-step methodology in all our reports.
- Step-1: Identify Key Variables: The quantifiable key variables (industry and extraneous) pertaining to the specific product segment and country are selected from a group of relevant variables & factors based on desk research & literature review; along with primary expert inputs. These variables are further confirmed through regression modeling (wherever required).
- Step-2: Build a Market Model: In order to build a robust forecasting methodology, the variables and factors identified in Step-1 are tested against available historical market numbers. Through an iterative process, the variables required for market forecast are set and the model is built on the basis of these variables.
- Step-3: Validate and Finalize: In this important step, all market numbers, variables and analyst calls are validated through an extensive network of primary research experts from the market studied. The respondents are selected across levels and functions to generate a holistic picture of the market studied.
- Step-4: Research Outputs: Syndicated Reports, Custom Consulting Assignments, Databases & Subscription Platforms


