Flocculant And Coagulant Market Size and Share
Market Overview
| Study Period | 2021 - 2031 |
|---|---|
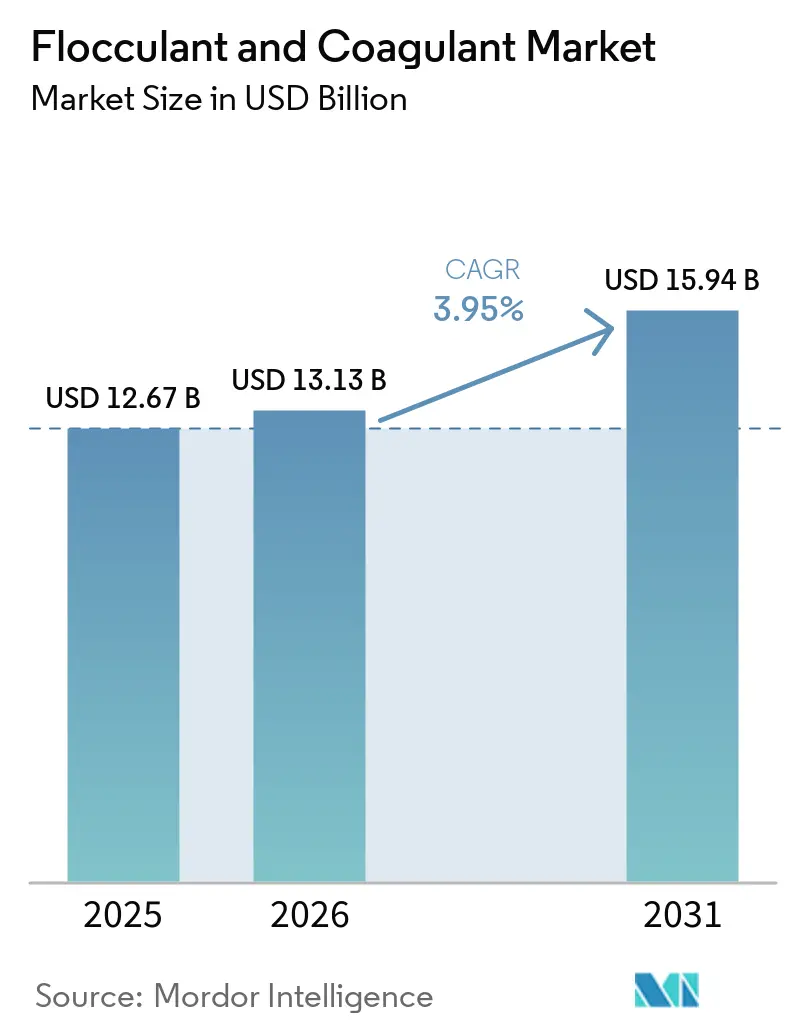
| Market Size (2026) | USD 13.13 Billion |
| Market Size (2031) | USD 15.94 Billion |
| Growth Rate (2026 - 2031) | 3.95% CAGR |
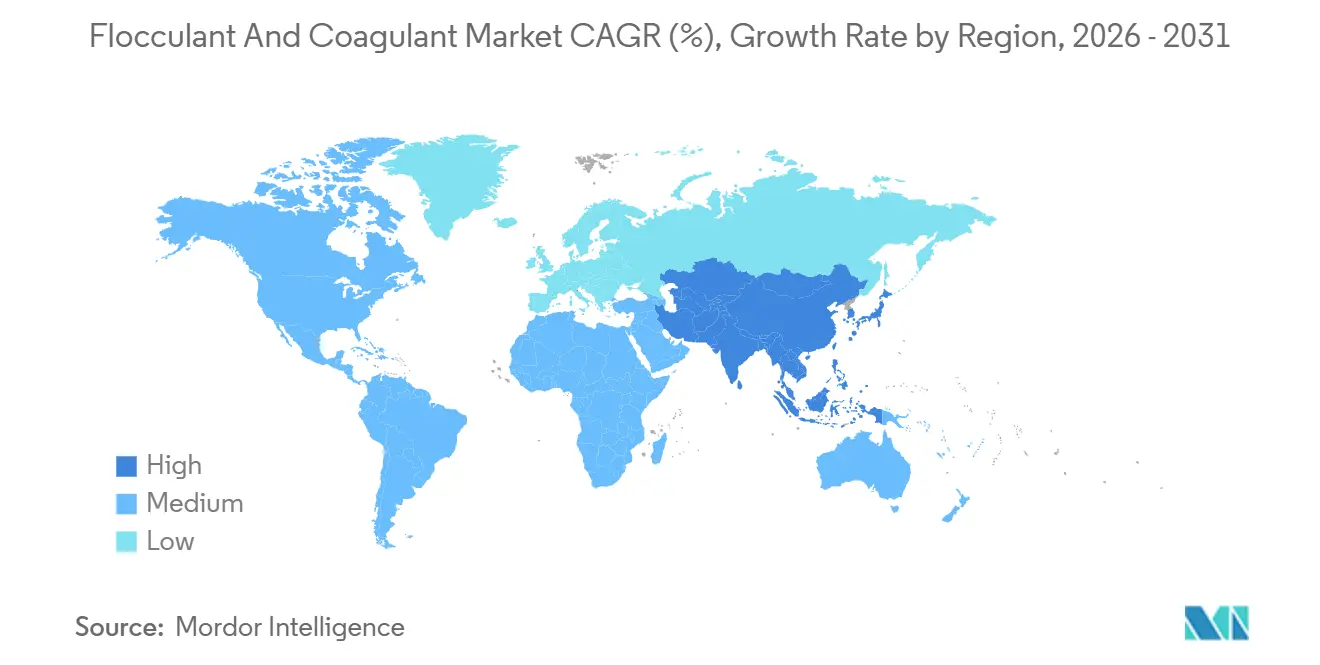
| Fastest Growing Market | Asia-Pacific |
| Largest Market | Asia-Pacific |
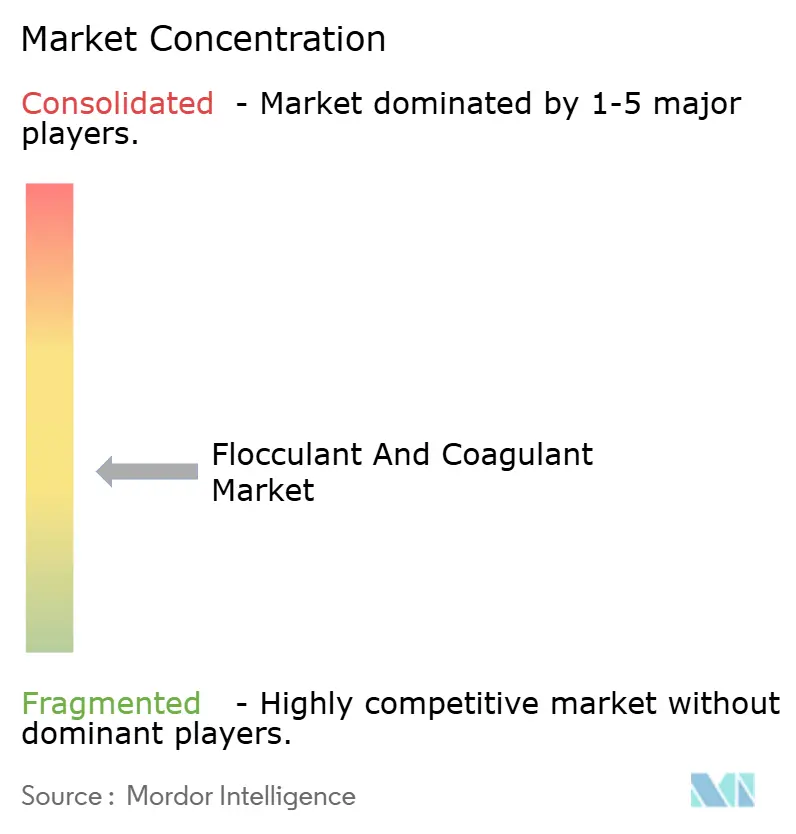
| Market Concentration | Medium |
Major Players *Disclaimer: Major Players sorted in no particular order Image © Mordor Intelligence. Reuse requires attribution under CC BY 4.0. | |
Flocculant And Coagulant Market Analysis by Mordor Intelligence
The flocculant and coagulant market size is expected to increase from USD 12.67 billion in 2025 to USD 13.13 billion in 2026 and reach USD 15.94 billion by 2031, growing at a CAGR of 3.95% over 2026-2031. Municipal utilities across North America and Europe are lowering per-capita dosing instead of adding new capacity, while discharge-limit shocks in Southeast Asia, India, and the Middle-East drive step-ups in chemical use. Coagulants stay ahead of flocculants because zero-liquid-discharge (ZLD) systems require high-purity inorganic salts to protect membranes, and phosphorus-removal mandates favor iron and aluminum blends. Asia-Pacific is expanding fastest, supported by rising polyaluminium chloride (PAC) production in China and tightened effluent rules in Vietnam and Indonesia. In contrast, North America and Europe see muted volume growth but higher spending on specialty blends and AI-directed dosing platforms, which cut chemical waste by 15-25%.
Key Report Takeaways
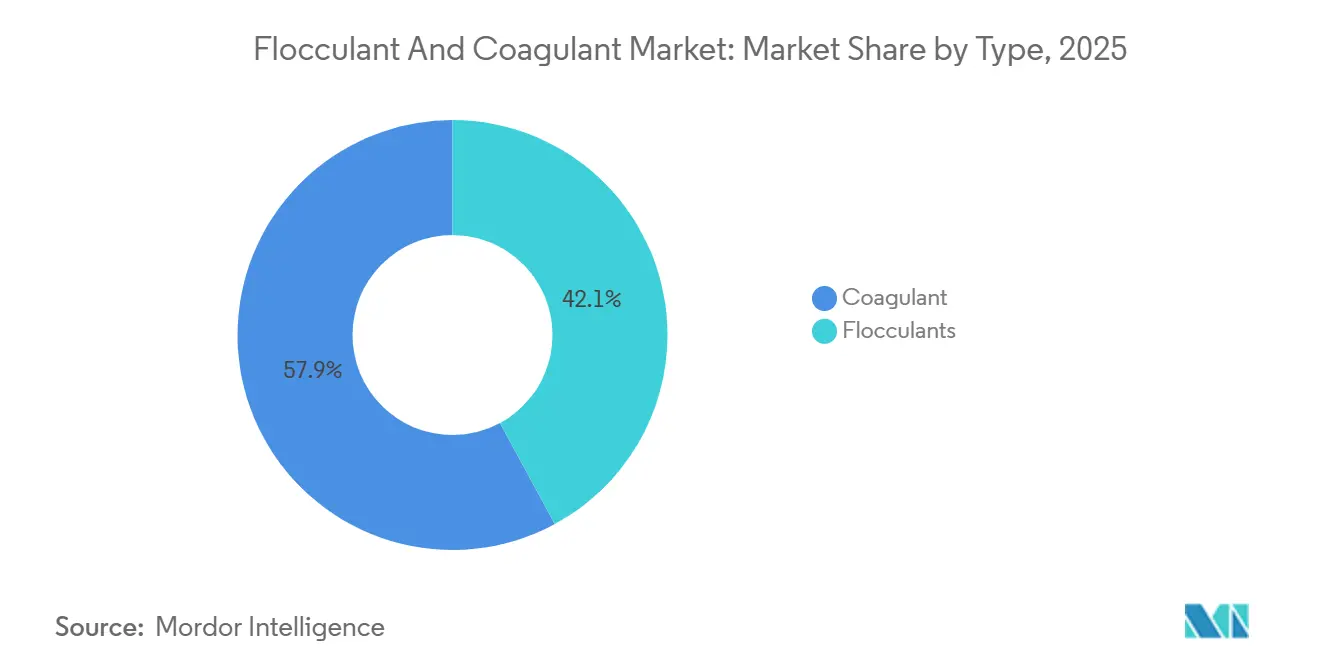
- By type, coagulants led with 57.89% of the flocculant and coagulant market share in 2025; coagulants are projected to grow at 4.56% CAGR from 2026 to 2031.
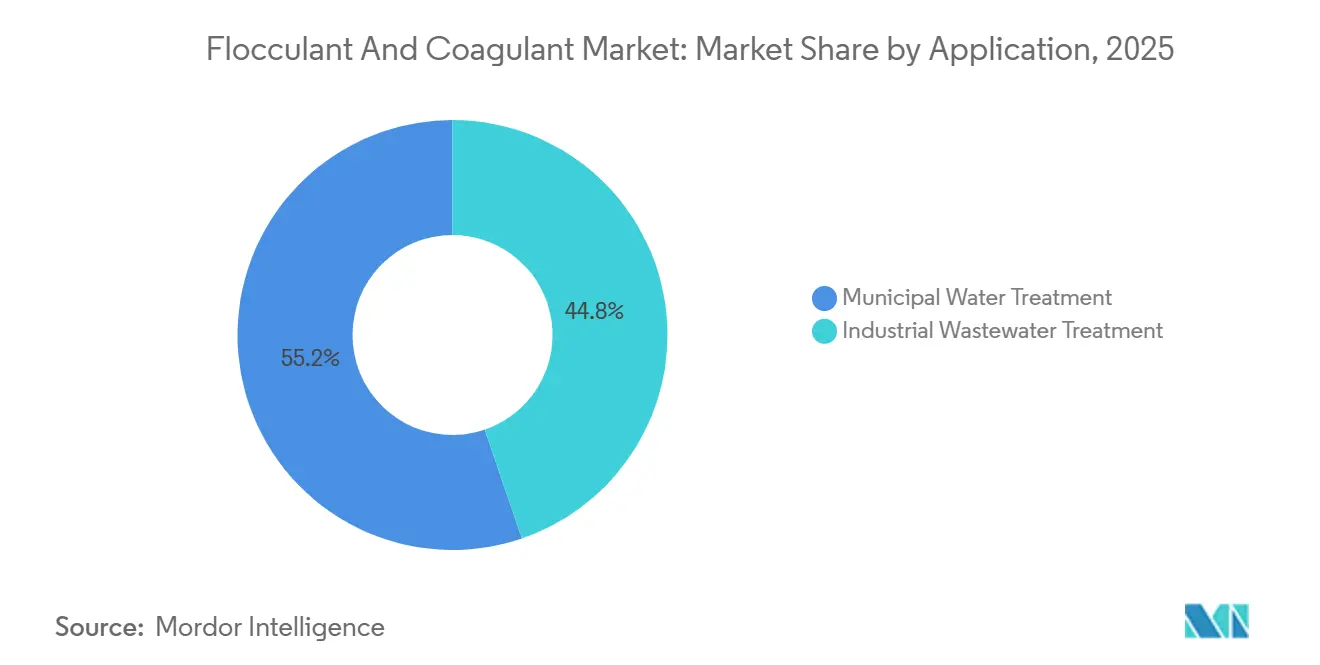
- By application, municipal water commanded 55.23% share of the flocculant and coagulant market size in 2025, while industrial wastewater treatment is advancing at a 4.71% CAGR from 2026 to 2031.
- By geography, Asia-Pacific captured 31.20% revenue share in 2025; the region is set to post the fastest 4.98% CAGR from 2026 to 2031.
Note: Market size and forecast figures in this report are generated using Mordor Intelligence’s proprietary estimation framework, updated with the latest available data and insights as of January 2026.
Global Flocculant And Coagulant Market Trends and Insights
Drivers Impact Analysis*
| Driver | % Impact on CAGR Forecast | Geographic Relevance | Impact Timeline |
|---|---|---|---|
| Stricter discharge norms for emerging-market industrial clusters | +0.8% | APAC (Vietnam, Indonesia, India), spill-over to Middle East & Africa | Short term (≤ 2 years) |
| Rapid build-out of zero-liquid-discharge (ZLD) power and petrochem plants | +0.6% | Global, concentrated in APAC (China, India) and Middle East (Saudi Arabia, UAE) | Medium term (2-4 years) |
| Re-use mandates in water-scarce regions | +0.5% | North America (California, Arizona, New Mexico), Middle East, Southern Europe (Spain), Australia | Medium term (2-4 years) |
| Mature utility spending cycles in North America and Europe | +0.3% | North America & EU | Long term (≥ 4 years) |
| AI-enabled dosing control platforms boosting chemical efficiency | +0.4% | Global, early adoption in North America, EU, and urban APAC | Medium term (2-4 years) |
| Source: Mordor Intelligence | |||
Stricter Discharge Norms for Emerging-Market Industrial Clusters
In Southeast and South Asia, new regulations compel factories to significantly boost their chemical throughput to comply with stricter limits on Chemical Oxygen Demand (COD) and suspended solids. Starting January 2025, Vietnam's QCVN 40:2025 regulation reduced COD allowances for effluents from textile and food-processing industries to 50 mg/L[1]Ministry of Natural Resources and Environment Vietnam, “Implementation Guide for QCVN 40:2025,” monre.gov.vn. Meanwhile, Indonesia's 2024 rule on domestic wastewater mandates an 80% removal of solids, leading to necessary upgrades in municipalities like Jakarta, Surabaya, and Bandung. Turkey, South Korea, and India have also tightened regulations, shortening procurement windows, favoring suppliers with local stock, and creating demand spikes that exceed the headline CAGR in these regions.
Rapid Build-Out of Zero-Liquid-Discharge (ZLD) Power and Petrochem Plants
Zero Liquid Discharge (ZLD) systems utilize coagulation, reverse osmosis, and crystallization techniques to achieve near-total water recovery. Coagulants are embedded as a mandatory pretreatment step to safeguard the membranes. Veolia has implemented a system at Shell's Pearl GTL plant, successfully treating 12,000 m³/day of blowdown with a 99.5% recovery rate[2]Veolia Water Technologies, “Pearl GTL ZLD Commissioning,” veolia.com. China's coal-chemical initiatives in Shaanxi and Inner Mongolia, along with textile clusters in India in 2025, are aimed at zero discharge. This urgency is steering them towards long-term chemical service contracts, often at a premium price.
Re-Use Mandates in Water-Scarce Regions
In arid regions, expanding water-reuse regulations are pushing coagulant consumption beyond traditional municipal treatments, extending into both direct and indirect potable reuse. California, Arizona, and New Mexico are implementing rules for direct and indirect potable reuse, mandating upfront multi-barrier treatment that includes coagulation. Meanwhile, Spain's updated decree expands reclaimed-water usage in Murcia and Almería. These regulations are transitioning coagulant demand from sporadic municipal upgrades to consistent use in industrial and agricultural settings. However, the performance variability in matrices with high salinity and organic content necessitates tailored formulation and dosing optimization for each site.
Mature Utility Spending Cycles in North America and Europe
In North America and Europe, municipal water utilities are shifting their focus from expanding capacity to achieving chemical efficiency and operational savings. This change has led to a flattening of volume growth, yet these utilities continue to sustain revenue by offering premium-priced specialty products. Major utilities in both the U.S. and the EU are concentrating on reducing sludge volume and cutting energy costs. This focus has spurred the adoption of blended iron-aluminum products and real-time dosing platforms. In 2024, a 40% spike in electricity prices in Germany hastened the transition to low-dose coagulant regimes. These regimes not only reduce sludge by 20-30% but also justify the premium pricing. As purchasing decisions shift from being volume-driven to value-driven, margins for commodity-grade coagulants are being compressed. However, suppliers that provide technical services, jar-testing support, and performance guarantees are reaping the rewards.
Restraints Impact Analysis*
| Restraint | (~) % Impact on CAGR Forecast | Geographic Relevance | Impact Timeline |
|---|---|---|---|
| Regulatory toxicity spotlight on acrylamide monomer residues | -0.4% | Global, heightened scrutiny in EU and North America | Medium term (2-4 years) |
| Input price spikes for aluminum and ferric salts | -0.3% | Global, acute in regions with energy-intensive production (EU, North America) | Short term (≤ 2 years) |
| Growing preference for membrane and electro-coagulation hybrids | -0.5% | North America, EU, urban APAC (Singapore, Japan, South Korea) | Long term (≥ 4 years) |
| Source: Mordor Intelligence | |||
Regulatory Toxicity Spotlight on Acrylamide Monomer Residues
In 2024, the U.S. EPA added acrylamide to its Contaminant Candidate List. WHO set a cap of 0.5 mg/kg for residual acrylamide in drinking water and Japan reduced food-contact limits to 0.05 mg/kg. The EU plans to restrict formulations with over 0.1 percent residual monomer. Producers face purification costs of USD 0.10 to 0.30 per kg. Offering certified low-residue grades may assist producers in maintaining a competitive position within the market.
Growing Preference for Membrane and Electro-Coagulation Hybrids
In Singapore and California, electrocoagulation pilots report turbidity removal rates of up to 99%, with 30-50% less sludge generation. However, high capital costs and frequent electrode replacements limit broader adoption. At Singapore's NEWater plant, hybrid membrane-electrocoagulation units have achieved annual savings of USD 200,000 in sludge disposal, suggesting a gradual reduction in chemical usage for new constructions.
*Our forecasts treat driver/restraint impacts as directional, not additive. The impact forecasts reflect baseline growth, mix effects, and variable interactions.
Segment Analysis
By Type: Inorganic Coagulants Anchor Volume, Organics Capture Premium Niches
In 2025, coagulants captured a 57.89% share of the revenue pie, and projections indicate this segment will grow at a 4.56% CAGR through 2031. Within the coagulant segment, inorganic variants like PAC, aluminum sulfate, and ferric chloride lead in tonnage. This dominance is supported by China's 2025 output of 2.3123 million tons of PAC, fetching an average domestic price of CNY 1,636/ton (approximately USD 230/ton). Organic coagulants, such as polyDADMAC and EPI-DMDA, have a price premium of 15-30%. These organic variants perform well in high-alkalinity waters, where their ability to reduce sludge volume justifies the elevated costs. Bio-based alternatives like chitosan and Moringa extracts have shown 85-95% turbidity removal in lab tests. However, challenges in the supply chain and consistency have limited their market share.
Flocculants play a critical role in sludge dewatering and mineral processing. Cationic polyacrylamides account for the majority of flocculant revenue, driven by the need for high-charge polymers in municipal sludge and mining tailings to facilitate water release. Anionic variants are used as retention aids in the pulp-and-paper industry, while non-ionic grades are applied in coal washing. Regulatory initiatives aiming to limit residual monomer content to below 0.5 mg/kg in potable applications have increased production costs. However, they also create opportunities for ultra-low-monomer products, which can be marketed at a premium price point.


By Application: Municipal Leadership Meets Industrial Momentum
Municipal water treatment contributed 55.23% of 2025 revenue, underpinned by large-scale plants in urban North America, Europe, and China that depend on iron and aluminum salts for turbidity and pathogen reduction. Even as budgets tighten, utilities invest in AI-guided dosing that cuts chemical needs 15-25% and reduces sludge haulage. Direct potable reuse rules in California and Arizona create steady demand for high-purity coagulants to reach sub-0.3 NTU feed standards.
Industrial wastewater treatment is projected to grow at a 4.71% CAGR to 2031, the fastest segment within the flocculant and coagulant market. Mining operations in Chile and Indonesia increase anionic PAM consumption for thickening tailings to 65-70% solids, and oil-and-gas producers in New Mexico deploy iron salts to polish produced water for reuse. ZLD mandates in coal-chemical projects across China and textile hubs in India embed continuous coagulant use upstream of evaporators and crystallizers, raising both volume and value of specialty blends tailored to hypersaline streams.
Geography Analysis
In 2025, Asia-Pacific commands the flocculant and coagulant market with a 31.20% revenue share and is expected to grow at a 4.98% CAGR through 2031. China's PAC base, a dominant player, caters to regional textile, paper, and coal-chemical plants. Meanwhile, tighter discharge norms in Vietnam, Indonesia, and India have led to a threefold increase in chemical throughput in specific clusters. Japan and South Korea are at the forefront, employing AI-driven dosing to adhere to phosphorus caps of 0.2 mg/L. ASEAN nations, with backing from multilaterals, are upgrading municipal systems, yet procurement trends lean towards cost-effective producers from China and India.
North America may be expanding its volume at a slower pace, but it's spending more per ton on specialty coagulants and cloud-connected control platforms. Key initiatives like California's 2025 direct-potable-reuse rollout and Arizona's USD 1.2 billion water-reuse program are bolstering demand. Additionally, under New Mexico's 2024 act, the Permian Basin is reclaiming produced water for irrigation. In Canada, utilities are adopting low-dose PAC strategies to counter rising landfill fees for sludge, ensuring steady revenue despite only modest volume increases.
Europe's demand remains stable, particularly in Germany, the United Kingdom, France, and the Nordic countries. Energy price fluctuations are pushing a shift towards low-dose blends. France is incentivizing this shift with a EUR 500 million (~USD 585.06 million) subsidy plan for small utilities, especially rewarding those with ISO 9001 and NSF 60 certifications. While Spain's new irrigation reuse regulations boost coagulant use in Murcia and Almería, budget limitations in Russia are restraining growth to a modest 1-2% annually. In South America and the Middle-East and Africa, niche opportunities arise in mining, desalination, and municipal zero liquid discharge (ZLD) projects, spurred by tightening effluent regulations in Brazil, copper tailings in Chile, and grand desalination initiatives in Saudi Arabia.

Competitive Landscape
The flocculant and coagulant market is witnessing a trend of moderate fragmented. The top five suppliers are SNF, Kemira, Solenis, BASF, and Ecolab. In 2024, Platinum Equity made headlines with its USD 5.25 billion acquisition of Solenis, resulting in a robust 71-site network boasting a turnover of USD 3.9 billion. Meanwhile, USALCO's merger with G2O Technologies established a 27-site platform for aluminum and iron salts, spanning the United States and Puerto Rico. Kemira's strategic 2025 acquisition of Water Engineering, Inc., not only added 14 U.S. plants to its portfolio but also expanded its service offerings. This move underscores a broader industry trend towards integrated chemical and digital solutions, fostering multiyear contracts.
Chinese and Indian companies dominate the cost landscape in commodity-grade inorganics. They export PAC at approximately USD 230/t ex-works, significantly undercutting their Western counterparts, who grapple with power costs that are 40% higher. Digital tools are reshaping the industry: Ecolab's 3D TRASAR and Kemira's KemConnect leverage cloud analytics for optimized dosing. This innovation translates to annual savings of USD 50,000 to 200,000 per site, creating formidable switching barriers. While electrocoagulation and membrane suppliers emerge as potential disruptors, their growth is tempered by high capital expenditures, ranging from USD 2 to 5 per m³ for full zero liquid discharge (ZLD), and the ongoing maintenance of electrodes, limiting their reach to premium reuse and desalination segments.
Innovative strides are being made in the realm of bio-based coagulants, particularly for hypersaline wastewater. Lab trials in 2026 showcased promising results: Arthrospira platensis biomass achieved a salt removal of 235.25 mg per gram dry weight, while a Nostoc–Mentha hybrid demonstrated a 34.5% reduction in Red Sea chloride. These findings suggest potential low-energy pretreatment methods that could significantly reduce chemical usage in desalination, especially when scaled up.
Flocculant And Coagulant Industry Leaders
BASF
Kemira Oyj
Ecolab Inc.
SNF Group
Solenis
- *Disclaimer: Major Players sorted in no particular order

Recent Industry Developments
- February 2026: Solenis bolstered its portfolio by acquiring BASF’s flocculants business, specifically tailored for mining applications. This strategic move not only strengthened Solenis's offerings but also enhanced its capability to provide holistic solutions to its mining and mineral processing clientele. With this integration, Solenis is expected to deliver an expanded suite of products and services, catering to the varied demands of the mining sector.
- January 2026: Journal of Environmental Management reported Arthrospira platensis cut salinity 28.13% and removed 235.25 mg salt/g, opening doors for bio-desalination.


Global Flocculant And Coagulant Market Report Scope
Coagulants and flocculants are chemicals used in water treatment to remove suspended solids. Coagulants neutralize negative charges on contaminants to form tiny microflocs, while flocculants bind these microflocs into larger, heavier particles (flocs) that settle rapidly for removal.
The market is segmented by type and application. By type, the market is segmented into coagulants and flocculants. The coagulants segment is further categorized into inorganic coagulants, organic/synthetic coagulants, and natural/bio-based coagulants. The flocculants segment is further categorized into cationic flocculants, anionic flocculants, and non-ionic flocculants. By application, the market is segmented into municipal water treatment and industrial wastewater treatment. The industrial wastewater treatment segment is further categorized into pulp and paper, mining and mineral processing, oil and gas, power generation, and construction and infrastructure. The report also covers the market size and forecasts for flocculants and coagulants in 17 countries across the world. For each segemnt market sizing and forecasts are provided in terms of value (USD).
| Coagulants | Inorganic Coagulants |
| Organic/Synthetic Coagulants | |
| Natural/Bio-based Coagulants | |
| Flocculants | Cationic Flocculants |
| Anionic Flocculants | |
| Non-ionic Flocculants |
| Municipal Water Treatment | |
| Industrial Wastewater Treatment | Pulp and Paper |
| Mining and Mineral Processing | |
| Oil and Gas | |
| Power Generation | |
| Construction and Infrastructure |
| Asia-Pacific | China |
| Japan | |
| India | |
| South Korea | |
| ASEAN | |
| Rest of Asia-Pacific | |
| North America | United States |
| Canada | |
| Mexico | |
| Europe | Germany |
| United Kingdom | |
| France | |
| Italy | |
| Spain | |
| Russia | |
| Nordics | |
| Rest of Europe | |
| South America | Brazil |
| Argentina | |
| Rest of South America | |
| Middle-East and Africa | Saudi Arabia |
| South Africa | |
| Rest of Middle-East and Africa |
| By Type | Coagulants | Inorganic Coagulants |
| Organic/Synthetic Coagulants | ||
| Natural/Bio-based Coagulants | ||
| Flocculants | Cationic Flocculants | |
| Anionic Flocculants | ||
| Non-ionic Flocculants | ||
| By Application | Municipal Water Treatment | |
| Industrial Wastewater Treatment | Pulp and Paper | |
| Mining and Mineral Processing | ||
| Oil and Gas | ||
| Power Generation | ||
| Construction and Infrastructure | ||
| By Geography | Asia-Pacific | China |
| Japan | ||
| India | ||
| South Korea | ||
| ASEAN | ||
| Rest of Asia-Pacific | ||
| North America | United States | |
| Canada | ||
| Mexico | ||
| Europe | Germany | |
| United Kingdom | ||
| France | ||
| Italy | ||
| Spain | ||
| Russia | ||
| Nordics | ||
| Rest of Europe | ||
| South America | Brazil | |
| Argentina | ||
| Rest of South America | ||
| Middle-East and Africa | Saudi Arabia | |
| South Africa | ||
| Rest of Middle-East and Africa | ||


Key Questions Answered in the Report
What is the projected value of the flocculant and coagulant market in 2031?
The flocculant and coagulant market size is expected to increase from USD 12.67 billion in 2025 to USD 13.13 billion in 2026 and reach USD 15.94 billion by 2031, growing at a CAGR of 3.95% over 2026-2031.
Which segment is growing fastest within the market?
Industrial wastewater treatment is set to expand at a 4.71% CAGR between 2026-2031.
Why are coagulants outpacing flocculants in revenue growth?
Zero-liquid-discharge mandates and tighter phosphorus limits require high-volume inorganic coagulants, lifting their 4.56% CAGR.
Which region will add the largest incremental demand?
Asia-Pacific, led by China, Vietnam, and Indonesia, is projected to post a 4.98% CAGR through 2031.
Page last updated on:


