Flower Pots And Planters Market Size and Share
Market Overview
| Study Period | 2020 - 2031 |
|---|---|
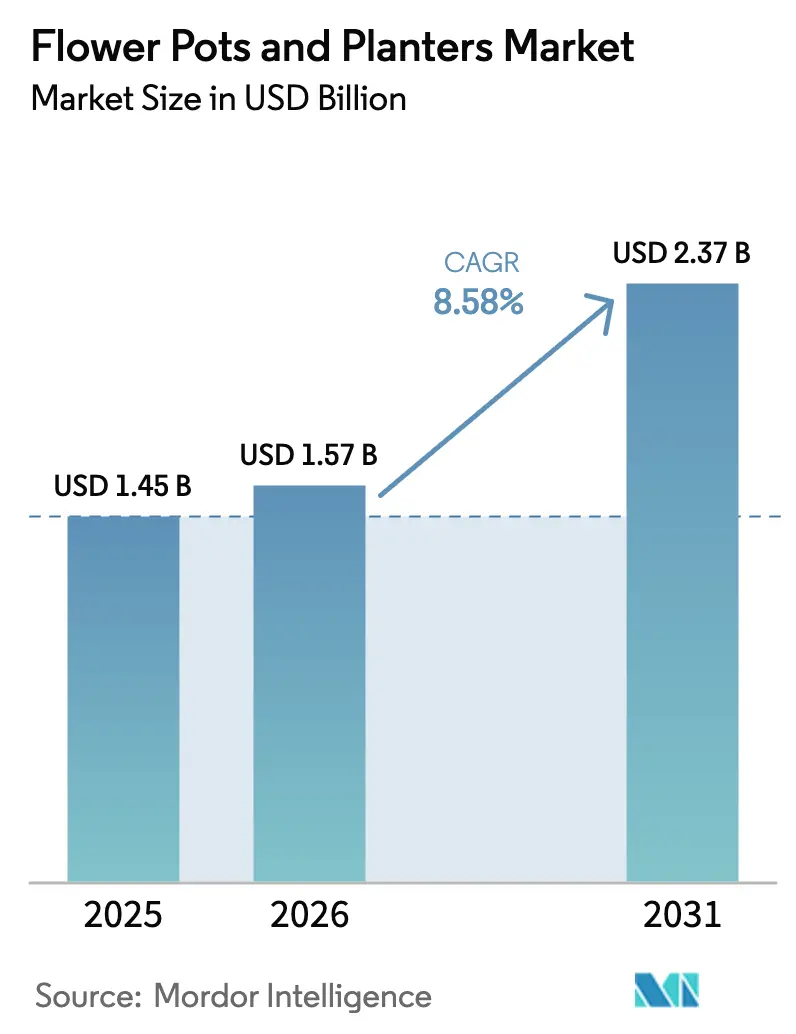
| Market Size (2026) | USD 1.57 Billion |
| Market Size (2031) | USD 2.37 Billion |
| Growth Rate (2026 - 2031) | 8.58% CAGR |
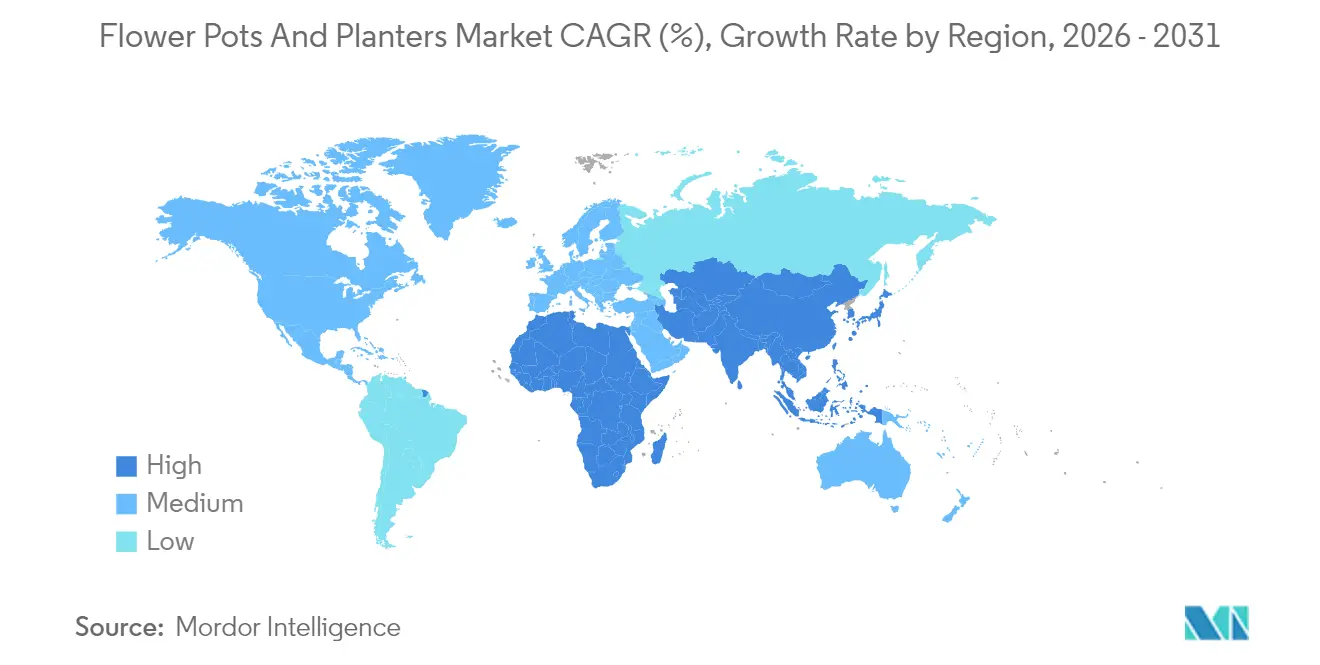
| Fastest Growing Market | Asia Pacific |
| Largest Market | North America |
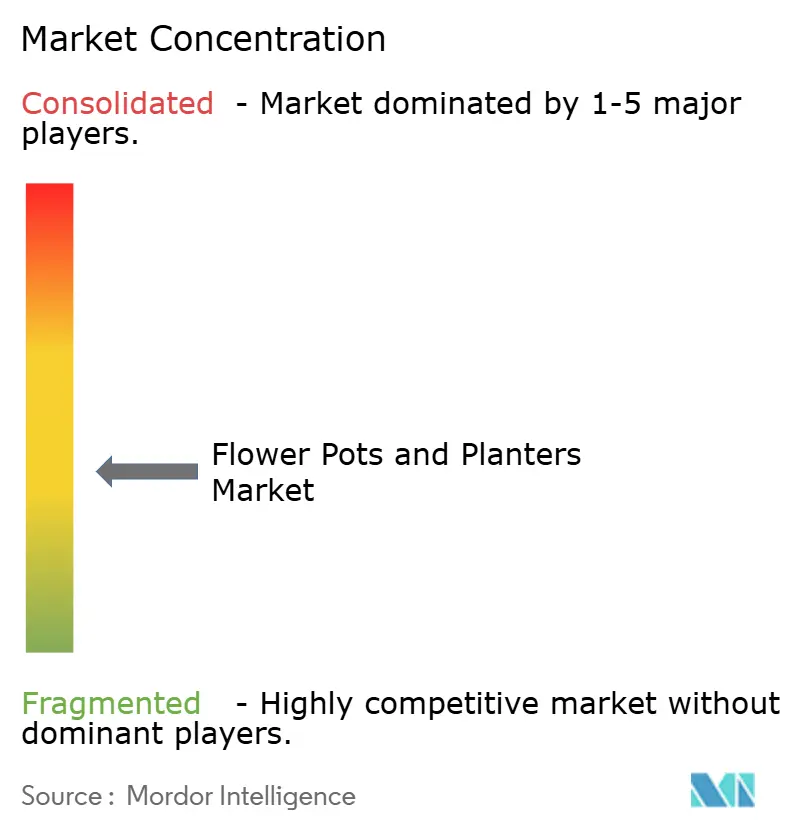
| Market Concentration | Medium |
Major Players *Disclaimer: Major Players sorted in no particular order Image © Mordor Intelligence. Reuse requires attribution under CC BY 4.0. | |
Flower Pots And Planters Market Analysis by Mordor Intelligence
The flower pots and planters market size is expected to increase from USD 1.45 billion in 2025 to USD 1.57 billion in 2026 and reach USD 2.37 billion by 2031, growing at a CAGR of 8.58% over 2026-2031. Progress is shaped by regulation-driven shifts to recycled content, verified lifecycle impact, and resilient supply strategies that temper resin volatility. Compliance milestones in the European Union and the United States are pushing mono-material designs and higher post-consumer recycled content, which tightens integration across sourcing, molding, and take-back operations. The flower pots and planters market also benefits from public-sector greening programs and city-scale climate adaptation, which favor durable, low-carbon products with verifiable energy and emissions performance. Channel dynamics show offline as the anchor for tactile evaluation, while online grows quickly with better visualization and accessibility compliance, which elevates omnichannel inventory and content execution. Leaders in the flower pots and planters market link feedstock strategy with product design and distribution orchestration, which builds a margin and compliance advantage over portfolios reliant on virgin resin.
Key Report Takeaways
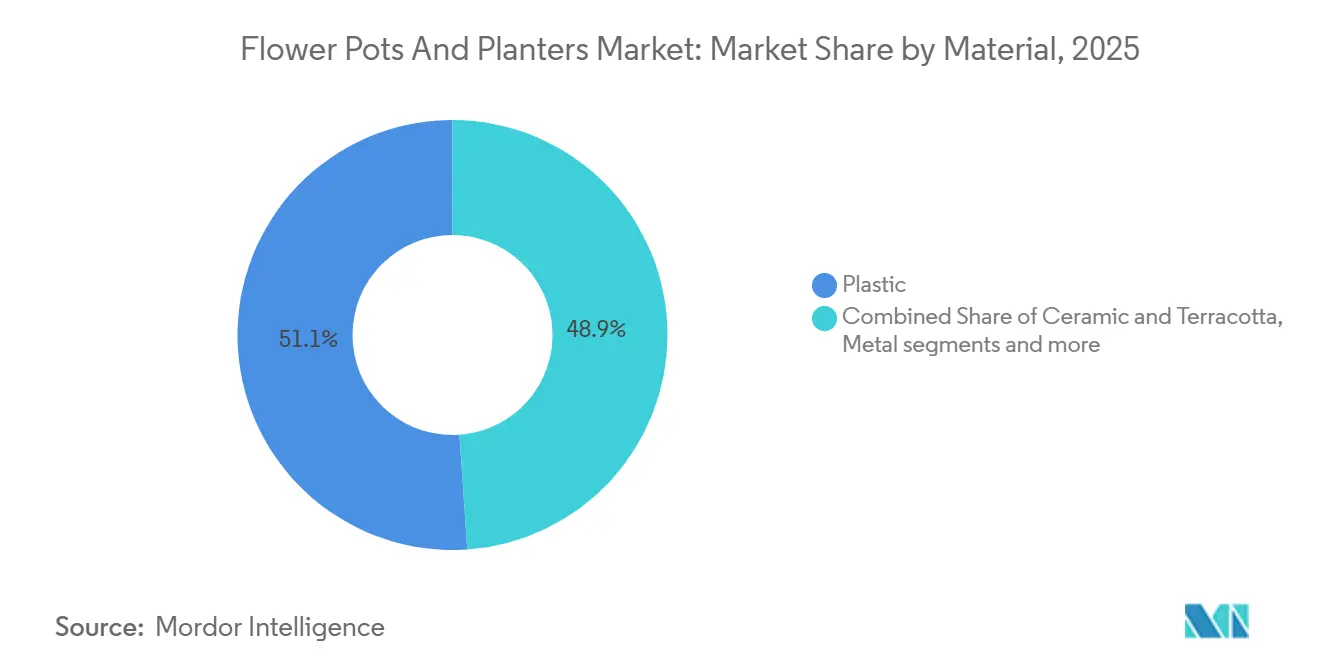
- By material, plastic led with 51.05% of the flower pots and planters market share in 2025, while bio-composite and recycled materials are projected to record a 9.75% CAGR through 2031.
- By product type, traditional pots led with 45.7% of the flower pots and planters market share in 2025, while self-watering and smart containers are projected to post a 10.55% CAGR through 2031.
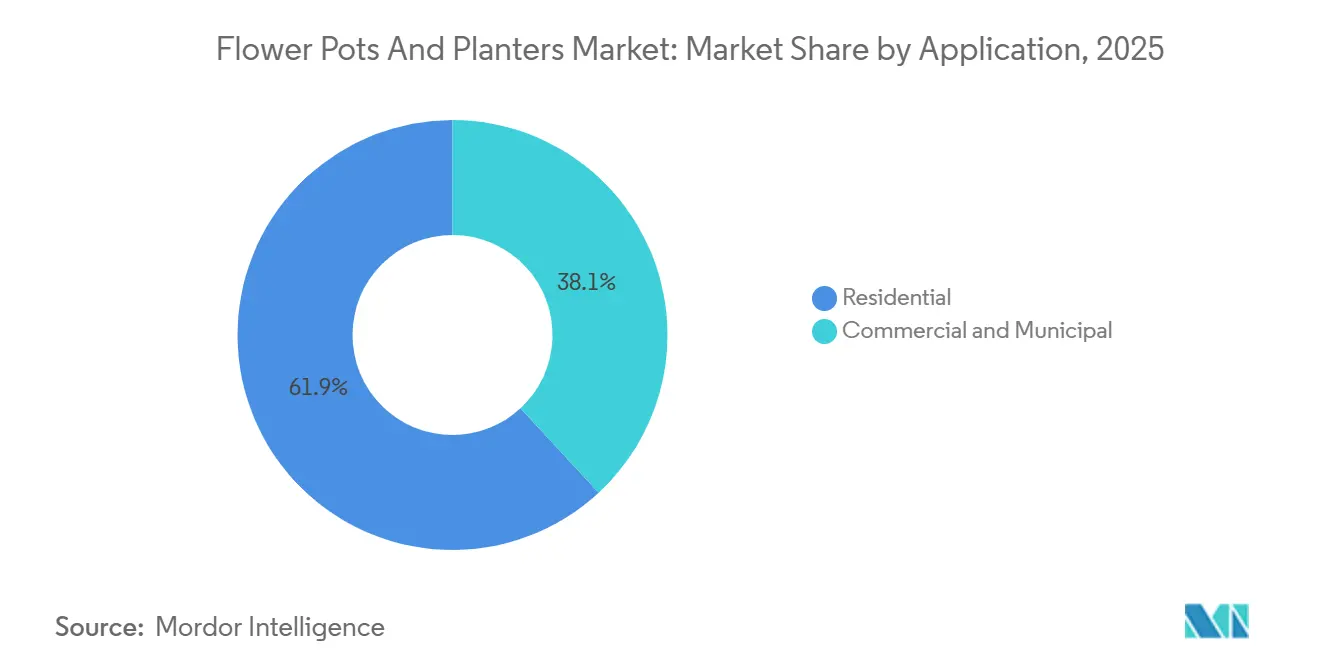
- By application, residential accounted for 61.9% of the flower pots and planters market share in 2025, whereas commercial and municipal uses are forecast to advance at an 8.69% CAGR through 2031.
- By distribution channel, offline outlets captured 75.8% of the flower pots and planters market share in 2025, while online retail is projected to grow at a 9.58% CAGR through 2031.
- By geography, North America held 32.8% of the flower pots and planters market share in 2025, while Asia-Pacific is projected to expand at a 9.92% CAGR through 2031.
Note: Market size and forecast figures in this report are generated using Mordor Intelligence’s proprietary estimation framework, updated with the latest available data and insights as of 2026.
Global Flower Pots And Planters Market Trends and Insights
Drivers Impact Analysis*
| Driver | (~) % Impact on CAGR Forecast | Geographic Relevance | Impact Timeline |
|---|---|---|---|
| Urban gardening and outdoor-living upgrades | +2.1% | Global, pronounced in North America and Asia-Pacific Tier-2 cities | Medium term (2-4 years) |
| Omnichannel expansion with strong offline discovery and rising e-commerce conversion | +1.5% | North America, Europe, with online penetration rising through 2028 | Short term (≤ 2 years) |
| Sustainability shift to recycled plastics and natural materials | +2.3% | EU core for PPWR compliance, with spillover to select United States | Medium term (2-4 years) |
| Commercial landscaping and municipal beautification spend growth | +1.4% | Asia-Pacific, Middle East, Europe with city-scale greening | Long term (≥ 4 years) |
| EPR/PPWR compliance accelerating mono-material, high-PCR planters | +1.8% | EU-27 effective August 2026, cascading to the United Kingdom, Australia, and select United States | Medium term (2-4 years) |
| Smart/self-watering planters and IoT-enabled municipal maintenance | +1.3% | North America early adopters, EU smart-city pilots, Asia-Pacific innovation hubs | Long term (≥ 4 years) |
| Source: Mordor Intelligence | |||
Urban Gardening and Outdoor-Living Upgrades Propel Residential Spend
Home upgrades that improve curb appeal and livability now feature planters as a visible and modular element of outdoor design. Green space is widely associated with improved household well-being and asset appeal, which makes targeted planter additions a simple way to lift visual impact without large-scale construction. Urban policies that prioritize heat mitigation and shade can include containerized trees and shrubs for faster rollout in constrained streetscapes. China’s continued land greening through 2024 indicates policy momentum that supports sapling and planter demand into the next decade. This tailwind supports entry-level and premium offerings alike as households look for durable, low-maintenance options that fit compact balconies and patios. The flower pots and planters market benefits from this steady residential base while public programs add volume in high-visibility corridors.
Omnichannel Expansion Balances Tactile Discovery with Digital Conversion
Offline remains large because weight, finish, and drainage design invite in-person evaluation, but digital discovery and replenishment now move in sync with seasonal windows. The segment’s 2025 base shows offline at 75.8% with online growing faster, which pushes brands to align merchandising, inventory, and creative across both touchpoints. Accessibility requirements in the European Union, effective June 2025, are raising the quality bar for e-commerce content, including alternative text and screen-reader support. That change is improving conversion for compliant retailers and encouraging better product-data standards across the value chain. Retailers that merge physical showrooms with virtual visualization and click-and-collect flow see steadier sell-through across uneven weather patterns. This evolution keeps the flower pots and planters market centered on experience quality while digital capabilities scale reach and resilience[1]European Commission Staff, “Accessibility Requirements for Products and Services,” European Commission, ec.europa.eu.
Sustainability Shift to Recycled Plastics and Natural Materials Redefines Feedstock Strategy
Regulatory clarity in the European Union sets measurable thresholds for recycled content in packaging, which has spillover effects for planters that share materials and end-of-life pathways. The Packaging and Packaging Waste Regulation becomes effective in August 2026 and codifies rising PCR targets through 2030 and beyond. Producers that pivoted early to recycled polypropylene have validated lower carbon footprints at scale while keeping aesthetics and durability intact. One leading manufacturer documented 100% recycled-plastic production and significant carbon benefits while maintaining breadth of design and consistent QA. State-level mandates in the United States, including California’s PCR floors and a defined structure for non-compliance penalties, are reinforcing the case for mono-material designs and traceable content. As a result, the flower pots and planters market is reorganizing supplier relationships around guaranteed PCR off-take, verified claims, and packaging that supports recyclability and take-back[2]EU Publications Office Staff, “Packaging and Packaging Waste Regulation,” EUR-Lex, eur-lex.europa.eu.
Commercial Landscaping and Municipal Beautification Spend Growth Unlocks B2B Channels
City-scale cooling, shade, and stormwater projects are converting planters into infrastructure components rather than décor accents. Saudi Arabia’s Green Riyadh program funds millions of trees across hundreds of square kilometers, which signals city-led demand for large-format, durable containers. Singapore has expanded programmable urban greenery, and new indoor urban farms demonstrate how automated planters and telemetry can meet space and labor constraints. In Europe, discounted network charges for energy-intensive sectors will lower ongoing costs for ceramics producers, which supports the use of terracotta in heritage streetscapes and public spaces. In the United States, budgeted curb-zone and streetscape work shows how modest allocations can support sidewalk planters and safety design. These moves broaden public procurement for the flower pots and planters Market and set new benchmarks for durability, safety compliance, and maintenance telemetry[3]Trades Union Congress Analysts, “Energy Prices and Industrial Decarbonization,” TUC, tuc.org.uk.
Restraints Impact Analysis*
| Restraint | (~) % Impact on CAGR Forecast | Geographic Relevance | Impact Timeline |
|---|---|---|---|
| Seasonality and discretionary-spend sensitivity, intense price competition | -1.2% | Global, acute in temperate climates including the United Kingdom, Northern Europe, and the Northern United States | Short term (≤ 2 years) |
| Resin and kiln energy volatility, decarbonization capex for ceramics | -1.0% | Asia-Pacific resin exposure, EU ceramic energy costs, United Kingdom kiln decarbonization needs | Medium term (2-4 years) |
| Private-label commoditization and online price pressure | -0.7% | North America and EU retail consolidation and marketplace dynamics | Short term (≤ 2 years) |
| Plastics recycling bottlenecks, uneven kerbside acceptance, new EPR fees | -0.5% | EU EPR rollout, United States variance, Australia packaging reforms | Medium term (2-4 years) |
| Source: Mordor Intelligence | |||
Seasonality and Discretionary-Spend Sensitivity Compress Margins and Working Capital
Demand spikes align with weather and planting windows, which raises stock planning complexity and return risk. Retailers see early-season surges followed by lulls, which can leave excess inventory and markdowns if replenishment outpaces actual planting. Private-label assortments price aggressively and amplify elasticities, which narrows premium bands unless brands add measurable value. Certifications and documented lifecycle performance help defend pricing where buyers face sustainability reporting. Clear and harmonized labeling standards improve signal in crowded aisles and reduce confusion that often favors the lowest price. In aggregate, these factors compress working capital cycles and challenge less diversified suppliers in the flower pots and planters market.
Resin and Kiln Energy Volatility Plus Decarbonization Capex Stress Producer Economics
Resin costs are sensitive to petrochemical disruptions and shipping constraints, which can move faster than retail price resets and distributor agreements. Ceramic and terracotta producers face high energy intensity, and sector-level data in the United Kingdom show energy spend near a dominant share of turnover. Electricity prices have also been higher than key European peers, which reinforces the need to modernize kilns. Leading brick and ceramic producers have invested in electrification that dramatically reduces direct emissions, providing a template for capital planning. Government relief on network charges delivers partial operating cost relief, which helps maintain supply during the transition. Energy-management systems and ISO certifications are now appearing in tenders, which adds audit scope but opens access to public procurement for the most prepared vendors[4]Trades Union Congress Analysts, “Energy Prices and Industrial Decarbonization,” TUC, tuc.org.uk.
*Our forecasts treat driver/restraint impacts as directional, not additive. The impact forecasts reflect baseline growth, mix effects, and variable interactions.
Segment Analysis
By Material: Recycled and Bio-Composite Feedstocks Gain as Virgin Plastic Faces Regulatory Headwinds
Plastic held a 51.05% share in 2025, while bio-composite and recycled materials are forecast to post a 9.75% CAGR through 2031, which reshapes sourcing and tooling priorities for the category. The EU Packaging and Packaging Waste Regulation, effective in August 2026, formalizes recycled content thresholds that influence both packaging and product strategies in adjacent categories. Producers that switched to 100% recycled polypropylene at scale have validated lower carbon footprints and proof of quality control, which strengthens retail positioning and compliance narratives. United States mandates and defined non-compliance penalties increase the value of centralized PCR procurement and mono-material construction that protects end-of-life recyclability. These converging rules and case studies increase confidence that content claims can be verified and defended in audits across channels. The flower pots and planters industry is therefore standardizing around traceable feedstock and clear labeling to future-proof assortments and pricing.
Ceramic and terracotta retain relevance where thermal mass, patina, and longevity are valued in public streetscapes and heritage settings. Energy intensity is the pressure point, which is why national policy reducing network charges for energy-intensive industries matters for medium-term viability. This relief aligns with private investment in electric kilns that can achieve very large emissions reductions and support compliance under tighter trading schemes. Metal planters maintain a niche in architectural projects, while certified wood options support natural-wood aesthetics with controlled sourcing. Bio-composites enter commercial assortments as UV and frost validation completes and as agricultural byproduct streams become reliable. Over the forecast horizon, verified PCR and bio-based inputs will expand their role in the flower pots and planters market as procurement policies and retailer scorecards embed them in standard buying criteria.


By Product Type: Smart and Self-Watering Containers Outpace Traditional Pots on Automation Value Proposition
Traditional pots accounted for 45.7% in 2025, while self-watering and smart containers are projected to grow at a 10.55% CAGR through 2031, supported by proven water-use and labor benefits. Self-watering reservoirs, moisture indicators, and integrated sensors reduce guesswork and missed irrigation windows for residential buyers and property managers. Leading brands have expanded self-watering lines and introduced visible indicators that simplify upkeep, which builds adoption among first-time gardeners. Product quality is now tied to seal integrity, UV stability, and capillary-wick performance, documented through QA systems that meet ISO requirements in commercial tenders. The flower pots and planters market share will track how quickly automation features filter into mainstream price bands where replacement cycles are steady. As interoperability improves, smart variants will stack on top of these gains with telemetry and better battery life.
Planter boxes, troughs, and raised beds power balcony kitchens and small-plot urban growing where depth, modularity, and airflow matter. Hanging baskets maintain presence, especially where early spring promotions move the season forward in cooler climates. Municipal buyers use large-format planters for curb protection, traffic calming, and stormwater management, and these applications reward impact resistance and serviceable irrigation. Vendors that document repeatability with ISO 9001 and environmental practices with ISO 14001 have an advantage in those procurements. Brands that focus on minimal parts, mono-material designs, and refillable accessories can simplify maintenance and recycling. Over time, these features compound across the flower pots and planters Market as both home and public buyers look for visible value and simple care.
By Application: Commercial and Municipal Segments Capitalize on Climate-Adaptation Budgets
Residential uses captured 61.9% in 2025, and commercial plus municipal applications are projected to expand at an 8.69% CAGR through 2031 as cities fund cooling, shade, and pedestrian safety. Mega-projects like Green Riyadh supply large, steady orders and define specifications for heat, UV, and wind conditions that guide product engineering. City agencies in North America continue to allocate targeted funds for curb and sidewalk improvements that incorporate containerized trees and shrubs. In Europe, cost relief for energy-intensive ceramics supports the choice of terracotta in high-traffic, heritage districts that prioritize longevity and appearance. National or provincial land-greening programs add upstream demand for containerized saplings in nurseries and logistics operations. These layers make the flower pots and planters market less dependent on household cycles in regions with active public greening agendas.
RFP language now cites quality and environmental management standards more often and includes accessibility requirements for raised beds in public spaces. Municipal buyers look for parts commonality and serviceable components to reduce downtime and waste. For commercial real estate, automated irrigation and water retention reduce service visits and protect plant health in variable weather. Residential buyers continue to drive aesthetic variety and quick-turn replacement that keeps the assortment breadth wide. Each of these buyer sets drives different evidence requirements, and vendors that package that proof elegantly in product pages and bid documents will move faster. The flower pots and planters industry aligns design and documentation to meet these diverse and growing needs.
By Distribution Channel: Offline Outlets Leverage Tactile Discovery While Online Platforms Capture Pre-Season Research and Clearance
Offline accounted for 75.8% in 2025, while online is projected to post a 9.58% CAGR through 2031, which confirms that physical discovery remains central even as digital gathers pace. Stores that combine inspirational vignettes with knowledgeable staff convert larger, heavier purchases that require touch and inspection. Online adds scale for research, assortment depth, and clearance flow, and improves access for customers who rely on accessible content and accurate dimensions. Accessibility rules in the European Union have improved the baseline for content governance, which favors retailers that invest in compliance-ready platforms and product data. Click-and-collect and local delivery support bulky purchases without long lead times, which is important during narrow planting windows. The flower pots and planters market rewards retailers that connect showroom curation, online visualization, and fast fulfillment into a single experience.
Specialty décor stores, nurseries, and garden centers offer tailored advice and plant compatibility guidance that reduces returns and raises basket size. Supermarkets and hypermarkets offer convenient attached sales but tend to focus on smaller sizes and seasonal displays. Assortment decisions follow regional weather and planting calendars, which reduces waste when planning is precise. Supplier scorecards in major chains reference ISO 9001 and ISO 14001, which elevate QA and environmental reporting. Vendors that support both brick-and-mortar and online partners with strong content, packaging, and supply reliability gain year-round share. This playbook is now standard for growth in the flower pots and planters market.
Geography Analysis
North America held 32.8% in 2025, and Asia-Pacific is projected to expand at a 9.92% CAGR through 2031, which sets the pace differential for regional planning. North America’s share of the flower pots and planters market size stood at 32.8% in 2025, while Asia-Pacific’s faster growth profile is anchored by urbanizing corridors and public greening. The United States municipal projects, including targeted curb-zone enhancements, use planters for safety, wayfinding, and stormwater objectives. State-level PCR mandates and defined penalties incentivize recycled feedstock and mono-material designs. In Canada and Mexico, short planting windows and middle-class expansion sustain demand across premium and value tiers. These patterns confirm that the flower pots and planters market will remain diverse in regional product mixes and buying cycles.
Europe’s regulatory path is clear, and effective dates now fall within the planning horizon for procurement and packaging. The EU Packaging and Packaging Waste Regulation formalizes recycled content goals and pushes mono-material designs that preserve recyclability. The United Kingdom's decision to extend discounted network charges for energy-intensive sectors supports ceramic and terracotta supply economics. European heritage districts often prefer terracotta for streetscapes, which benefits from both energy relief and private investment in electrification that improves emissions outcomes. Northern and Western European countries with high garden ownership create stable household demand alongside municipal plantings. As a result, the flower pots and planters market in Europe blends steady retail flow with procurement anchored by compliance and durability.
Asia-Pacific leads the growth tables as city governments and private developers integrate greenery into built environments. Policy continuity in China on land greening extends momentum for nurseries and urban plantings, which drives container demand upstream and downstream. Singapore’s urban greenery systems and new indoor farms show how automated planters and telemetry can scale where space is tight. In the Middle East, Saudi Arabia’s city-scale program adds volume and sets high durability and heat-resistance requirements for products. Select African municipalities and fast-growing cities are beginning to adopt streetscape and micro-forest programs where containerized trees can be deployed quickly. Together, these programs shape the flower pots and planters market with high-visibility installs that influence consumer preferences and retail displays.

Competitive Landscape
The flower pots and planters market remains moderately fragmented with rising compliance and technology requirements that reward scale and discipline. Producers that fully converted to recycled feedstock while maintaining design breadth now differentiate on verified impact and reliable QA. Documented performance around carbon intensity, recyclability, and safety is converting into shelf and bid advantages as retailers and cities raise standards. A notable United States platform merger created HCxCHG with commitments on recycled content across SKUs, which aligns with state mandates and retailer scorecards. Programs that recover used plastic pots in partnership with retailers demonstrate how reverse logistics can seed PCR supply and support brand storytelling. These moves define a playbook built on feedstock control, process energy improvements, and clear digital product data.
Energy transition investments are visible across ceramics and clay-based containers, where kiln electrification yields significant emissions reductions. One leading brick and ceramic company reported a major electrification project with very large emissions cuts, an outcome that supports tenders with sustainability scoring. Government relief on network charges for energy-intensive manufacturing reduces overhead and helps preserve European capacity. This combination of public support and private capex is shaping how terracotta remains relevant in municipal settings. Vendors that complement these steps with ISO 50001 energy-management systems and public reporting will stand out in future RFPs. The flower pots and planters market thus aligns capital allocation with compliance visibility and downstream adoption.
Product innovation is now centered on automation, maintenance simplicity, and verified claims rather than aesthetics alone. Brands are launching self-watering pots with clear moisture indicators, and they are layering connected features on top of reservoir designs. Distribution expansions into new geographies deepen access to design-conscious segments, while safety and environmental certifications expand participation in commercial RFPs. Award recognition for composters and sustainability campaigns further signals retailer and consumer resonance for verified environmental performance. Energy supply shifts, including new LNG export capacity, can indirectly stabilize input costs for plastics value chains in North America. These strategies keep the flower pots and planters market focused on proven value, operational reliability, and compliance-ready documentation.
Flower Pots And Planters Industry Leaders
Keter Group
elho B.V.
Deroma Group
The HC Companies, Inc.
LECHUZA (Geobra Brandstätter)
- *Disclaimer: Major Players sorted in no particular order

Recent Industry Developments
- March 2026: Polypropylene resin prices surged 12.52% month-over-month to 7,484 CNY (USD 1,068.9) per tonne due to the Strait of Hormuz closure disrupting naphtha feedstock flows to Asian crackers, forcing injection molders to absorb margin compression or accelerate post-consumer recycled feedstock substitution.
- March 2026: Indonesia's PT Chandra Asri declared force majeure on 590,000 tonnes per year of polypropylene capacity, exacerbating Asian resin-supply tightness and prompting Indian Oil Corporation to raise PP and PE prices by INR 6,000 (USD 66.78) per metric tonne on March 3.
- December 2025: Nuova Deroma S.p.A. (Deroma Group) officially obtained ISO 45001 certification for its Occupational Health and Safety Management System.
- April 2024: HC Companies and Classic Home and Garden merged and rebranded as Growscape, creating a one-stop shop for the North American horticulture market by combining United States manufacturing with global sourcing.


Global Flower Pots And Planters Market Report Scope
The flower pots and planters market refers to the industry involved in the manufacturing, distribution, and retailing of containers designed to hold and display plants, flowers, and other greenery. These products serve both practical and decorative purposes, allowing individuals to grow and showcase plants in various indoor and outdoor settings.
The flower pots and planters market is segmented by material, product type, application, distribution channel, and geography. By material, the market is sub-segmented into plastic, ceramic and terracotta, metal, wood, bio-composite, and recycled materials. By product type, the market is sub-segmented into flower pots, planters, hanging baskets, and self-watering and smart containers. By application, the market is sub-segmented into residential, commercial, and municipal. By distribution channel, the market is sub-segmented into offline and online retail. By geography, the market is sub-segmented into North America, South America, Europe, Asia-Pacific, and the Middle East and Africa. The report offers market size and forecasts for the flower pots and planters market in value (USD) for all the above segments.
| Plastic |
| Ceramic & Terracotta |
| Metal |
| Wood |
| Bio-composite & Recycled |
| Flower Pots |
| Planters (Boxes, Troughs, Raised Beds) |
| Hanging Baskets |
| Self-watering / Smart Containers |
| Residential |
| Commercial & Municipal |
| Offline | Home-Improvement & DIY Chains |
| Specialty Décor & Furniture Stores | |
| Nurseries & Garden Centers | |
| Supermarkets & Hypermarkets | |
| Online Retail |
| North America | United States |
| Canada | |
| Mexico | |
| South America | Brazil |
| Peru | |
| Chile | |
| Argentina | |
| Rest of South America | |
| Europe | United Kingdom |
| Germany | |
| France | |
| Spain | |
| Italy | |
| BENELUX | |
| NORDICS | |
| Rest of Europe | |
| Asia-Pacific | India |
| China | |
| Japan | |
| Australia | |
| South Korea | |
| South-East Asia | |
| Rest of Asia-Pacific | |
| Middle East & Africa | United Arab Emirates |
| Saudi Arabia | |
| South Africa | |
| Nigeria | |
| Rest of Middle East & Africa |
| By Material | Plastic | |
| Ceramic & Terracotta | ||
| Metal | ||
| Wood | ||
| Bio-composite & Recycled | ||
| By Product Type | Flower Pots | |
| Planters (Boxes, Troughs, Raised Beds) | ||
| Hanging Baskets | ||
| Self-watering / Smart Containers | ||
| By Application | Residential | |
| Commercial & Municipal | ||
| By Distribution Channel | Offline | Home-Improvement & DIY Chains |
| Specialty Décor & Furniture Stores | ||
| Nurseries & Garden Centers | ||
| Supermarkets & Hypermarkets | ||
| Online Retail | ||
| By Geography | North America | United States |
| Canada | ||
| Mexico | ||
| South America | Brazil | |
| Peru | ||
| Chile | ||
| Argentina | ||
| Rest of South America | ||
| Europe | United Kingdom | |
| Germany | ||
| France | ||
| Spain | ||
| Italy | ||
| BENELUX | ||
| NORDICS | ||
| Rest of Europe | ||
| Asia-Pacific | India | |
| China | ||
| Japan | ||
| Australia | ||
| South Korea | ||
| South-East Asia | ||
| Rest of Asia-Pacific | ||
| Middle East & Africa | United Arab Emirates | |
| Saudi Arabia | ||
| South Africa | ||
| Nigeria | ||
| Rest of Middle East & Africa | ||


Key Questions Answered in the Report
What is the growth outlook and CAGR for the Flower Pots and Planters Market to 2031?
The flower pots and planters market size is expected to reach USD 2.37 billion by 2031 at an 8.58% CAGR over 2026-2031.
Which material segment leads and which one grows fastest by 2031?
Plastic led with a 51.05% share in 2025, while bio-composite and recycled materials are projected to record a 9.75% CAGR to 2031.
Which product type is gaining momentum relative to traditional pots?
Self-watering and smart containers are projected to expand at a 10.55% CAGR through 2031, outpacing traditional pots that still hold the largest base.
How are channels shifting between offline and online?
Offline accounted for 75.8% in 2025, while online is projected to grow at a 9.58% CAGR, which underscores the importance of omnichannel execution.
Which region holds the largest share and which grows fastest?
North America held 32.8% in 2025, and Asia-Pacific is projected to be the fastest-growing region at 9.92% CAGR through 2031.
What regulations most influence recycled content and design choices?
The EU Packaging and Packaging Waste Regulation, effective August 2026, and United States PCR mandates, including California’s program, are shaping mono-material designs and traceable recycled content.
Page last updated on:


