Flow Sensors Market Size and Share
Market Overview
| Study Period | 2020 - 2031 |
|---|---|
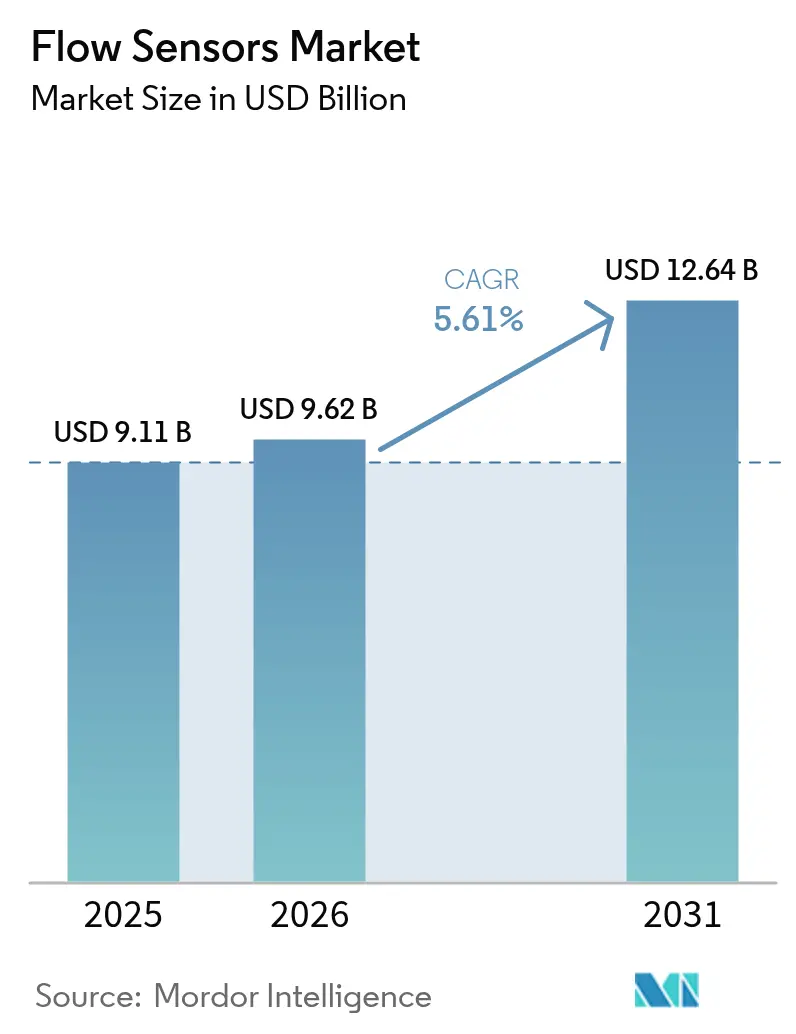
| Market Size (2026) | USD 9.62 Billion |
| Market Size (2031) | USD 12.64 Billion |
| Growth Rate (2026 - 2031) | 5.61% CAGR |
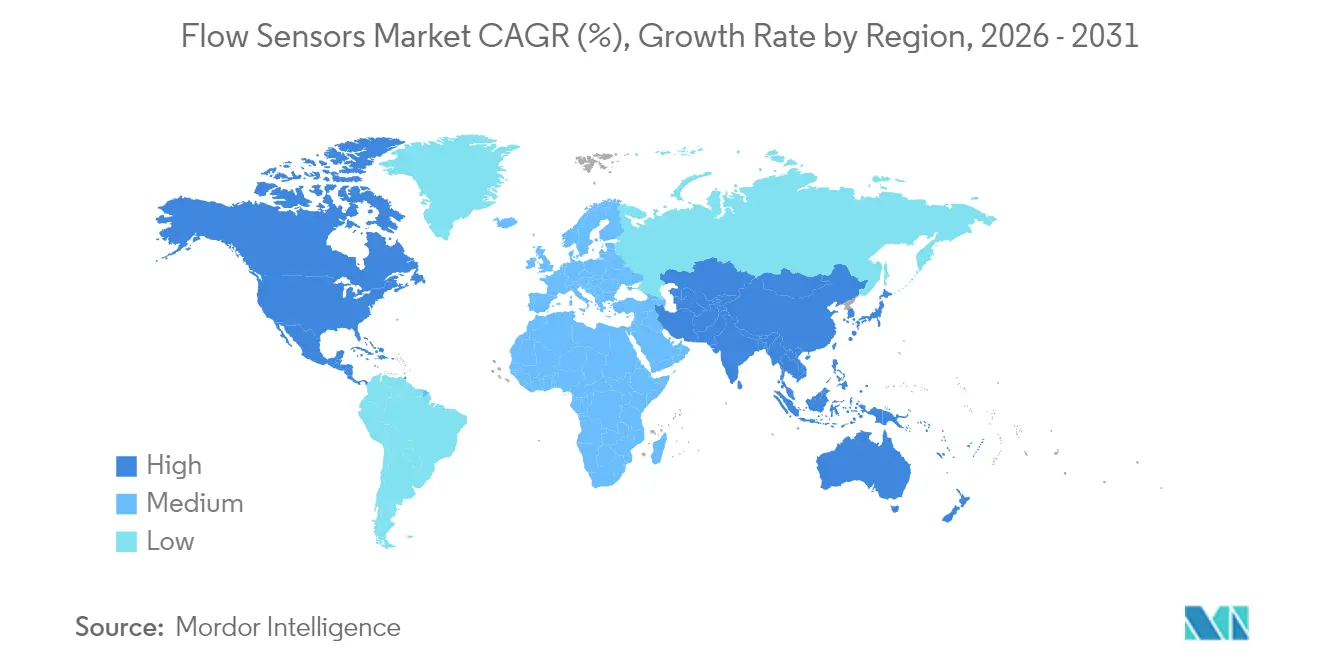
| Fastest Growing Market | Asia Pacific |
| Largest Market | North America |
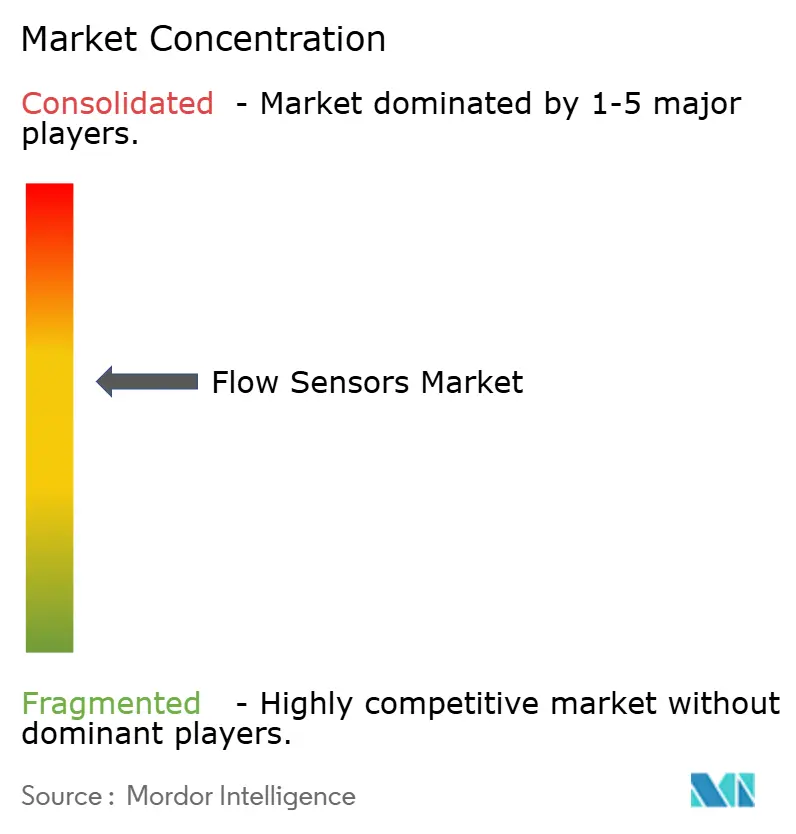
| Market Concentration | Medium |
Major Players *Disclaimer: Major Players sorted in no particular order Image © Mordor Intelligence. Reuse requires attribution under CC BY 4.0. | |
Flow Sensors Market Analysis by Mordor Intelligence
The flow sensors market size was valued at USD 9.11 billion in 2025 and estimated to grow from USD 9.62 billion in 2026 to reach USD 12.64 billion by 2031, at a CAGR of 5.61% during the forecast period (2026-2031). Growth rests on rising digitalization across process industries, mandatory leak-detection rules in cross-border pipelines, and large-scale desalination investments that demand accurate, real-time measurement. Ultrasonic innovation, clamp-on retrofits, and IIoT connectivity shorten installation times, improve uptime, and help operators comply with evolving custody-transfer and environmental standards. At the same time, semiconductor shortages and high capital requirements for large-diameter Coriolis meters constrain the pace of adoption, nudging suppliers to redesign products around more readily available chipsets.
North America commands the largest revenue share because of strict pipeline safety mandates and aggressive smart-water rollouts, while Asia-Pacific records the fastest growth on the back of multi-billion-dollar manufacturing upgrades in China and India. Water and wastewater utilities represent the fastest-expanding end-user group as utilities prioritize non-revenue water reduction and asset reliability. Competition is intensifying: incumbents acquire niche ultrasonic specialists, launch IIoT service layers, and forge alliances to secure share in a market where data-as-a-service and miniaturized MEMS designs redefine value delivery.
Key Report Takeaways
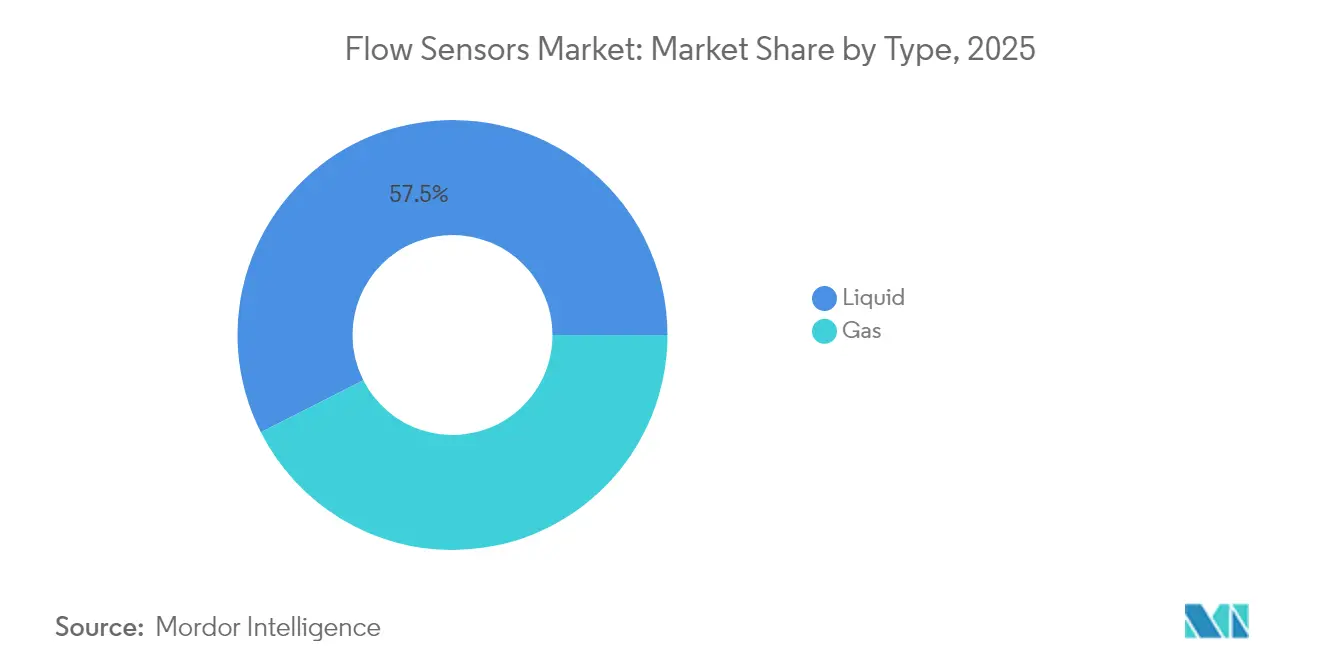
- By type, liquid applications held 57.48% of the flow sensors market share in 2025, while gas applications trail; liquid flow measurement is forecast to expand at a 6.78% CAGR through 2031.
- By technology, differential-pressure sensors led with 30.62% revenue share in 2025, whereas ultrasonic sensors post the highest 7.02% CAGR through 2031.
- By installation type, inline meters accounted for 47.85% of revenue in 2025; clamp-on solutions are poised for the fastest 7.15% CAGR thanks to retrofit demand.
- By end-user industry, chemical & petrochemical processes captured 29.84% share in 2025, while water & wastewater applications will grow the quickest at 7.12% CAGR.
- By geography, North America dominated with 33.92% share in 2025, whereas Asia-Pacific is projected to be the fastest-growing region at a 6.24% CAGR.
Note: Market size and forecast figures in this report are generated using Mordor Intelligence’s proprietary estimation framework, updated with the latest available data and insights as of 2026.
Global Flow Sensors Market Trends and Insights
Drivers Impact Analysis*
| Driver | (~) % Impact on CAGR Forecast | Geographic Relevance | Impact Timeline |
|---|---|---|---|
| Increasing adoption of smart and IIoT-enabled flow metering solutions | +1.2% | Global (Asia-Pacific leads) | Medium term (2-4 years) |
| Surging demand for non-invasive clamp-on ultrasonic meters in retrofit projects | +0.9% | North America and EU; expanding to Asia-Pacific | Short term (≤ 2 years) |
| Mandatory leak-detection regulations in cross-border oil and gas pipelines | +0.8% | Global; focus on North America | Long term (≥ 4 years) |
| Rapid expansion of desalination and reuse plants in water-stressed economies | +0.7% | Middle East and North Africa; spillover to Asia-Pacific | Medium term (2-4 years) |
| Miniaturized MEMS flow sensors for single-use bioprocessing equipment | +0.4% | North America and EU biotech hubs | Long term (≥ 4 years) |
| Data-as-a-service business models creating recurring revenue | +0.3% | Global; early adoption in developed markets | Long term (≥ 4 years) |
| Source: Mordor Intelligence | |||
Increasing adoption of smart and IIoT-enabled flow metering solutions
Edge-ready sensors from suppliers such as KROHNE merge valve actuation with embedded flow, pressure, and temperature measurement, letting operators shift from reactive checks to predictive upkeep. Facilities that fitted IIoT-enabled sensors cut unplanned downtime by up to 30% because anomalies surfaced early. Local data processing lowers network load and empowers real-time safety actions. However, recent discoveries of remote-execution flaws in ABB TotalFlow computers spotlight cyber risks and underscore the need for hardened security frameworks.
Surging demand for non-invasive clamp-on ultrasonic meters in retrofit projects
Clamp-on units avoid pipe cutting and finish installation in roughly 30 minutes, a sharp contrast to multi-day inline retrofits[1]Badger Meter, “Clamp-On Ultrasonic Meter Installation Guide,” badgermeter.com. Power plants and chemical sites now favor the technology to refresh legacy lines without halts. Emerson’s FLUXUS series handles –200 °C to +630 °C, proving suitability in cryogenic and high-temperature duties. Automated meter verification permits on-site health checks, trimming maintenance hours and further boosting total asset utilization.
Mandatory leak-detection regulations in cross-border oil and gas pipelines
PHMSA’s updated rules oblige operators to install advanced detection programs and run frequent surveys, unlocking an estimated USD 341–1,440 million in annual benefits from safer operations. Continuous, real-time monitoring is now a compliance baseline, raising demand for highly accurate sensors that transmit data without latency. Harmonized U.S.-Canada standards simplify supplier certification while broadening total addressable opportunity. Technologies that combine leak sensing with methane-emissions tracking gain preference because of parallel climate targets.
Rapid expansion of desalination and reuse plants in water-stressed economies
Additional global desalination capacity will climb from 45 million to 61 million m³ per day by 2027, pushing orders for flow sensors that resist high salinity and pressure. The USD 1.9 billion Barka 5 facility in Oman and Dubai’s Hassyan plant both rely on electromagnetic and ultrasonic meters to maintain efficiency in reverse-osmosis processes. As renewables power a growing share of desalination, sensors must deliver stability under fluctuating energy inputs, favoring designs with wide turndown ratios and firmware-based signal compensation.
Restraints Impact Analysis*
| Restraint | (~) % Impact on CAGR Forecast | Geographic Relevance | Impact Timeline |
|---|---|---|---|
| High CapEx for Coriolis meters in large-diameter custody-transfer lines | –0.8% | Global; oil and gas focus | Medium term (2-4 years) |
| Scarcity of skilled calibration labs in emerging countries | –0.5% | Asia-Pacific, Africa, Latin America | Long term (≥ 4 years) |
| Cyber-security vulnerabilities in wireless flow-meter networks | –0.4% | Global critical infrastructure | Short term (≤ 2 years) |
| Supply-chain volatility for critical semiconductor chips | –0.6% | Global, Asia-Pacific manufacturing hubs | Medium term (2-4 years) |
| Source: Mordor Intelligence | |||
High CapEx for Coriolis meters in large-diameter custody-transfer lines
Each large-bore Coriolis installation can exceed USD 100,000, straining project budgets. Operators weigh the premium against alternative ultrasonic or differential-pressure options that cost less but deliver lower accuracy. Leasing models and outcome-based contracts offer relief, yet many custody-transfer codes enforce Coriolis-level precision, sustaining demand despite cost hurdles.
Supply-chain volatility for critical semiconductor chips
Lead times topping 40 weeks disrupt production of smart flow sensors. Contract manufacturers in Greater China dominate advanced microcontroller output, exposing OEMs to geopolitical shocks. Sensirion trimmed lead times by redesigning boards around multi-source chips, illustrating how component standardization mitigates risk. Persistent shortages push suppliers to balance feature sets against availability, occasionally delaying launches of next-generation wireless or AI-ready models.
*Our forecasts treat driver/restraint impacts as directional, not additive. The impact forecasts reflect baseline growth, mix effects, and variable interactions.
Segment Analysis
By Type - Liquid applications drive market expansion
Liquid measurement held 57.48% of the flow sensors market in 2025 and is projected to grow at a 6.78% CAGR. Utility-scale smart-water projects boost demand, with Moulton Niguel Water District’s 55,000-meter rollout saving 500 million gallons annually mnwd.com. Electromagnetic variants remain dominant for conductive fluids, while ultrasonic sensors gain share in low-conductivity or slurry settings. On the gas side, pipeline monitoring and industrial combustion control sustain steady revenue, but lower growth keeps its contribution below the liquid segment.
Smart city mandates accelerate liquid adoption by compelling utilities to lower non-revenue water. Cary, North Carolina’s USD 18 million AMI platform eliminated 71,000 truck miles each year, demonstrating service cost reductions and emissions cuts. Chemical processors and breweries also propel liquid installations, particularly where sanitary standards or aggressive media require fully welded stainless-steel flow paths.


By Technology - Ultrasonic innovation reshapes the landscape
Differential-pressure devices still represent the largest revenue block at 30.62%, anchored by decades of installed base and favorable life-cycle economics. Yet ultrasonic sensors deliver the fastest 7.02% CAGR because clamp-on form factors reduce downtime, and advanced signal algorithms trim measurement error to 1%. The flow sensors market size tied to ultrasonic devices is positioned for double-digit gains in retrofit heavy industries through 2031.
Coriolis meters maintain premium status for multi-parameter measurement where density and mass flow are critical, while vortex and thermal variants address steam lines and low-flow gas applications. Magnetic sensors stay popular in water utilities and pulp plants due to zero pressure drop and corrosion-resistant liners. Integration of self-verification firmware across most technologies boosts operator confidence and lowers recalibration spend.
By Installation Type - Clamp-on technology transforms retrofits
Inline systems accounted for 47.85% revenue in 2025, favored in new plants that embed meters during construction. However, clamp-on deployments are set to chart the highest 7.15% CAGR as brownfield sites sidestep production outages. The flow sensors market size linked to clamp-on solutions grows steadily as operators in oil, chemical, and hydropower settings prioritize minimal intrusion and faster regulatory sign-off.
Insertion-type probes fill a cost-sensitive niche for large-diameter pipes across district energy and municipal water. Although they introduce slight pressure drop, their economic advantage in very large bores sustains adoption particularly in emerging regions with tight capital budgets.

By End-user Industry - Water sector leads the digital shift
Chemical and petrochemical plants captured 29.84% of 2025 revenue on the back of safety rules mandating continuous flow checks for hazardous media. Yet the water and wastewater segment expands the fastest at 7.12% CAGR, fueled by regulatory directives that push utilities to curb losses and expand reuse. For instance, the American Water Works Association projects USD 1 trillion in pipe and meter upgrades, creating a sizable pipeline for sensor suppliers.
Pharmaceutical bioprocessing now adopts single-use MEMS sensors compatible with sterilization cycles. Power generation seeks higher accuracy to boost turbine efficiencies, while food and beverage plants lean on sanitary-design Coriolis and magnetic meters for CIP-ready operations.
Geography Analysis
North America controlled 33.92% of 2025 revenue thanks to PHMSA’s stringent leak-detection rules and significant smart-water grants. Austin Water’s USD 80.2 million meter modernization illustrates how infrastructure packages unlock multi-year sensor procurement. Federal incentives for methane-reduction technologies further raise spending by pipeline operators on high-precision sensors that feed automated alert systems.
Asia-Pacific records a 6.24% CAGR, the highest worldwide. Annual investments topping USD 1.7 billion in Chinese and Indian automation projects spur demand across automotive paint shops, chemical complexes, and electronics fabs. Local vendors challenge global incumbents with price-competitive inline magmeters and simple vortex models, forcing multinationals to sharpen local support and value-added analytics. Southeast Asia benefits from electronics and battery gigafactory inflows that require tight flow control in ultrapure water and chemical lines.
Europe posts stable, regulation-led demand as the revised wastewater directive tightens discharge norms, compelling municipalities to fit continuous monitoring. Middle East and Africa see double-digit spending on desalination megaprojects such as Oman’s Barka 5 that depend on corrosion-resistant flow solutions. In South America, sensor uptake is tied to Brazil’s sanitation concessions and Argentina’s LNG terminal expansions, both of which demand reliable measurement under harsh process conditions.

Regulatory Landscape
Regulation shaping flow-sensor adoption increasingly combines measurement assurance with digital traceability. In June 2026, Saudi Standards, Metrology and Quality Organization (SASO) issued a mandatory notice requiring imported industrial flowmeters (including Coriolis, electromagnetic, and ultrasonic) to complete AI-driven on-site calibration verification starting August 1, 2026, with documentation uploaded to the national metrology platform. This shifts compliance readiness and adds after-import service needs for suppliers serving the Kingdom.
Standards and trade policy also influence product design and sourcing. The IEC published IEC 60730-2-15:2026 on April 10, 2026, setting requirements for automatic electrical air and water flow sensing controls that support harmonized safety and performance expectations for OEM integrations. On the supply side, the United States implemented a 25% ad valorem duty effective January 15, 2026, on specific imported semiconductors and derivative products under Section 232, increasing the importance of multi-sourcing and redesign efforts for IIoT-enabled flow transmitters that depend on microcontrollers and connectivity chipsets.
Value Chain Analysis
The flow sensors value chain starts with critical inputs (semiconductor devices, magnets and coils for electromagnetic designs, piezo elements for ultrasonic, precision machined flow bodies, and wetted-material liners and seals), then moves through sensor and transmitter design, calibration, and assembly by OEMs, followed by distribution via automation channel partners and EPCs into end-user projects. Calibration and conformity assessment remains a key value-add step, especially for custody-transfer and regulated applications, and supports recurring revenue through verification, recertification, and field services.
Downstream, the chain is increasingly shaped by software and connectivity partners that turn measurement into operational workflows. Examples include SPX FLOW and Siemens collaborating (January 2025) on digital twin and AI-driven product design demonstrations for autonomous fluid processing, and LPWAN deployments such as Netmore partnering with Detectronic (August 2025) to roll out large-scale wastewater monitoring across a utility network. In parallel, solution providers integrate flow-related sensing into process-optimization stacks, illustrated by Ecolab launching CIP IQ with 4T2 Sensors (September 2025) to reduce resource use in clean-in-place operations and tighten the linkage between instrumentation, analytics, and outcome-based service delivery.
Competitive Landscape
Market concentration is moderate. Emerson’s purchase of Flexim extends its ultrasonic reach, while the SICK-Endress+Hauser joint venture pools 800 specialists to accelerate gas analytics. ABB widened smart-building access through a wiring-accessory buy in China, improving channel coverage for low-voltage flow products used in HVAC balancing.
Strategic themes now favor vertical integration of hardware, software, and services. Ecolab’s flow intelligence platform demonstrates 15% water savings, showing why data-as-a-service unlocks sticky revenue in a hardware-heavy domain. Baker Hughes off-loaded its instrumentation arm to Crane Company for USD 1.15 billion, sharpening its energy transition roadmap while giving Crane a diversified sensor offering.
Innovation pipelines revolve around AI-assisted diagnostics, silicon photonics for multi-parameter sensing, and additive-manufactured flow bodies that reduce pressure loss. Emerging MEMS specialists tap biopharma growth with sterile single-use chips, and IoT platform players bundle predictive analytics that spot fouling before it degrades throughput. Competitive intensity will hinge on how effectively firms embed cybersecurity and analytics without bloating total cost of ownership.
Flow Sensors Industry Leaders
Siemens AG
Emerson Electric Co.
ABB Ltd.
Honeywell International Inc.
Yokogawa Electric Corporation
- *Disclaimer: Major Players sorted in no particular order

Market Opportunities and Future Outlook
Utility modernization and water-stress programs are creating whitespace for flow sensing that is fast to deploy and easy to integrate into smart-water operations. Large smart-meter and network programs cited in the report, such as Austin Water's USD 80.2 million meter modernization and Moulton Niguel Water District's 55,000-meter rollout, show procurement pathways where electromagnetic and ultrasonic technologies pair with leak analytics to reduce non-revenue water and improve asset reliability. At the plant level, non-invasive clamp-on ultrasonic retrofits that compress installation into short maintenance windows broaden addressable brownfield lines across chemicals, power, and water treatment, particularly where avoiding shutdowns is a gating constraint.
Opportunities also expand where customers require multi-protocol connectivity and verification-ready measurement to fit into IIoT and compliance workflows. Product moves such as ABB's next-generation ProcessMaster and AquaMaster electromagnetic flow meters (August 2024) with IoT connectivity, and large-scale sewer monitoring deployments using LoRaWAN (e.g., Netmore and Detectronic, August 2025) show flow-adjacent sensing networks being operationalized at scale. Material and sustainability-driven redesigns provide another adoption lever in water and slurry duties, reinforced by PFAS-related scrutiny that is pushing suppliers to qualify alternative liners and wetted materials without sacrificing durability or metrology stability.
Recent Industry Developments
- July 2026: Emerson introduced next-generation portable ultrasonic flow meters to increase measurement visibility across plants. The upgrade supports faster diagnostics and temporary verification use cases, helping operators validate flow performance without installing permanent inline instruments.
- April 2025: Emerson launched the Flexim FLUXUS/PIOX 731 series of non-intrusive, clamp-on ultrasonic flow meters for liquids and gases. Expanding the clamp-on portfolio strengthens retrofit economics for customers that need accurate measurement while avoiding pipe cutting and extended downtime.
- March 2024: Siemens upgraded its SITRANS FC Coriolis mass flowmeter portfolio with new models across multiple series. The broader lineup improves fit across process conditions and reinforces Coriolis positioning in applications that prioritize mass flow accuracy and multi-parameter measurement.


Research Methodology Framework and Report Scope
Market Definition and Coverage
The flow sensor market, for our sizing work, includes devices that detect and measure liquid or gas flow rate and are sold as standalone sensors or as part of flow measurement assemblies used across industrial and commercial settings.
Scope exclusions: We exclude broader process instrumentation bundles, unrelated pressure or level sensors sold without a flow sensing function, and pure installation or calibration-only services when they are billed separately.
Segmentation Overview
- By Type
- Liquid
- Gas
- By Technology
- Coriolis
- Differential Pressure
- Ultrasonic
- Vortex
- Thermal
- Magnetic
- By Installation Type
- Inline
- Clamp-on
- Insertion
- By End-user Industry
- Oil and Gas
- Water and Wastewater
- Chemical and Petrochemical
- Food and Beverage
- Power Generation
- Pulp and Paper
- Pharmaceuticals
- Other Industries
- By Geography
- North America
- United States
- Canada
- Mexico
- South America
- Brazil
- Argentina
- Rest of South America
- Europe
- United Kingdom
- Germany
- France
- Italy
- Spain
- Nordics
- Rest of Europe
- Middle East and Africa
- Middle East
- Saudi Arabia
- United Arab Emirates
- Turkey
- Rest of Middle East
- Africa
- South Africa
- Egypt
- Nigeria
- Rest of Africa
- Middle East
- Asia-Pacific
- China
- India
- Japan
- South Korea
- ASEAN
- Australia
- New Zealand
- Rest of Asia-Pacific
- North America
Data Sources, Market Sizing, and Validation
Desk Research
Desk research starts with building the demand and supply context, then pinning down what is counted as a flow sensor versus adjacent measurement hardware. We typically lean on public sources such as US Census Bureau manufacturing data, US International Trade Commission trade statistics, Eurostat, UN Comtrade, and International Energy Agency indicators to understand industrial activity patterns that pull flow measurement demand.
To translate that context into usable model inputs, we also review company annual reports, investor presentations, product documentation, and credible press coverage to map technology mixes and end-market exposure. When helpful, paid subscriptions for company financials and intelligence, patent databases, and shipment-level import or export data are used to cross-check trends and pricing direction without depending on one single source. The desk sources mentioned here are illustrative, and many other references are also used for data collection, validation, and clarification.
Primary Interviews and Surveys
Primary work is used to pressure-test the desk assumptions and close gaps around price ranges, replacement cycles, and how demand shifts between inline, clamp-on, and insertion setups. We speak with manufacturers, distributors, system integrators, and end users across process industries, and global coverage is balanced so regional installation norms and industry investment cycles are properly reflected.
Distribution of primary research fieldwork respondents
| Company type | Respondent position | Region |
|---|---|---|
| Top tier: 36% | CXOs: 19% | APAC: 49% |
| Mid tier: 44% | Functional/Unit leaders: 28% | EMEA: 29% |
| Smaller Players: 20% | Managers: 53% | Americas: 22% |
Market-Sizing & Forecasting
The core model is built using a top-down approach where industrial output signals and trade flows are used to reconstruct the addressable demand pool for flow sensing by key end uses, and then it is translated into value using blended price bands by technology. Results are then checked with selective bottom-up approximations, such as sampled ASP times unit volumes for common use cases, and distributor or integrator channel checks, which helps us adjust totals when the first pass looks off.
Inputs used in the model include indicators like oil and gas project activity, water and wastewater treatment capacity additions, chemical and petrochemical output trends, power generation retrofit intensity, and the pace of industrial automation upgrades that drive sensor refresh. Pricing logic is also guided by technology mix shifts (for example, ultrasonic and clamp-on adoption) and by how customers trade off accuracy, installation downtime, and maintenance needs.
For forecasting, we rely on scenario analysis supported by expert views on capital spending cycles and replacement demand, and then we apply measured adoption curves by end use to avoid overstating short-term step changes. Where local data is thin, gaps are handled by using regional proxy indicators and then re-testing the implied volumes and prices with interview feedback before the final run is locked.
Data Validation & Update Cycle
Outputs are validated through multiple passes that compare model totals against independent market signals, including trade direction, industrial production momentum, and reported automation investment trends. If a region or end use shows a jump that does not match these external indicators, assumptions on pricing, mix, or adoption are revisited and, when needed, respondents are re-contacted for clarification.
Before sign-off, the model is reviewed by another analyst to catch variance drivers and to confirm that definitions stayed consistent across years. Reports are refreshed annually, and interim updates are made when material events occur that can change demand, pricing, or supply availability. Right before delivery, a final pass is completed so clients receive the latest updated view.
Mordor Intelligence's Flow Sensor Market Estimate Compared With Other Published Estimates
Published market sizes for flow sensors often differ because groups do not count the same things, and they also do not anchor pricing and volume on the same time window. The gap is usually created by scope choices, the way technology mix is treated, and how quickly the numbers are refreshed when industrial spending shifts.
The main gap comes from whether the estimate counts full flow meter assemblies and broader instrumentation packages, or keeps the value limited to flow sensor components and related sensing elements, and then prices them using a consistent mix by technology and installation type. That scope choice, combined with how currency timing and inflation are handled and whether primary checks are used to verify replacement cycles, can move the total meaningfully. In this context, Mordor Intelligence keeps the market tied to liquid and gas flow sensors and re-tests ASP bands and end-use adoption assumptions through interviews before finalizing the year value.
Benchmark comparison
| Source | Market Size | Gaps in Research Methodology |
|---|---|---|
| Mordor Intelligence | USD 9.62 B (2026) | |
| Industry Publisher A | USD 10.17 B (2025) | Uses a different base year and may include a wider application scope and technology grouping, which can lift the value when more digital or HVAC-linked demand is counted inside the same total. |
| Market Tracker B | USD 9.68 B (2024) | Anchors the model on a 2024 base and leans on reported revenue and volume framing, which can understate later-period pricing shifts and does not always separate sensors from adjacent flow measurement hardware consistently. |
Taken together, the spread is mostly explained by what is counted in the product scope, which year is used as the anchor, and how price progression is applied across technologies. Our approach stays traceable because the demand pool is linked to clear end-use activity signals and then cross-checked with real-world pricing and adoption feedback before forecasts are extended.


Key Questions Answered in the Report
What is the current size of the flow sensors market?
The global flow sensors market stands at USD 9.62 billion in 2026 and is set to reach USD 12.64 billion by 2031.
Which technology segment is growing the fastest?
Ultrasonic flow sensors post the highest 7.02% CAGR through 2031 thanks to non-invasive clamp-on retrofits and improved signal processing.
Why are water utilities investing in flow sensors?
Smart-water mandates push utilities to cut non-revenue water and modernize aging pipelines, driving a 7.12% CAGR in the water and wastewater segment.
How do semiconductor shortages affect the market?
Extended lead times for microcontrollers delay production of IIoT-enabled meters, shaving 0.6 percentage points from forecast CAGR.
Page last updated on:


